ISSN Online: 2158-7086 ISSN Print: 2158-706X
Acid-Base Properties of Aqueous Suspensions
of Homoionic Sepiolite and Palygorskite
Silvia G. Acebal
*, Leticia I. Vico
Departamento de Química, Universidad Nacional del Sur, Bahía Blanca, Argentina
Abstract
Acid-base properties of Na-sepiolite and Na-palygorskite were studied by po-tentiometric titrations at 298 K and two ionic strength I = 0.1 and I = 0.002. Intrinsic constants of deprotonation were calculated by two different me-thods: a) Stumm method, by extrapolating to zero the function that relates surface charge with the logarithms of apparent acidity constants and b) with MINTEQ program by minimizing the differences between surface H+
concen-tration data and the values obtained from deprotonation constants proposed according to the Diffuse-Double-Layer Model (DDLM). Hydroxyl groups lo-cated at the broken edges of these fibrous clay minerals (SOH) and permanent charge sites (X−) were considered as reactive sites. The determined values of
the acid-base constants for Na-sepiolite and Na-palygorskite were interme-diate between those for SiO2 and γ-Al2O3, which is in agreement with minerals
that contain moderately strong-acidity and weak-acidity surface groups. The SOH groups showed an initial increase (after SOH2+ deprotonation), forming
a plateau with a slight decrease at high pH values (8-9) due to the formation of SO− sites. X− sites adsorbed H+, Na+ or Mg2+ ions.
Keywords
Fibrous Clay Minerals, Sorption Properties, Surface Speciation
1. Introduction
Sepiolite and palygorskite are classified as phyllosilicates, because according to the definition of this mineral group [1], they contain a continuous two-dimen- sional tetrahedral sheet. However, they differ from the other layer silicates in lacking continuous octahedral sheets (Figure 1).
Consequently, ribbons containing MgO6 (AlO6) octahedral groups and
rec-tangular channels run parallel across to the octahedral sheet [4], the width of the ribbons and the channels differing a little in sepiolite and in palygorskite. In pa-
How to cite this paper: Acebal, S.G. and Vico, L.I. (2017) Acid-Base Properties of Aqueous Suspensions of Homoionic Sepi-olite and Palygorskite. Natural Resources, 8, 432-444.
https://doi.org/10.4236/nr.2017.86028
Received: March 29, 2017 Accepted: June 19, 2017 Published: June 23, 2017
Copyright © 2017 by authors and Scientific Research Publishing Inc. This work is licensed under the Creative Commons Attribution International License (CC BY 4.0).
(a)
[image:2.595.263.487.69.406.2](b)
Figure 1. (a) Schematic structure of palygorskite [2]; (b) Sepiolite structure [3]. Figure adapted from [4], 1988, and [5].
lygorskite, Mg2+ occupies only 29% to 76% of the octahedral sites while in
se-piolite, it fills 90% to 100% of these sites [6]. The structure of these clay miner-als includes three types of active adsorption sites: basal O atoms on the tetra-hedral sheets of the ribbons, H2O molecules coordinated to Mg2+ at the edges
of structural ribbons and SiOH groups associated in large number with ter-minal Si tetrahedral at the external surfaces. Other structural surface groups such as Al2-OH, Al-OH, and Mg-OH have been detected in palygorskite [7]. It
is likely that some other hydroxyl groups may appear on the external surface of the clay minerals where broken bonds give rise to incomplete tetrahedral or octahedral structural units. In addition, as a result of some isomorphous re-placement in the tetrahedral sheet, such as Al3+ for Si4+, negatively charged
ad-sorption sites are observed. This structural charge must be balanced by cations at or near the mineral surface. The spatial distribution of these exchangeable “counterions” in the vicinity of the surface greatly affects the colloidal beha-vior of clay minerals.
The acid-base properties of the surface may have a relevant role on these adsorp-tion processes. The interacadsorp-tion of clay mineral surfaces with H+ and OH− must
be known when surface models are used to explain the adsorption mechanism of different chemical species. A great deal of effort has been expended in develop-ing models to describe the clay interfacial region. Some researchers have as-sessed the adsorption of H+ and different metallic ions on hydrous oxides, soils,
soil fractions and clay minerals [8]-[19]. In these works, a wide variety of ther-modynamic models describing the adsorption of chemical species to different surfaces have been developed, including the constant capacitance model (CCM), the diffuse-double-layer model (DDLM), the triple-layer model (TLM), and the multisite complexation model (MUSIC). The first group (CCM, DDLM and TLM), also termed two-pk models, treats the surfaces on a single-site basis. These models have been successfully used in describing acid-base behavior in smectitic clay minerals. However, only a few works deal with fibrous clay miner-als as sepiolite and/or palygorskite whose edge surfaces miner-also present reactive Mg-OH groups. The aim of this study was to explain acid-base properties of Na-sepiolite and Na-palygorskite by modeling adsorption processes based on the existence of different structural sites using the DDLM. The DDLM model was chosen because of the simplicity of the application considering the weakness of clay mineral samples.
2. Materials and Methods
2.1. Clay Minerals
A sepiolite from Vallecas (Madrid) and a palygorskite from Torrejón el Rubio (Cáceres), Spain, were used as adsorbents in this study. The < 2 µm fraction was
saturated with Na+ by repeated washing with 5 × 10⁻¹ M NaCl solution. Excess
salt was removed by several washings with bidistilled water until Cl− detection
using 0.5 M AgNO3 became negative. Then, the air-dried Na-clay mineral was
gently ground in a porcelain mortar.
Specific surface area was determined by N2 adsorption at the temperature of
liquid N2, after degassing the samples. The classical BET equation was used for
external surface area calculation. Total surface area was determined by ethylene glycol monoethyl ether (EGME) method [20].
Cation exchange capacity (CEC) of the samples was obtained by saturation with a buffered-pH 7 1 M NH4-acetate [21].
X-Ray diffraction (XRD) was performed using CuKα (1.5046 Å) radiation (35
kV, 15 mA) on a Rigaku Geiger Flex, DMax III-C horizontal goniometer equipped with a microcomputer system with graphite monochromator.
IR spectra were obtained on a Nicolet FTIR, Nexus 470 spectrophotometer using an Avatar Diffuse Reflectance accessory for the solid dispersion as KBr (1.35 mg of sample:295 mg of KBr).
2.2. Surface Charge Determinations
Proton surface-charge determinations were performed by potentiometric titra-tion of the suspensions with 0.1 M HNO3 and 0.1 M NaOH solutions at 298 K,
under N2 atmosphere for displacing the dissolved CO2.
The suspensions were prepared in 0.1 M or 0.001M NaNO3 solutions. In the
first case the ionic strength remained constant during titrations, but in the second case it varied in the range 0.001 to 0.003 due to acid or base additions. Then, in this study, the lower ionic strength will be considered to be I = 0.002. The suspensions were shaken for 5 minutes, and pH was measured at one- minute intervals after the addition of acid (or base) to reach a new titration point. The initial pH was 8.2 for Na-sepiolite, and 9.0 for Na-palygorskite. When potentiometric titration was ended the suspensions were centrifuged, and free Mg2+ concentration was determined in the supernatant solutions by Atomic
Ab-sorption Spectrometry using a GBC 932 B computerized spectrometer. Poten-tiometric titrations in the absence of the clay minerals (blanks) were also per-formed. A Cole-Parmer pHmeter was used. In all the experiments, the concen-tration of adsorbent in the solution was 10 g L−1. All experiments were carried
out in duplicate.
2.3. Chemical Equilibria
Hydroxyl groups located at the broken edges of these fibrous clay minerals and permanent charge sites will be called SOH groups and X− sites respectively. They
are assumed to participate in pH-dependent protonation-deprotonation reac-tions and cation adsorption reacreac-tions as follows [23]:
2 a1app
SOH+ ⇔SOH+H+ k (1)
[
]
a1app 2 SOH H SOH k + + = a2appSOH⇔SO−+H+ k (2)
[
]
a2app SO H SOH k − + = XHX−+H+ ⇔XH k (3)
XNa
X−+Na+ ⇔XNa k (4)
2
2
2 X Mg
2X−+Mg+ ⇔X Mg k (5)
where kXH, kXNa and kX Mg2 are X
− permanent charge site constants. Eq 5 takes
into account the possible re-adsorption of free Mg2+ released during the
treat-ment from octahedral sheet.
In eqs 1 and 2, ka1app and ka2app represent “conditional or apparent acidity”
are expressions of the law of mass action in system subject to an electric field, which can be written
[
]
1int 2 SOH H exp SOH a F k RT ψ + + = − (6)
[
]
2int SO H exp SOH a F k RTψ
− + = −
(7)
ka1int and ka2int represent intrinsic acidity equilibrium constants,
[ ] is molar concentration (mol L−1),
ψ is the surface potential,
F is Faraday´s constant.
R is universal gas constant,
T is temperature (K).
2.4. Calculation Procedures
Surface charge data were analyzed in two different ways:
1) Stumm method was used to obtain the two unique intrinsic acidity con-stants (Equations (6) and (7)), which determine acid-base characteristics of the surface.
This method extrapolates to zero the function that relates surface charge (Q) with the logarithms of “conditional or apparent acidity” constants ka1app and ka2app [24].
Note that in Equations (1) and (2) [H+] = 10–pH, and in the acid zone,
[
SOH]
total sites(
total surface sites)
SOH2+
= = − (8)
and in the basic zone,
[
SOH]
=total sites=(
total surface sites)
− SO− (9)Total surface sites were considered as the maximum H+ or OH− adsorption of
surface groups.
[
]
(
)
(
[
]
)
2 3 3
SOH+ HNO added to suspension HNO added to blank
= −
(10)
[
]
(
)
(
[
]
)
SO− NaOH added to suspension NaOH added to blank
= −
(11)
On the other hand, the charge due to interaction between H+ and OH− ions
and the surface groups is accessible from the titration curves based on charge balance as follows:
2
H OH SO SOH
B A
C −C + + − − = − − += −Q (12)
where CB and CA are the concentrations (mol L−1) of added strong base and
added strong acid, respectively.
With reference to Equations (10) and (11)
2
SOH+ ~Q in the acid zone
(13)
SO− ~Q in the basic zone
Finally, a plot of the negative logarithm of ka1app and ka2app versus Q will yield
the negative logarithm of the intrinsic equilibrium constant (ka1int and ka2int),
upon linear extrapolation to zero surface charge.
2) MINTEQ program [25] allowed the calculation of ka1app, ka2app, kXH, kXNa and
2
X Mg
k (Equations (1)-(5)) by minimizing the differences between experimental
surface [H+] and the data set obtained by the program from deprotonation
con-stants proposed.
To account for these experimental results the diffuse-double-layer model (DDLM, plane geometry, without counter-ion accumulation) with the option “fixed surface charge”, which permit representation of X− sites surface reactions
(Equations (3)-(5)) was used.
3. Results and Discussion
3.1. Surface and Exchange Properties of Clay Minerals
Some surface and exchange properties of the selected homoionic samples are reported in Table 1. BET specific areas were smaller than EGME areas since the first method is used to determine only the external surface area. The BET-N2
surface area of Na-sepiolite was found to be 251.5 m2 g−1 (at −197˚C) and 478
m2 g−1 with EGME vapor adsorption (at 25˚C), assuming a molecular cross-sec-
tional area of 52 Å, indicating a possible greater penetration of pores and chan-nels by EGME vapor compared to N2 under these conditions. The same behavior
was observed in Na-palygorskite (Table 1). Channel surfaces are also reported (see Table 1). CECs and specific surface area values obtained are in agreement with the reported values in the literature for reference minerals [6].
XRD patterns showed a highly pure sepiolite sample and a well-crystallized palygorskite sample containing some quartz as impurity. Sepiolite gave a strong XRD line at 12.12 Ǻ with moderate reflections at, 4.49, 4.29, 4.02, 3.74, 3.34, and 3.18, and diffuse reflections at 7.5, and 5.04 Å. For palygorskite, a strong reflec-tion occurred at 10.52 Å, and moderate reflecreflec-tions at 6.36 to 6.44, 5.38 to 5.42, 4.46 to 4.49, 4.24 to 4.26, 3.61 to 3.69, and 3.23 Å.
IR absorption spectra of both clay minerals permitted the vibration band as-signments. Sepiolite showed stretching vibrations of structural OH in the edge silanol groups and in the octahedral sheet (3685 cm−1), OH-stretching bands of
coordinated H2O (3619; 3561 cm−1), adsorbed H2O stretching vibration (3371;
3231 cm−1), OH-bending vibration of coordinated H
2O (1662; 1625 cm−1),
[image:6.595.210.539.659.731.2]stret-ching vibration of Si-O in tetrahedral sheet (1211 cm−1), stretching vibration of
Table 1. Some characteristics of the fibrous clay minerals.
Sample Specific Surface Area (m
2 g−1) Cation Exchange
Capacity [21]
(cmolc kg−1) CEC
Channel Dimensions [6] (Å) BET EGME [20]
Na-Sepiolite 251.5 478.0 26.6 3.7 × 10.6
Si-O-Si groups (bridges between alternating Al-Mg-silicate ribbons) (900 - 1000 cm−1) and Si-O-bending vibrations (478; 466 cm−1). In the same region (465 -
470 cm−1) would be overlapped Si-O-Mg vibration. For palygorskite stretching
vibration of structural OH in edge (Mg, Al)-OH groups (3611; 3576; 3541 cm−1),
OH-stretching bands of adsorbed H2O (3379; 3274 cm−1), OH-bending vibration
of coordinated H2O (1658 cm−1), stretching vibration of Si-O in tetrahedral sheet
(1188; 1122; 1091; 1029; 982 cm−1), stretching vibration of Si-O-Si groups
(bridges between alternating Al-Mg-silicate ribbons) (1188 cm−1), Si-O-Al
bending vibration (513 cm−1), Si-O bending vibration (482 cm−1), Si-O-Mg
bending vibration (450 cm−1) were observed. These assignments are in
agree-ment with the reported values in the literature for reference minerals [6]. Details of XRD patterns and IR spectra can be found in [26].
The approximately formula of the unit cell of the minerals was determined for sepiolite [Na0,025Ca0,088K0,10Mg8,16Si11,27Al0,64Fe0,12O30(OH)4(H2O)4] and
palygors-kite [Na0,22Mg2,53 Al1,78Si7,88Al0,22Fe0,37O20(OH)4(H2O)4)]. Some substitution of Si4+
by Al3+ and Fe3+ in the tetrahedral sheet was observed.
3.2. Protonation-Deprotonation Equilibria
Data providing proton adsorption on homoionic forms of sepiolite and paly-gorskite at I = 0.1 and I = 0.002 (titration points) are shown in Figure 2. How-ever, it should be noted that these potentiometric titration curves take account of dissolution processes involving structural Mg2+ ions. Acid amount associated
with Mg2+ dissolution was discounted from initial acid amount (2H+ by Mg2+
[image:7.595.261.486.456.704.2]re-leased). To gain insight into the nature of proton adsorption and in order to confirm the relative position of the curve, i.e. to determine if protons adsorp-
Figure 2. Proton adsorption on Na-sepiolite and Na-palygorskite in NaNO3 solution.
tion increases or decreases with the increase of I; at different points of the titra-tion curve on extreme pH values, some drops of NaNO3 saturated solution were
added. These additions produced a decrease in pH values at pH 3 and pH 10. Then, it can be assumed that the titration curves run parallel one to the other, without crossing points, in both clay minerals. In this case, the behavior of Na- sepiolite and Na-palygorskite is in agreement with the behavior of permanent charge phyllosilicates. At I = 0.002 some Mg2+ structural sites are released by
dissolution, so these sites are able to capture H+.
3.3. Deprotonation Equilibria Calculated According to
Stumm Method
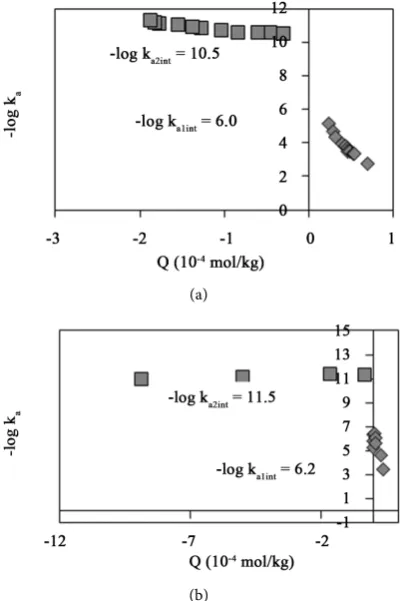
Figure 3 shows Stumm’s method of calculation for the intrinsic deprotonation constants and the values obtained for ka1int and ka2int.
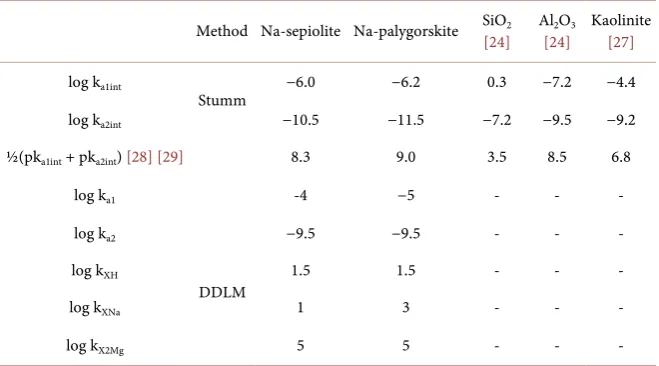
Intrinsic protonation-deprotonation (Stumm and DDLM) constants and ½ (pka1int + pka2int) values are listed inTable 2.
The comparison between the deprotonation constants (ka1int and ka2int) of SiO2
greater than γ-Al2O3 constants highlighted the known fact that, Si-OH groups in
SiO2 are more acid than Al-OH groups in γ-Al2O3 (see Table 2). The calculated
values for ka1int constants of Na-sepiolite and Na-palygorskite were intermediate
between those for SiO2 and γ-Al2O3 according with minerals that con-
(a)
[image:8.595.273.475.386.687.2](b)
Figure 3. Conditional deprotonation constants as a function of surface charge for Na-sepiolite and Na-palygorskite suspended in 0.1 M NaNO3. Intrinsic constants are
Table 2. Deprotonation constants for Na-sepiolite and Na-palygorskite by Stumm and DDLM methods.
Method Na-sepiolite Na-palygorskite SiO2
[24] Al[24]2O3 Kaolinite [27]
log ka1int
Stumm −6.0 −6.2 0.3 −7.2 −4.4
log ka2int −10.5 −11.5 −7.2 −9.5 −9.2
½(pka1int + pka2int) [28] [29] 8.3 9.0 3.5 8.5 6.8
log ka1
DDLM
-4 −5 - - -
log ka2 −9.5 −9.5 - - -
log kXH 1.5 1.5 - - -
log kXNa 1 3 - - -
log kX2Mg 5 5 - - -
tain moderately strong-acidity and weak-acidity surface groups, although the values were more similar to those of γ-Al2O3. Sepiolite and palygorskite have
abundant Mg2+ in the octahedral layer, and therefore since Mg-OH edge groups
are of lower acid character than Al-OH groups, the lower ka2int constant values
are consistent with the presence of Mg-OH groups.
For pure oxides, the magnitude ½(pka1int + pka2int) indicates the point of zero
net proton charge (znpc), but for fibrous clay minerals like sepiolite and paly-gorskite it shows both the acidity of the surface groups and the pH value towards which aqueous clay suspensions tends. The calculated ½(pka1int + pka2int) values
for both clay minerals reflect the composition of sepiolite and palygorskite showing the influence of the different constituents: SiO2 (znpc = 3.5), MgO
(znpc = 12.0), and γ-Al2O3 (znpc = 8.5).
In addition, sepiolite and palygorskite have permanent negative charge. This charge is found diffused throughout the structure causing a negative electric field and this fact could be another cause for the observed lower acidity on the edge groups.
3.4. Deprotonation Equilibria Analyzed through the Surface
Speciation Using MINTEQ Program with DDLM
The comparison of the intrinsic constants calculated by Stumm method and those obtained by MINTEQ (Table 2) shows little agreement between them. This distinctive feature can be related with the limitations of both theoretical methods. In Stumm method, the constants ka1int and ka2nt involve all the acid-base
reactions while in DDLM the constants are unfold in a set of various constants ka1, ka2, and kXH.
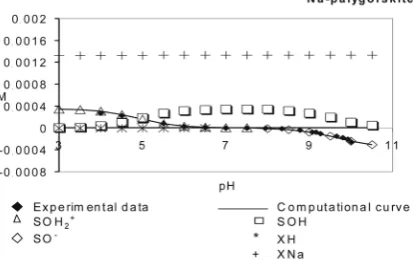
Figure 4 (Na-sepiolite) and Figure 5 (Na-palygorskite) show the fitting be-tween the H+ adsorption experimental points and the theoretical curve
Figure 4. Computed adsorption of H+ and OH− and distribution of surface species for
Na-sepiolite at I = 0.1.
Figure 5. Computed adsorption of H+ and OH− and distribution of surface species for
Na-palygorskite at I = 0.1.
The surface sites SOH2+ decrease as pH increases for both clay minerals. The
surface sites SO− increase as pH increases (this behavior can be observed from
8 - 9 pH units). The SOH groups initially increase (after SOH2+ deprotonation)
then, a plateau with a slight decrease at pH higher than 8 or 9 is observed. The decrease is due to the formation of SO− sites.
The permanent charge sites are usually found as XNa at I = 0.1 as can be seen in Figure 5. At low ionic strength (I = 0.002), for both clay minerals (Figures are not show), the sites are sodium-free and occupied by Mg2+ but at very low
con-centration (X2Mg = 1.6 × 10⁻⁶).
According to the DDLM, H+, OH− and Na+ ions are considered adsorbed in
the surface plane, as inner-sphere complexes. This is accepted by the traditional theory for the first two ones (usually known as potential determining ions), but not for Na+. The small Na+ ion remains as an outer-sphere complex (surrounded
by a solvation shell) due to its great hydration energy.
Lately, for the analysis of surface structure of clay minerals, and H+, OH−, and
some cations adsorption new computer treatments (Monte Carlo simulation and Molecular Dynamics [30]) have been applied. The aim is to reproduce the ther-modynamic equilibrium properties of a system in which the particles interact through potential energy functions. One of the most interesting aspects that have been studied in this context is the site type in which Na+ is adsorbed on the
[image:10.595.271.478.250.380.2]adsorbed on the edges as inner sphere complexes.
4. Conclusions
Intrinsic constants of deprotonation were calculated by two different ways: 1) Stumm method, by extrapolating to zero the function that relates Q with the logarithms of apparent acidity constants.
2) Using MINTEQ program by minimizing the differences between surface [H+] data and the values calculated from deprotonation constants proposed
ac-cording to DDLM.
The calculated values for kaint constants of these clay minerals were
interme-diate between those for SiO2 and γ-Al2O3 being in agreement with minerals that
contain moderately strong-acidity and weak-acidity surface groups, although the values were more similar to those of γ-Al2O3.
The comparison of the intrinsic constants calculated by the Stumm method and those calculated by MINTEQ program showed little coincidence between them.
Experimental values were in agreement with data from MINTEQ program. In surface species distribution, SOH2+ surface sites decreased as pH increased, SOH
groups (usually considered the reactive sites to cation complexation) initially in-creased forming a plateau with a slight decrease (pH 8 - 9) due to the formation of SO− sites. X− sites (permanent negative charge) resulting from isomorphic
substitutions or vacancies in the mineral structure adsorbed H+, Na+ or Mg2+
ions.
Acknowledgements
The authors thank Secretaría de Ciencia y Tecnología de la Universidad Nacional del Sur, Bahía Blanca, Argentina (Project: 24/Q051) for the financial support.
References
[1] Brindley, G.W. and Pedro, G. (1972) Report of the AIPEA Nomenclature Commit-tee. AIPEA Newsletter, 4, 3-4.
[2] Bradley, W.F. (1940) The Structural Scheme of Attapulgite. American Mineralogist, 25, 405-410.
[3] Brauner, K. and Preisinger, A. (1956) Struktur und Enstehund des Sepioliths.
Tschermaks Mineralogische und Petrographische Mitteilungen, 6,120-140.
https://doi.org/10.1007/BF01128033
[4] Jones, B.F. and Galán, E. (1988) Sepiolite and Palygorskite. In: Bailey, S.W., Ed., Re-views in Mineralogy. Hydrous Phyllosilicates, Vol. 19, Mineralogical Society of America, Michigan, 631-674.
[5] Singer, A. (2002) Palygorskite and Sepiolite. In: Dixon, J.B. and Schulze, D.G., Eds.,
Soil Mineralogy with Environmental Applications, Soil Science Society of America, 555-583.
829-872.
[7] Cao, E., Bryant, R. and Williams, D.J.A. (1996) Electrochemical Properties of Na- Attapulgite. Journal of Colloid and Interface Science, 179, 143-150.
https://doi.org/10.1006/jcis.1996.0196
[8] Lu, W. and Smith, E.H. (1996) Modelling potentiometric titration behavior of glau-conite. Geochimica et Cosmochimica Acta, 60, 3363-3373.
[9] Bradbury, M.H. and Baeyens, B. (1997) A Mechanistic Description of Ni and Zn Sorption on Na-Montmorillonite. Part II: Modelling. Journal of Contaminant Hy-drology, 27, 223-248.
[10] Baeyens, B. and Bradbury, M.H. (1997) A Mechanistic Description of Ni and Zn Sorption on Na-Montmorillonite. Part I: Titration and Sorption Measurements.
Journal of Contaminant Hydrology, 27, 199-222.
[11] Baeyens, B. and Bradbury, M.H. (2005) Experimental Measurements and Modeling of Sorption Competition on Montmorillonite. Geochimica et Cosmochimica Acta, 69, 4187-4197.
[12] Spathariotis, E. and Kallianou, C. (2001) Adsorption of Copper, Zinc, and Cad-mium on Clay Fraction of Two Acid Soils: Surface Complexation Modeling. Com-munications in Soil Science and Plant Analysis, 32, 3185-3205.
https://doi.org/10.1081/CSS-120001115
[13] Duc, M., Gaboriaud, F. and Thomas, F. (2005) Sensitivity of the Acid-Base Proper-ties of Clays to the Methods of Preparation and Measurement: 1. Literature Review.
Journal of Colloid and Interface Science, 289, 139-147.
[14] Duc, M., Gaboriaud, F. and Thomas, F. (2005) Sensitivity of the Acid-Base Proper-ties of Clays to the Methods of Preparation and Measurement: 2. Evidence from Continuous Potentiometric Titrations. Journal of Colloid and Interface Science, 289, 148-156.
[15] Arda, D., Hizal, J. and Apak, R. (2006) Surface Complexation Modeling of Uranyl Adsorption onto Kaolinite Based Clay Minerals Using FITEQL 3.2. Radiochimica Acta, 94, 835-844.https://doi.org/10.1524/ract.2006.94.12.835
[16] Bourg, I.C., Sposito, G. and Bourg, A.C.M. (2007) Modeling the Acid-Base Surface Chemistry of Montmorillonite. Journal of Colloid and Interface Science, 312, 297- 310.
[17] Gaskova, O.L. and Bukaty, M.B. (2008) Sorption of Different Cations onto Clay Minerals: Modelling Approach with Ion Exchange and Surface Complexation.
Physics and Chemistry of the Earth, 33, 1050-1055.
[18] Serrano, S., O’Day, P.G., Vlassopoulos, D., García-González, M.T. and Garrido, F. (2009) A Surface Complexation and Ion Exchange Model of Pb and Cd Competitive Sorption on Natural Soils. Geochimica et Cosmochimica Acta, 73, 543-558.
[19] Malamis, S. and Katsou, E. (2013) A Review on Zinc and Nickel Adsorption on Natural and Modified Zeolite, Bentonite and Vermiculite: Examination of Process Parameters, Kinetics and Isotherms. Journal of Hazardous Materials,252-253, 428- 461.
[20] Carter, D.L., Heilman, M.C. and González, C.L. (1965) Ethylene Glycol Monoethyl Ether for Determining Surface Area of Silicate Minerals. Soil Science,100, 356-360.
https://doi.org/10.1097/00010694-196511000-00011
[22] Hossner, L.R. (1996) Methods of Soil Analysis. Part 3. Chemical Methods. In: Spark, D.L., Ed., Dissolution for Total Elemental Analysis, Soil Science Society of America and American Society of Agronomy, Madison, 49-64.
[23] Charlet, L., Schindler, P.W., Spadini, L., Furrer, G. and Zysset, M. (1993) Cation Adsorption on Oxides and Clays: The Aluminum Case. Aquatic Science, 55, 291- 303.https://doi.org/10.1007/BF00877274
[24] Stumm, W., Hohl, H. and Dalang, F. (1976) Interaction of Metal Ions with Hydrous Oxide Surfaces. Croatica Chemica Acta, 48, 491-504.
[25] Gustafsson, J.P. (2004) Visual MINTEQ ver. 2.30, KTH. Royal Institute of Tech-nology, Sweden.
[26] Vico, L.I. and Acebal, S.G. (2008) Adsorption of Manganese (II) from Aqueous So-lutions by Na-Sepiolite and Na-Palygorskite. Agrochimica, 52, 209-225.
[27] Schindler, P.W., Lietchti, P. and Westall, J.C. (1987) Adsorption of Copper, Cad-mium and Lead from Aqueous Solution to the Kaolinite/Water Interface. Nether-lands Journalof Agricultural Science, 35, 231-240.
[28] Parker, J.C., Zelazny, L.W., Sampath, S. and Harrris, W.G. (1979) A Critical Evalua-tion of the Extension of Zero Point of Charge (ZPC) Theory to Soil Systems. Soil Science Society America Journal,43, 668-674.
https://doi.org/10.2136/sssaj1979.03615995004300040008x
[29] Sposito, G. (1981) The Operational Definition of the Zero Point of Charge in Soils.
Soil Science Society America Journal,45, 292-297.
https://doi.org/10.2136/sssaj1981.03615995004500020013x
[30] Skipper, N.T. (2003) Molecular Modeling of Clays and Mineral Surfaces. CMS Workshop Lectures Vol. 12.
[31] Cygan, R.T. (2003) Molecular Modeling of Clays and Mineral Surfaces. CMS Workshop Lectures Vol. 12.
Submit or recommend next manuscript to SCIRP and we will provide best service for you:
Accepting pre-submission inquiries through Email, Facebook, LinkedIn, Twitter, etc. A wide selection of journals (inclusive of 9 subjects, more than 200 journals)
Providing 24-hour high-quality service User-friendly online submission system Fair and swift peer-review system
Efficient typesetting and proofreading procedure
Display of the result of downloads and visits, as well as the number of cited articles Maximum dissemination of your research work
Submit your manuscript at: http://papersubmission.scirp.org/
![Figure 1. (a) Schematic structure of palygorskiteadapted from [2]; (b) Sepiolite structure [3]](https://thumb-us.123doks.com/thumbv2/123dok_us/7748787.709522/2.595.263.487.69.406/figure-schematic-structure-palygorskiteadapted-b-sepiolite-structure.webp)