IUCr
J
ISSN 2052-2525
CHEMISTRY
j
CRYSTENG
Received 19 January 2017 Accepted 9 February 2017
Edited by A. Fitch, ESRF, France
Keywords:perovskite; ferroelectric; powder neutron diffraction.
This is an Inaugural Article by Phil Lightfoot, who joined the Editorial Board ofIUCrJin 2016. Phil Lightfoot is Professor of Solid State Chem-istry at the University of St Andrews. His first degree was in Chemistry at Oxford, where he remained to carry out a D.Phil with Professor Tony Cheetham. Two post-doctoral positions were held at Leeds University and Argonne National Lab, prior to taking a faculty position in St Andrews in 1990. His research interests have spanned many fields across solid state chemistry and crystallography, with the emphasis on designing, synthesising and understanding new functional materials. This has included early work on cuprate superconductors, polymer electrolytes,ab initiopowder diffraction methods, porous solids and, more recently, studies of ferroelectric and magnetic oxides and fluorides. In total he has published nearly 300 papers, the majority of which involve a key role for crystallography and diffraction methods.
Supporting information:this article has supporting information at www.iucrj.org
Unprecedented phase transition sequence in the
perovskite Li
0.2Na
0.8NbO
3Charlotte A. L. Dixon,aJason A. McNulty,aSteven Huband,bPamela A. Thomasb and Philip Lightfoota*
aSchool of Chemistry and EaStCHEM, University of St Andrews, St Andrews KY16 9ST, Scotland, andbDepartment of
Physics, University of Warwick, Coventry CV4 7AL, England. *Correspondence e-mail: pl@st-andrews.ac.uk
The perovskite Li0.2Na0.8NbO3 is shown, by powder neutron diffraction, to
display a unique sequence of phase transitions at elevated temperature. The ambient temperature polar phase (rhombohedral, space groupR3c) transforms
viaa first-order transition to a polar tetragonal phase (space groupP42mc) in the
region 150–300C; these two phases correspond to Glazer tilt systemsa aa
anda+a+c, respectively. At 500C a ferroelectric–paraelectric transition takes
place from P42mc to P42/nmc, retaining the a +
a+c tilt. Transformation to a single-tilt system,a0a0c+(space groupP4/mbm), occurs at 750C, with the final
transition to the aristotype cubic phase at 850C. TheP4
2mcandP42/nmcphases
have each been seen only once and twice each, respectively, in perovskite crystallography, in each case in compositions prepared at high pressure.
1. Introduction
Perovskites continue to fascinate solid-state scientists, both for their chemical and structural diversity and for their ever-growing list of physical and chemical properties and applica-tions (Chakhmouradian & Woodward, 2014; Jeonet al., 2014). Considerable effort in the last few years has focused on alkali metal niobate perovskites for their promising piezoelectric and electro-optic properties (Joet al., 2009; Saitoet al., 2004). Within this family, the LixNa1xNbO3(hereafter abbreviated
LNN-X, where Xrepresents the % Li composition) system has been shown to display some curious features at ambient temperature (Peel et al., 2013). Detailed crystallographic characterization of this system at elevated temperatures has only been reported for one specific composition, LNN-12 (Mishraet al., 2015). As part of a more comprehensive study of the high-temperature phase diagram of LNN-Xwe now report a detailed study of LNN-20 by high-resolution powder neutron diffraction. This reveals some unique structural behaviour, including two very rare structural variants of perovskite, based on an unusual combination of tilting of NbO6octahedra.
2. Experimental
2.1. Synthesis
LNN-20 was prepared by traditional ceramic methods. Stoichiometric amounts of Na2CO3 (99.9% Sigma-Aldrich),
Li2CO3 (99.9% Sigma-Aldrich) and Nb2O5 (99.9% Alfa
10min1
. We assume no deviation of alkali metal content due to volatility, and a fixed Li/Na and (Li,Na)/Nb ratio in the subsequent analysis.
2.2. Powder diffraction
Sample purity was analysed by powder X-ray diffraction using a Rigaku miniflex 600 X-ray diffractometer using CuK1,2(= 1.54056, 1.54439 A˚ ) radiation. Powder neutron
diffraction (PND) data were collected on the HRPD instru-ment at the ISIS facility at selected temperatures between 20 and 900C. The sample was contained in a cylindrical
vana-dium can. For data analysis, two detector banks, centred at
168 and 90, and coveringd-spacing ranges of 0.7 < d<
2.6 A˚ and 0.9 <d< 4.0 A˚ , respectively, were used. Data were analysed by the Rietveld method, using the GSAS/EXPGUI
package (Larson & Von Dreele, 1994; Toby, 2001), and interpretation of the results was assisted using symmetry mode analysisviatheISODISTORTsuite (Campbellet al., 2006). A consistent refinement strategy was used in each case, including 3, 2, 18 and 6 parameters to model instrumental variables, scale factors, background and peak-shapes for each dataset, together with appropriate lattice parameters, atomic coordi-nates (Li and Na constrained to be equal) and atomic displacement parameters (Li and Na constrained to be equal, and some additional constraints, detailed later).
2.3. Second-harmonic generation (SHG)
A polycrystalline powder sample of LNN-20 was contained in glass cells capable of withstanding a high-temperature study. Calibration of the furnace was then performed, followed by null checks, before the sample was placed in a small furnace consisting of an aperture normal to the orien-tation of the sample. Through these apertures an intense beam (100 mJ, 100 ms pulse) was exposed to the sample from a Q-switched Nd:YAG laser (= 1064 nm) following the setup of Kurtz & Perry (1968). Filtration with a green filter of the scattered radiation was carried out to remove traces of the fundamental beam whilst the second harmonic signal (if any was present) was measured using a photomultiplier (PMT) and subsequently displayed on an oscilloscope as signalversus
time. A beam splitter and photodiode were utilized to monitor the fundamental beam, allowing for the necessary corrections to variations in the laser output. The intensity of the second harmonic was then normalized by dividing by the square of the intensity of the incident beam (Kurtz & Perry, 1968). Repeat measurements as a function of temperature were made to remove the effects of any residual strain from the sample preparation and to ensure the reproducibility of the results.
2.4. Dielectric measurements
Pellets were electroded with Ag paste (RScomponents) or sputtered Au. Dielectric measurements were performed with a Wayne Kerr 6500B impedance analyser with the sample mounted in a tube furnace. Capacitance and loss data were recorded in the frequency range 100 Hz–10 MHz on heating
and cooling at a rate of 2 K min1over the temperature range ambient to approximately 600C.
3. Results and discussion
3.1. Thermal evolution of the crystal structure
3.1.1. Room temperature to 500C. At ambient tempera-ture the PND data can be successfully modelled using a majority perovskite phase of space-group symmetry R3c, in agreement with our earlier work (Peelet al., 2013). There is a minor additional rhombohedral phase present all the way to 900C; this phase corresponds to a LiNbO
3-like material,
essentially isostructural to the majority perovskite phase, but of composition close to LiNbO3. The co-existence of two
distinct rhombohedral phases has been noted in our previous work (Peelet al., 2013), with the Li-rich phase being labelled ‘Li-R3c’ in that work. Two phase refinements suggest a phase fraction, constantversus T, of only3% for the Li-R3cphase. Thus for simplicity, and to allow more valid comparisons of the various models to be discussed for the majority perovskite phase, we have chosen not to incorporate this minor phase into all of the refinements presented here. It is most clearly seen at the highest temperatures, and is highlighted in a two-phase refinement of the data at 900C (see Fig. S3 of the
supporting information). All further discussions omit refer-ence to the minor Li-R3cphase.
The majority rhombohedral phase, which corresponds to the Glazer tilt systemaaa, but also includes an additional
polar distortion, may be considered isostructural with the low-temperature form of NaNbO3(and as a less distorted version
of the stable phase of LiNbO3). On warming to 150C a second
phase is seen to appear, which becomes the only phase present by 300C (these two phases co-exist at temperatures of 150,
200 and 250C, with phase fractions of 74/26, 20/80 and
7/93%, respectively, which provides evidence of a first-order phase transition).
Careful Rietveld analysis is required to ascertain the exact nature of the higher-temperature phase. Perovskite crystal-lography is often dominated by the presence of characteristic ‘octahedral tilt’ distortions: in simple cases (i.e.for a 222 array of corner-linked octahedra) there are options of ‘in-phase’ or ‘out-of-‘in-phase’ tilts relative to each of the three axes of the parent cubic phase. The possible combinations of these tilts were first classified by Glazer (1972) and subsequently re-assessed using group-theoretical methods to produce 15 unique possibilities (Howard & Stokes, 1998). Thus, for example, the Glazer symbol aaa signifies equal
out-of-phase tilts around all three axes of the parent cubic out-of-phase. The simplest and least ambiguous means of determining which tilt system is present is to identify characteristic peaks in the diffraction pattern which are due to either in-phase or out-of-phase tilts. These independent sets of peaks may be designated by the labelsMandR, or more specificallyM3
+
(in-phase tilt) andR4
+
(out-of-phase tilt).
Key portions of the diffraction patterns of LNN-20 at 100C
superlattice peaks (due predominantly to octahedral tilting) are located atRpositions only in the former, but at bothRand
Mpositions in the latter; in other words, in addition to out-of-phase tilts, the higher-temperature out-of-phase contains in-out-of-phase tilts. The key question is ‘what are the directions of the constituent tilts relative to the cubic parent phase’?
The analysis of Howard & Stokes (1998) suggests four possible structural models comprising both types of tilts, designated aþaþc, a0bþ
c, aþb
b and aþb
c. The first
three of these were each tested against the PND data at 300C
[the latter has unnecessarily low (monoclinic) symmetry and is
discarded]. The first two models are described in space groups
P42/nmc andCmcm, respectively, with unit cells of
approx-imate metrics 222ap, whereaprepresents the aristotype
cubic perovskite unit-cell parameter. Both these models give good quality fits, whereas the aþbb option (space group
Pnma, which corresponds to the most common perovskite tilt system, with unit-cell metrics approximatelypffiffiffi22pffiffiffi2ap),
does not adequately describe the observed peak splittings. Further details of the two most promising models,P42/nmc
andCmcm, are given in Table 1, together with several models representing non-centrosymmetric subgroups ofP42/nmc(see
later). Both centrosymmetric structural models have the same number of variable atomic para-meters (coordinates plus isotropic displacement parameters) which makes direct numerical comparison of fit quality straightforward. In addition to the significantly improved fit (2
), theaþaþc(P42/ nmc) model can be seen graphically to be significantly better (Fig. 2). Moreover the atomic displacement parameters for the O atoms show much more uniform behaviour [Uiso (A˚
2
) values for the three distinct O atoms in theP42/nmcand Cmcm models, respectively are 0.0152 (7), 0.0136 (7), 0.0179 (4) and 0.0137 (6), 0.0028 (6), 0.0348 (10)] – a clear indication that the octahedral tilt behaviour is modelled correctly in the aþaþc
model and incorrectly fora0bþc. The above analysis confirms the tilt system of the phase present at 300C to beaþaþc. However, this
[image:3.610.312.566.103.225.2]assumes the phase to be centro-symmetric. Second harmonic generation offers a sensitive
Table 1
Comparison of the respective Rietveld refinements for the two chosen centrosymmetric models proposed for the phase at 300C, together with
the feasible non-centrosymmetric subgroups ofP42/nmc.
Nref defines the total number of variable parameters refined,Nxyz is the
number of variable atomic coordinates and NU
iso the number of isotropic
atomic displacement parameters (ADPs) refined. Occupancies of theA-sites are fixed at 80% Na/20% Li in each case, with Li/Na at each particular site having the same ADP. For the non-centrosymmetric models, O atom ADPs were constrained in pairs according to the parent phase, as appropriate Space group 2
Nref Nxyz NUiso
P42mc 3.513 55 17 7
P4m2 4.263 55 17 7
P42212 4.428 50 12 7
P421c 4.582 51 13 7
P42/nmc 4.553 44 7 7
[image:3.610.44.291.172.248.2]Cmcm 6.692 44 7 7
Figure 1
Portions of Rietveld refinement carried out on PND data at (a) 100C and (b) 300C. In (a) the peaks in
the region 2.2–2.3 A˚ arise from the subcell; the peak near 2.35 A˚ in both (a) and (b) is due to theR4+tilt mode. The additional peaks (‘doublets’ neard= 2.09 and 2.48 A˚ ) in (b) are due to theM3+tilt mode. The small peak neard= 2.14 A˚ is from the vanadium sample holder and the ‘shoulder’ neard= 2.27 A˚ is due to the minority Li-R3cphase.
Table 2
Crystallographic data for LNN-20 at 300C modelled in theP4
2mcspace group [a= 7.7706 (2),c= 7.8498 (3) A˚ ].
Atom
Wycoff
position x y z
100Uiso
(A˚2)
Na1† 2c 0 0.5 0.726 (3) 4.1 (3) Na2 2c 0 0.5 0.258 (6) 4.1 (3) Na3 2b 0.5 0.5 0.253 (3) 0.2 (4) Na4 2a 0 0 0.236 (2) 0.7 (3) Nb1 8f 0.2489 (5) 0.7493 (5) 0 0.48 (2) O1 4e 0.2281 (8) 0.5 0.4843 (7) 1.39 (9) O2 4e 0.2781 (8) 0.5 0.0552 (7) 0.75 (7) O3 4d 0.2864 (8) 0 0.5538 (8) 0.75 (7) O4 4d 0.2115 (8) 0 0.0026 (6) 1.39 (9) O5 8f 0.2858 (10) 0.7874 (11) 0.2655 (4) 1.52 (4)
† Positions Na1–Na4 have fixed occupancy Na0.8Li0.2; the derivedUisovalues (especially
[image:3.610.46.404.414.693.2]powder technique with the ability to establish the centro-symmetric or non-centrocentro-symmetric nature of a crystalline phase, independently of diffraction data. We therefore carried out second-harmonic generation (SHG) measurements as a function of temperature, as shown in Fig. 3.
This experiment clearly shows a significant SHG signal to at least 450C, thus supporting the presence of a
non-centro-symmetric phase. Hence, the simplest non-centronon-centro-symmetric subgroups ofP42/nmcwere considered, and these models are
presented in Table 1. All four potential models were treated
similarly with the same set of ‘standard’ refined parameters, as described in x2.1. Atomic coordi-nates and displacement parameters were then refined for each of the models with displacement para-meters constrained for those crys-tallographic sites that were ‘split’ in two upon distortion to the lower symmetry phase. It can be seen that theP42mcmodel provides the best
description of the phase present in the region 300 < T < 500C,
consistent with both the observed tilt system and the presence of SHG signal. We note that this is the
only polar subgroup; the other
three subgroups tested are non-centrosymmetric butnotpolar. The final, refined model for space group
P42mc at 300C is presented in
Table 2, and the corresponding Rietveld fit in Fig. 4. One further point here is worthy of comment: theUisovalues of theA-site cations
may suggest a possible partial ordering of Li/Na over these sites (Li has a negative scattering length); we tested this, but no clear-cut ordering pattern or significant lowering of agreement parameters was observed.
3.1.2. 500 <T< 850C. In addition to the SHG signal (Fig. 3), which supports the presence of a non-centrosymmetric LNN-20 phase to at least 450C, dielectric data support an
additional structural event in the region of 450–500C (Fig. 5).
[image:4.610.46.403.71.306.2]Further corroborating evidence of a phase transition in this region could be seen from the PND data, with a sharp merging
Figure 3
SHG data generated from a sample of LNN-20 showing clear SHG response to at least 450C on heating.
Figure 2
Portion of Rietveld refinement (PND) of LNN-20 at 300C modelled in (a)Cmcm; (b)P4
2/nmcand (c)
[image:4.610.312.564.510.722.2]P42mcspace groups.
Figure 4
Portion of Rietveld refinement (PND) of LNN-20 at 300C using the
[image:4.610.45.295.512.720.2]of several peaks when the temperature was elevated from 450C to 500C. For completeness the data at 500C were
modelled in the P42mc space group and whilst the 2
was lower for P42mc over P42/nmc (2.75 and 3.17, respectively)
this was most likely an artefact due to the increased degrees of freedom in the lower symmetry space group; indeed it was found that the model was not stable upon full, unrestrained refinement. Key superlattice peaks corresponding to bothM -point and R-point tilts are still observed above 500C,
however. In light of this, the models for each of the standard
aþaþc, a0bþ
c and aþb
b tilt systems, previously discounted for the phase at 300C, were trialled as fits to this
new (presumed centrosymmetric) phase at 500C. Of these
three tilt systems the fit to theP42/nmcmodel was clearly the
most satisfactory at this temperature (2
value forP42/nmc=
3.175,Pnma= 4.045,Cmcm= 4.442). Evolution of the lattice parameters versus temperature, based on the P42mc (250–
450C), P4
2/nmc (500–700C) and subsequent higher
temperature phases is shown in Fig. 6. We note, in particular, the marked tetragonal distortion in the P42mc phase field,
related to the polar cation displacements along c. This distortion disappears on entering the pseudo-cubic P42/nmc
phase, but an enhanced tetragonality reappears at 750C, with
the gradual emergence of a new phase. Finer temperature increments would be necessary to establish a more precise point for the P42mc to P42/nmc phase transition, but this
clearly occurs in the range 450C to 500C, consistent with the
SHG, dielectric data and PND.
As the centrosymmetricP42/nmcspace group remained the
best fit to the diffraction data in the region 500T600C, a
single phase refinement using this model was carried out over these temperatures. Upon reaching 650C further structural
changes were indicated in the diffraction data, with a devel-oping asymmetry of several peaks. This new phase was seen to ‘grow in’ as the temperature was increased to 800C where
complete loss of the superlattice peaks attributed to theR4+
out-of-phase tilt mode occurs, suggesting complete conversion to the emergent phase. For a centrosymmetric perovskite with only M3
+
(in-phase) tilts, the analysis of Howard & Stokes (1998) suggests three possible tilt systems; aþaþaþ (space
group Im3), a0bþ
bþ (I4/mmm) and a0a0cþ (P4/mbm). Of
these, the aþaþc to a0bþ
bþ transition is expected to be second order; clearly this is not the case here. The other two options are required to be first order, compatible with the phase co-existence observed here. The cubic aþaþaþ option
can easily be discounted, thus leaving the tilt systema0a0cþ
[image:5.610.315.565.69.275.2](P4/mbm) as the only viable option.
Figure 5
[image:5.610.314.565.509.720.2]Relative permittivity data for LNN-20 at selected frequencies, obtained on cooling.
Figure 6
Normalized lattice parameters versus T, obtained from Rietveld refinement of PND data. For the tetragonal phases, the a lattice parameter is represented by red circles andcby blue triangles. In regions where phase co-existence occurs, only the majority phase present at each temperature is shown.
Figure 7
Portion of Rietveld refinement (PND) of LNN-20 at 800C using the
[image:5.610.45.292.517.719.2]The tetragonal modelP4/mbmwith a0a0cþtilt system was
indeed confirmed to provide the best fit. A two phase refine-ment ofP42/nmcandP4/mbmmodels was carried out for 650
T 750C, with a single phase refinement in theP4/mbm
space group for the 800C diffraction data (Fig. 7). Elevation
of the temperature to 850C resulted in
the loss of all remaining superlattice peaks, signalling the disappearance of the in-phase tilt along the c-axis. All subsequent data were therefore fitted to the aristotype cubic space groupPm3m.
3.2. Discussion
The phase transition sequence reported here (R3c–P42mc–P42/nmc– P4/mbm – Pm3m) is unique in perov-skite crystallography. Moreover, the unusual structural variants displaying the aþaþc tilt system (space groups P42/nmc and P42mc) present throughout the intermediate
temperature range studied here have only been previously reported twice and once each, respectively. The general trends in octahedral tilt preferencesversustemperature (i.e.from ‘in-phase’ tilts only at high temperature to ‘out-of-‘in-phase’ tilts only at low temperature) mirror those in NaNbO3itself (Megaw,
1974; Peelet al., 2012), although the specific details are quite different in the two cases, with NaNbO3 showing more
complex, longer-range tilt sequences. Such longer-range superlattices can be definitively ruled out for LNN-20 from the present data.
The crystal structure of the ambient temperature, R3c, phase has been discussed previously (Peel et al., 2013). The crystal structure of theP42mcphase at 300C is shown in Fig.
8. Corresponding bond lengths and selected bond angles are given in Table 3. Fig. 9(a) shows the distortion of the NbO6
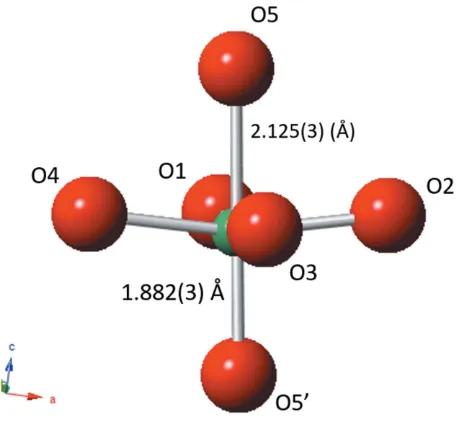
[image:6.610.46.383.104.205.2]octahedron. The off-centre displacement of the Nb atom, along the polarc-axis, is evident, and resembles that in much simpler tetragonal ferroelectric perovskites (without octahe-dral tilting) such as the ambient-temperature phase of BaTiO3.
Table 3
Bond lengths and selected bond angles of theP42mcphase at 300C, Na—O bond lengths over 2.7 A˚ are not reported.
Na—O Bond length (A˚ ) Nb—O Bond length (A˚ ) Nb—O—Nb Bond angle (
) Na1—O12 2.597 (17) Nb—O1 1.963 (4) Nb—O1—Nb 167.8 (4) Na1—O54 2.365 (3) Nb—O2 1.999 (4) Nb—O2—Nb 150.8 (4) Na2—O12 2.51 (3) Nb—O3 1.999 (4) Nb—O3—Nb 151.1 (4) Na2—O22 2.69 (3) Nb—O4 1.969 (4) Nb—O4—Nb 163.3 (4) Na2—O32 2.31 (3) Nb—O5 2.125 (3) Nb—O5—Nb 156.77 (10) Na3—O22 2.322 (17) Nb—O5’ 1.882 (3)
[image:6.610.52.289.329.425.2]Na4—O32 2.644 (12) Na4—O42 2.460 (15) Na4—O42 2.664 (15)
Figure 9
Schematic of NbO6octahedron in theP42mcphase at 300C highlighting the polar Nb displacement (difference between Nb—O5 and Nb—O50
bond lengths0.243 A˚ ). The symmetry operators acting upon the Nb— O5 and Nb—O50bonds arex;y;zand 1y;1x;1
[image:6.610.57.286.486.699.2]2þz, respectively.
Figure 10
Thermal evolution of Nb—O bond lengths over the region 300 <T< 500C, showing a decrease in the off-centring of the Nb atom within the
NbO6octahedron as theP42mc–P42/nmcphase transition is approached. Figure 8
[image:6.610.314.565.499.706.2]In contrast to this difference of 0.243 A˚ in axial Nb—O bond lengths, the corresponding ab-plane bond lengths are roughly equal. The thermal evolution of these Nb—O bonds is shown in Fig. 10, and this clearly shows the centralization of the Nb atoms within its octahedral site as theP42mc–P42/nmc
transition is approached. The variation in the two octahedral tilt mode,M3+andR4+,versustemperature across theP42mc– P42/nmc phase region is shown in Fig. 11. The M3+ mode
amplitude shows a uniform reduction with increasing temperature, whereas the R4
+
mode exhibits a step change at the 500C transition, presumably in order to accommodate the
transition to the centrosymmetric state.
As suggested earlier, theaþaþcGlazer tilt system has only
been observed very rarely: twice in its aristoype form, space groupP42/nmc(Leinenweber & Parise, 1995; Shimura et al.,
2017), once in the polar form, P42mc, also observed here
(Aimiet al., 2014), and additionally in aB-site ordered variant, space groupP42/n(Solana-Madrugaet al., 2016). Each of these
earlier reports relate to compounds prepared at high pressure,
viz.CaFeTi2O6(Leinenweber & Parise, 1995), MnLnMnSbO6
(Solana-Madrugaet al., 2016), CaMnTi2O6(Aimiet al., 2014)
and LnMn(Ga0.5Ti0.5)2O6(Shimuraet al., 2017). Each of these
high-pressure-prepared phases incorporate unusually small cations (Fe2+or Mn2+) at theA-site, and consequently exhibit
completeA-site cation ordering across geometrically distinct sites. In particular the Fe2+or Mn2+cations in CaFeTi2O6and
CaMnTi2O6occupy two distinct sites of approximately
tetra-hedral and square-planar geometry, each having four signifi-cantly shortened A—O contacts. Although it is tempting to suggest that such a structure might be chosen in the present case in order to permit a degree of Li/Na ordering, there is insufficient evidence from the present data to support this possibility. Aimiet al.(2014) reported ferroelectric hysteresis at room temperature in CaMnTi2O6, and a phase transition to
the paraelectricP42/nmcphase at 630 K. Unusually they show
that this transition has a partial order–disorder nature, with the square-planar Mn site (only) displaying disorder in the
P42/nmcphase. Again, no evidence for such an occurrence can
be definitively gleaned from the present study. The off-centre displacement of theB-site cation (Ti4+) in CaMnTi2O6has a
similar magnitude to that reported for Nb5+ here (Fig. 9). However, the geometries of the A-site cations are quite different between LNN-20 and CaMnTi2O6. Rather than
having well defined four-coordinate geometries theA-sites in LNN-20 have a less regular geometry, as shown in Figs. S5 and S6.
The third tetragonal polymorph observed in the present study (theP4/mbmphase) is observed in the high-temperature phase diagram of NaNbO3, and also occurs in the
variable-temperature phase diagram of several other perovskites, for example, NaMgF3(Knightet al., 2015) and CsSnI3(Yamadaet al., 1991). On transforming to the cubic phase at 850C, the
remaining in-phase tilts are lost, although some evidence for residual localized octahedral tilting can be inferred from the anisotropic nature of the O atom displacement parameters [U11= 0.0094 (5),U33= 0.0677 (4) A˚2].
4. Conclusions
The thermal evolution of the phase behaviour and crystal structure of the perovskite ferroelectric Li0.2Na0.8NbO3
(LNN-20) has been characterized using powder neutron diffraction, supported by second-harmonic generation and dielectric measurements. Persistence of a non-centrosymmetric perovs-kite phase was confirmed up to at least 500C. The phase progression is determined as R3c – P42mc – P42/nmc – P4/mbm–Pm33mon increasing temperature from ambient to 900C. This phase transition sequence demonstrates the
identification of two rare phases with regard to the perovskite structure: both the polarP42mcand centrosymmetricP42/nmc
phases have the Glazer tilt systemaþaþc, and each structure
type has been reported only once or twice previously in a perovskite. The ultimate reasons for Li0.2Na0.8NbO3to adopt
such an unusual sequence of phases remains to be determined.
Acknowledgements
We thank STFC for the provision of neutron diffraction facilities at ISIS and Dr A. Daoud-Aladine for experimental assistance. We would also like to thank Dr F. D Morrison for access to dielectric measurements.
Funding information
Funding for this research was provided by: EPSRC (award No. EP/L505079/1).
References
Aimi, A., Mori, D., Hiraki, K., Takahashi, T., Shan, Y. J., Shirako, Y., Zhou, J. S. & Inaguma, Y. (2014).Chem. Mater.26, 2601–2608. Campbell, B. J., Stokes, H. T., Tanner, D. E. & Hatch, D. M. (2006).J.
[image:7.610.44.297.507.708.2]Appl. Cryst.39, 607–614. Figure 11
Thermal evolution of the two tilt modes throughout theP42mc–P42/nmc phase field. Note the discontinuous evolution of theR4
Chakhmouradian, A. R. & Woodward, P. M. (2014). Phys. Chem. Miner.41, 387–391.
Glazer, A. M. (1972).Acta Cryst.B28, 3384–3392.
Howard, C. J. & Stokes, H. T. (1998).Acta Cryst.B54, 782–789. Jeon, N. J., Noh, J. H., Kim, Y. C., Yang, W. S., Ryu, S. & Seok, S. I.
(2014).Nat. Mater.13, 897–903.
Jo, W., Granzow, T., Aulbach, E., Ro¨del, J. & Damjanovic, D. (2009).
J. Appl. Phys.105, 094102.
Knight, K. S., Price, G. D., Stuart, J. A. & Wood, I. G. (2015).Phys. Chem. Miner.42, 45–52.
Kurtz, S. K. & Perry, T. T. (1968). J. Appl. Phys. 39, 3798– 3813.
Larson, A. C. & Von Dreele, R. B. (2004).GSAS. Report LAUR 86-748. Los Alamos National Laboratory, New Mexico, USA. Leinenweber, K. & Parise, J. (1995).J. Solid State Chem.114, 277–
281.
Megaw, H. D. (1974).Ferroelectrics,7, 87–89.
Mishra, S. K., Krishna, P. S. R., Shinde, A. B., Jayakrishnan, V. B., Mittal, R., Sastry, P. U. & Chaplot, S. L. (2015).J. Appl. Phys.118, 094101.
Peel, M. D., Ashbrook, S. E. & Lightfoot, P. (2013).Inorg. Chem.52, 8872–8880.
Peel, M. D., Thompson, S. P., Daoud-Aladine, A., Ashbrook, S. E. & Lightfoot, P. (2012).Inorg. Chem.51, 6876–6889.
Saito, Y., Takao, H., Tani, T., Nonoyama, T., Takatori, K., Homma, T., Nagaya, T. & Nakamura, M. (2004).Nature,432, 84–87.
Shimura, G., Niwa, K., Shirako, Y. & Hasegawa, M. (2017).Eur. J. Inorg. Chem.2017, 835–839.
Solana-Madruga, E., Are´valo-Lo´pez, A. M., Dos Santos-Garcı´a, A. J., Urones-Garrote, E., A´ vila-Brande, D., Sa´ez-Puche, R. & Attfield, J. P. (2016).Angew. Chem. Int. Ed.55, 9340–9344.
Toby, B. H. (2001).J. Appl. Cryst.34, 210–213.
![Table 2Crystallographic data for LNN-20 at 300�C modelled in the P42mc spacegroup [a = 7.7706 (2), c = 7.8498 (3) A˚ ].](https://thumb-us.123doks.com/thumbv2/123dok_us/9000882.396875/3.610.312.566.103.225/table-crystallographic-data-lnn-c-modelled-p-spacegroup.webp)