This is an Accepted Manuscript, which has been through the
Royal Society of Chemistry peer review process and has been
accepted for publication.
Accepted Manuscripts are published online shortly after
acceptance, before technical editing, formatting and proof reading.
Using this free service, authors can make their results available
to the community, in citable form, before we publish the edited
article. We will replace this Accepted Manuscript with the edited
and formatted Advance Article as soon as it is available.
You can find more information about Accepted Manuscripts in the
author guidelines
.
Please note that technical editing may introduce minor changes
to the text and/or graphics, which may alter content. The journal’s
standard
Terms & Conditions
and the ethical guidelines, outlined
in our
author and reviewer resource centre
, still apply. In no
event shall the Royal Society of Chemistry be held responsible
for any errors or omissions in this Accepted Manuscript or any
consequences arising from the use of any information it contains.
Accepted Manuscript
PCCP
Physical Chemistry Chemical Physics www.rsc.org/pccp
ISSN 1463-9076
PERSPECTIVE
Darya Radziuk and Helmuth Möhwald Ultrasonically treated liquid interfaces for progress in cleaning and separation processes
Volume 18 Number 1 7 January 2016 Pages 1–636
PCCP
Physical Chemistry Chemical Physics
Journal Name
ARTICLE
a.
EaStCHEM School of Chemistry, University of St Andrews, North Haugh, St Andrews KY16 9ST, United Kingdom
b.
Angewandte Physikalische Chemie, Universität Heidelberg, Im Neuenheimer Feld 253, 69120 Heidelberg, Germany
c.
Department of Chemical and Process Engineering, University of Strathclyde, James Weir Building, 75 Montrose Street, Glasgow G1 1XJ, United Kingdom
‡
Present address: Max Planck Institute for Polymer Research, Ackermannweg 10, 55128 Mainz, Germany,
Received 00th January 20xx, Accepted 00th January 20xx
DOI: 10.1039/x0xx00000x
www.rsc.org/
Self-assembly of 1,3,5-benzenetribenzoic acid on Ag and Cu at the
liquid/solid interface
Hannah Aitchison,
aHao Lu,
b‡Rodrigo Ortiz de la Morena,
aIzabela Cebula,
cMichael Zharnikov
band
Manfred Buck
a*
Assembly of 1,3,5-benzenetribenzoic acid (H3BTB) from solution on Au substrates modified by underpotential deposited
Ag and Cu layers was studied by near edge X-ray absorption fine structure spectroscopy, X-ray photoelectron spectroscopy
and scanning tunneling microscopy. Adsorption of H3BTB on Cu resulted in disordered layers with sporadic occurrence of
ordered molecular aggregates. In contrast, highly ordered layers were obtained on Ag which exhibit a pronounced row
structure and involve a monopodal bidentate adsorption geometry of the molecules through carboxylate coordinating
bonding. The row structure arises from π-stacking of the molecules and is accompanied by hydrogen bonding interactions
between the COOH groups of adjacent rows. As a consequence of the geometry of the H3BTB molecule and the
dominance of intermolecular over molecule-substrate interactions, the SAM forms an open structure featuring a grooved
surface and nanotunnels.
Introduction
The assembly of aromatic carboxylic acids (ArCAs) on surfaces has been widely investigated in efforts to develop bottom-up strategies for accessing the nanometer scale. Exploiting their structural variety and the ability of the carboxyl group to adopt different hydrogen and coordination bonding geometries, they can be organized into layers ranging from porous supramolecular networks, where molecules lie flat on the surface, to self-assembled monolayers (SAMs) consisting of densely packed, upright standing molecules. The large majority of studies have been performed on conducting substrates, mostly coinage metals and graphite,1-23 and, to a lesser extent, on semiconducting supports.11,24-30 Recently, the range of substrates has been extended to dielectrics.31-35 and various two-dimensional (2D) materials.36-38
Like for other molecular assemblies at surfaces, the balance between molecule-substrate and intermolecular interactions is a central aspect in the design of carboxylic acid based structures.2,9,36,39-48 At the liquid/solid interface enthalpic and entropic contributions from the solvent also exert decisive influence on structures20,40,49-52 and the electrochemical
potential represents an additional control parameter at electrified interfaces.53-58
For molecules like ArCAs the balance involves a number of mutually dependent factors comprising interactions of the π -systems, both intermolecular and with the substrate, hydrogen bonding of the COOH groups, and conformational degrees of freedom. In case of substrates able to coordinatively interact with the carboxyl moiety, the complexity of the system increases further since the respective energy landscape is strongly dependent on the details of the bonding configuration, i.e., type of anchoring such as monodentate vs bidentate, tilt angle of the carboxylate moiety, and/or substrate periodicity.
The consequences of shifts in the balance of interactions are highlighted by the assembly of trimesic acid (H3BTC, see Scheme 1 for structure). On graphite or gold, the benzene rings interact with the substrate and the COOH groups form intermolecular hydrogen bonds, thus, yielding a porous hydrogen bonded network.59-61 In contrast, on Ag (in form of a so-called UPD layer, vide infra) the molecules stand upright and pack densely in a row structure due to the monopodal coordination bonding involving one carboxylate group62 as major driving force to maximise coverage. The situation is again different for Cu (also in form of a UPD layer, vide infra) for which the coordination bonding of the carboxylate moiety is stronger compared to Ag. As a result the molecule flips over by binding with two carboxylate moieties,62,63 thus forming a bipodal adsorption geometry with a row structure precisely
defined by the periodicity of the underlying substrate.
Physical
Chemistry
Chemical
Physics
Accepted
Manuscript
Published on 03 January 2018. Downloaded by University of St Andrews Library on 05/01/2018 15:48:59.
Extension of our studies to the homologous H3BPTC molecule (see Scheme 1), which exhibits a lower symmetry compared to H3BTC, revealed further details in the balance of interactions in ArCA based SAMs.64 While a bipodal structure analogous to H3BTC is formed on Cu (even though the formation kinetics are strikingly different), the situation for Ag differs from H3BTC as the H3BPTC molecules do not adopt the symmetric monopodal configuration by coordination bonding via the benzoic acid fragment, but prefer the less symmetric monopodal anchoring through one of the carboxyl moieties of the isophthalic acid fragment. These results indicate that, on Cu, the SAM structure is dominated by molecule-substrate interaction whereas intermolecular interactions play the decisive role on Ag. This picture is corroborated by the recent study of para-oligophenylene mono- and dicarboxylic acids65 which all form highly organised layers of upright standing molecules on Ag with systematic differences in packing between the mono and dicarboxylic acids.
The study of H3BTB (see Scheme 1) presented in this paper represents a further step towards the understanding of the design principles of ArCA based SAMs. The solution based approach taken here has, so far, been largely limited to aliphatic molecules (for reviews see refs. 66,67). Only a few systems have been examined spectroscopically68-72 whereas molecularly resolved studies using scanning tunneling microscopy (STM) have been performed only rather recently.62-65,73 In these studies Au/mica substrates were used onto which a Ag bilayer or a pseudomorphic (√3×√3)R30° Cu layer were electrochemically deposited in the region positive of the Nernst potential (underpotential deposition, UPD)74 Notably, a very recent STM study demonstrated that also Ag films are suitable substrates for the assembly of ArCA SAMs.75 H3BTB was chosen since, as seen from Scheme 1, it is closely related to the two other tricarboxylic acid molecules which, in previous studies, were found to yield highly organised layers on Cu and Ag surfaces by assembly from solution.62-64,73 While it parallels structural features of H3BTC and H3BPTC, its substantially larger size and, thus, more complex geometry raises the question to what extent it exhibits a behaviour along the lines of the smaller analogues. In addition, such a size potentially provides a means to create surface nanostructures with characteristic dimensions exceeding those of H3BTC and H3BPTC.
Scheme 1: Chemical structures of 1,3,5-benzenetribenzoic acid (H3BTB) investigated in this paper and related tricarboxylic acids (1,3,5-benzenetricarboxylic acid = H3BTC and biphenyl-3,4',5-tricarboxylic acid = H3BPTC).
Experimental
Sample preparation: Au substrates (300 nm epitaxial Au(111) layer on mica wafer, Georg Albert PVD, Silz, Germany) were annealed using a natural gas flame before underpotential deposition. UPD layers were prepared with solutions of 10 mM AgNO3 (99.9999%, Sigma-Aldrich) in 100 mM HNO3 and 10 mM
CuSO4 pentahydrate (99.999%, Sigma-Aldrich) in 50 mM H2SO4
(Sigma Aldrich, 99.999%). Prior to metal deposition a CV was recorded to verify the quality of the Au/mica substrate. For Cu a (√3×√3)R30° layer was deposited by applying a potenƟal of 150 mV (vs Cu/Cu2+) for 1 minute. An Ag bilayer was deposited by applying 10 mV (vs Ag/Ag+) for 2 min.
Layers on UPD-Cu were prepared from saturated aqueous solutions of H3BTB at 65°C for 10 minutes. It is noted that longer immersion times (up to 1 h) and a range of immersion temperatures were also tried but had no detectable influence on the layer quality. On Ag, SAMs were prepared by immersion of the UPD-Ag substrates into a 1 mM solution of H3BTB in a 1:1 solution of H2O (Millipore)/EtOH (AnalaR Normapur) at
65°C for 10 minutes. After the immersion both types of samples were rinsed with room temperature EtOH and dried under a flow of N2.
Characterization: The samples were characterized at RT by STM and synchrotron-based XPS and NEXAFS spectroscopy.
STM imaging was carried out using a Molecular Imaging PicoSPM system in ambient atmosphere. Tips were mechanically cut from Pt/Ir 80:20 wire (Advent Research Materials Ltd., 0.25 mm diameter). Tunneling current and tip bias were in the range of 2-70 pA and ±0.20−0.60 V.
XPS and NEXAFS measurements were performed at the MAX II storage ring at the MAX IV laboratory in Lund, Sweden, using the bending magnet beamline D1011 (plane grating monochromator). XP spectra were collected in normal emission geometry using a Scienta SES200 spectrometer. The energy resolution was better than 100 meV. The binding energy (BE) scale was referenced to the Au 4f7/2 peak at a BE of
84.0 eV.76 Spectra were fitted by symmetric Voigt functions and a linear background using Casa-XPS software. The NEXAFS spectroscopy measurements were made using a partial electron yield detector. The spectra were collected at both carbon and oxygen K-edges with retarding voltages of −150 V and –350 V, respectively. Linear polarized X-ray light with a polarization factor of ∼95% was used. The energy resolution was better than 100 meV. The incident angle of the X-ray light was varied from 90° vector in the surface plane) to 20° (E-vector nearly normal to the surface plane) in steps of 10−20° to monitor orientational order in the SAMs. This approach is based on the linear dichroism in X-ray absorption, i.e., the strong dependence of the cross-section of the resonant photoexcitation process on the orientation of the electric field vector of the linearly polarized light with respect to the molecular orbital of interest.77
The raw NEXAFS spectra were normalized to the incident photon flux by division by a spectrum of clean, freshly sputtered gold sample. Afterward, the spectra were reduced
Physical
Chemistry
Chemical
Physics
Accepted
Manuscript
Journal Name
ARTICLE
to standard form by subtracting a linear pre-edge background and normalizing to the unity jump edge in the far postedge range. The energy scale was calibrated by means of the most intense π* resonance of highly oriented pyrolytic graphite at 285.38 eV46 in combination with the well-known ∆hν∝ (hν)3/2 behavior of plane grating monochromators.78
Results
STM on UPD-Cu: Scanning a sample on a larger scale as shown in Fig. 1asuggests a rather uniform coverage. However, no obvious pattern indicating the formation of an ordered layer of H3BTB is discernible. This is substantiated by the higher resolution image (Fig. 1b) which shows randomly arranged protrusions of which a substantial fraction exhibits a triangular shape.
Fig. 1 STM images of H3BTB on UPD-Cu at low (a) and molecular (b) resolution. The insert in (b) shows an enlarged image of the area framed by the yellow square together with a model of the hexagonal arrangement of H3BTB molecules.
At times the resolution was sufficiently high to reveal the underlying shape of the H3BTB molecule which evidences that the triangular features are flat lying H3BTB molecules. Other features have a less well defined shape which could be indicative of H3BTB molecules adsorbed in a non-flat adsorption geometry as further discussed below in the context of the spectroscopic data. Occasionally, small ordered arrangements are observed such as the motif highlighted in Fig. 1b which consists of a group of six molecules. While the resolution does not permit an unambiguous assignment, a possible structure is proposed by the model shown at the top right of Fig. 1b.
Two things are worth noting. Firstly, a resolution as shown in Fig. 1b was not straightforward to achieve due to rather frequent changes of the tip which affected the resolution. Since H3BTB adsorbed in a flat-lying configuration, like on Au, forms well-ordered layers, which are imaged under stable conditions at the tunnelling parameters employed in this study, we take the challenging imaging conditions as additional indication that a fraction of the H3BTB molecules is adsorbed in a tilted geometry. Since such a geometry also results in a significantly weaker molecule-substrate interaction as both the interaction of the aromatic rings with the substrate and the number of carboxylic acid groups binding to it are reduced, perturbation by the STM is more likely, up to the point that molecules are occasionally removed, thus, impeding resolution and imaging stability. Secondly, since previous experiments
revealed a striking influence of the preparation conditions on the outcome of the assembly process,64 different preparation conditions were tried. However, in contrast to H3BPTC where an elevated temperature of 120°C, a rather high concentration of 4 mM, and an extended immersion time yielded a highly ordered layer,64 these measures proved unsuccessful in the present case of H3BTB. Possible reasons for this will be outline further down in the discussion section.
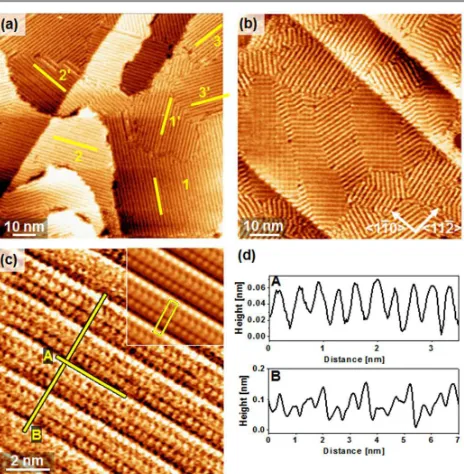
Fig. 2 STM images of H3BTB on UPD-Ag at different magnifications showing row structures. Yellow lines in (a) mark six different domains with rotational domains numbered and corresponding mirror domains labelled by primed numbers. (c) Molecular resolution image with insert at top right showing a unit cell averaged image. The unit cell is indicated by the yellow rectangle. (d) Height profiles along the lines shown in (c).
STM on UPD-Ag: As seen in Fig. 2 which compiles the results for H3BTB on Ag, the situation is pronouncedly different from the Cu substrate. The larger scale images in Fig. 2a and 2b reveal a highly organised layer consisting of domains characterised by a row type structure. The rows run at an angle of about 12° with respect to the <112> direction, which results, as indicated in Fig. 2a, in two sets of three mirror symmetric domains, according to the C3v symmetry of the
substrate. The molecularly resolved image shown in Fig. 2c documents the crystallinity of the SAM which becomes even more clear in the unit cell averaged image (inset top right). The image is characterised by very straight rows of protrusions which are separated by about 3.6 Å as seen from profile A. Profile B reveals a sequence of three rows of protrusions differing in height by up to 1 Å which repeats after about 16 Å. Describing the H3BTB molecule by an equilateral triangle with the corners given by the COOH groups, the interrow periodicity matches the side of the triangle. This and the intrarow distance of the protrusion below 4 Å suggest that the
rows of the molecules consist of stacks of upright standing
Physical
Chemistry
Chemical
Physics
Accepted
Manuscript
Published on 03 January 2018. Downloaded by University of St Andrews Library on 05/01/2018 15:48:59.
[image:4.612.313.545.159.396.2] [image:4.612.69.297.248.354.2]H3BTB molecules. The detailed model will be discussed later after the presentation of the spectroscopic results.
Fig. 3 C 1s XP spectra of H3BTB on UPD-Cu and UPD-Ag substrates acquired at a photon energy of 350 eV (left panel) and 580 eV (right panel). Insets show COOH/COO- region in detail with arrows marking the positions of the COOH (~288.5 eV) and COO -(~287 eV) signal. Blue squares represent experimental data, yellow solid line is curve resulting from fits with the components shown in different colours. For details see text.
XPS: The C 1s and O 1s spectra of the H3BTB films on both the Ag-UPD and Cu-UPD substrates are compiled in Fig. 3 and Fig. 4, respectively.
Similar to H3BTC and H3BPTC62,64 the C 1s spectra are dominated by the phenyl carbon atoms (284.2-284.3 eV). The other obvious feature common to all spectra is the COOH signal around 288.5 eV. The carboxylate signal, which appears around 287.0 eV (green curve), clearly depends on the photon energy. The intensities in the 580 eV spectra are significantly higher than in the 380 eV spectra. Since the effective escape depth of the photoelectrons is larger for the higher photon energy this, in line with previous studies on H3BTC and H3BPTC,64,65 indicates that the carboxylate moiety is buried at the SAM-metal interface and, thus, represents the anchoring group.
In order to reproduce the experimental spectra, three minor components in addition to those of the phenyl (orange), COOH (red) and COO- (green) carbon atoms are required. These are the ones in the range of 285-285.4 eV (black) and around 286 eV (gray) which are known from H3BTC and H3BPTC,64,65 and another component centered around 290 eV (violet). These peaks are assigned to shake up features in the aromatic matrix arising from vibrational excitation79 and π-π* transitions.76 Given the specific structure of the SAM as discussed below we can also not exclude minor contributions from contaminations.
Looking at the O 1s region (Fig. 4), the spectra of H3BTB on both Ag and Cu can be well described by three components reflecting the hydroxyl (533 eV), carbonyl (531.5 eV), and carboxylate (530.3 eV) signals21,62,65 with the latter contributing to a minor extent. However, there is a significant difference between the two substrates with respect to the overall shape of the spectrum and, consequently, the relative heights of the hydroxyl and carbonyl peaks.
The O 1s spectrum of H3BTB on UPD-Ag is well fitted with a single value for the peak width (fwhm = 1.43 eV) of all components and the stoichiometric ratio of 1 for the C=O and C-OH species as expected for free COOH groups. The absence of a group specific inhomogeneous broadening suggests a very well defined, homogeneous layer, in agreement with the STM data. The intensity ratio of the sum of the C=O and C-OH peaks to the COO– peak is about 14 and explained by the superposition of a 2:1 stoichiometric ratio of the COOH and COO- groups and a significant difference in the attenuation (factor of 7) of the respective photoelectrons, in line with the structural interpretation that, like for H3BTC62 and H3BPTC,65 two out of the three carboxylic acid groups of the H3BTB molecule are at the outer interface of the SAM and the third one accounts for the monopodal anchoring and is located at the SAM-substrate interface. However, since for the H3BTB SAM the value for the escape depth of the photoelectrons is not known, also a 1:2 stoichiometry of the COOH and COO -groups is, in principle, conceivable if the attenuation were sufficiently strong. To exclude this possibility which would indicate a bipodal adsorption geometry, comparison with the SAMs of H3BPTC64 and biphenyldicarboxylic acid (BPDC)65 on UPD-Ag can be made. The attenuation of photoelectrons in these SAMs should not be too different from the H3BTB monolayer, considering that the bigger size of the H3BTB molecule and the lower packing density due its geometry affect the attenuation in opposite directions. From the intensity ratios and the stoichiometry of the COOH and COO- groups attenuation factors of about 5 (H3BPTC) and 7 (BPDC) are calculated. This is well in the same range as for the H3BTB layer with a monopodal configuration. In comparison, a bipodal arrangement would require an unrealistically large attenuation factor of 28.
One of the three carboxyl groups of the H3BTB molecules is present as carboxylate and buried at the SAM-substrate interface whereas the remaining two groups are located at the SAM-ambient interface, in full agreement with the interpretation of the C 1s spectra. Therefore, like H3BTC and H3BPTC, H3BTB adopts a monopodal bidentate adsorption geometry on UPD-Ag.
The situation is somewhat different (and also less clear) on Cu. The obvious difference to Ag is the significantly smaller height of the C-OH signal at 533 eV compared to C=O signal at 513.5 eV. Accordingly, a fit of the spectrum with the same fwhm value as for the SAM on UPD-Ag yields a C-OH/C=O ratio of 0.56. i.e., a significant deviation from the 1:1 stoichiometry of a free carboxylic acid group. In combination with the STM images which shows a disordered layer we conclude that for the UPD-Cu substrate additional bonding configurations such
Physical
Chemistry
Chemical
Physics
Accepted
Manuscript
[image:5.612.66.299.89.345.2]Journal Name
ARTICLE
as a monodentate are involved, and/or other oxygen species are present due to the disordered arrangement of the molecules.
Fig. 4 O 1s XP spectra of H3BTB on UPD-Cu and UPD-Ag substrates acquired with a photon energy of 580 eV. Blue squares represent the experimental data, yellow solid line is curve resulting from fits with -C=O (533 eV, orange curve), -C-OH (531.5 eV, green curve), and COO- (530.5 eV, red curve).
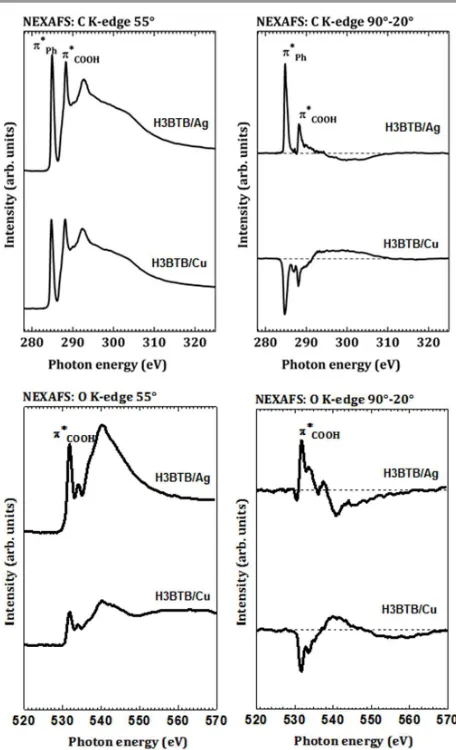
NEXAFS spectroscopy: The spectra of H3BTB on UPD-Cu and UPD-Ag recorded at the C K-edge and O K-edge are compiled in Fig. 5. On the left, the spectra acquired at an incident angle of the primary X-ray beam of 55° are shown. At this angle of incident radiation, the spectra contain purely electronic structure information about the monolayer, with no contribution from the effects of molecular orientation.77 The panels on the right show the difference spectra obtained from subtracting the spectra obtained at grazing incidence (20°) of the X-ray radiation from those obtained at normal incidence (90°). These panels reveal information on the average orientation of the molecular orbitals and, consequently, the molecules.
The most obvious resonances in the NEXAFS spectra have been assigned on the basis of literature data.77,80 For the C K-edge, all spectra contain a dominant resonance from transitions into the π* orbital of the phenyl rings at 285.0 eV (π*Ph) and into the π* orbital of the COOH/COO– groups at ∼288.5 eV (π*COOH). The O K-edge spectra are dominated by the π*COOH
resonance at 531.8 eV, accompanied by an additional feature at ∼544 eV related to the transition into a σ* orbital.62,80 It is noted that the resonances associated with COOH moieties comprise contributions from both COOH and COO– and, thus, the experiment yields an average value. However, due to the attenuation of the electrons, which is weaker than in the XPS case but still considerable,81 the individual moieties might contribute to a varying extent, depending on the orientation and packing of the H3BTB molecules.
The difference spectra exhibit a prominent linear dichroism with opposite signs for the two substrates. The positive value for UPD-Ag indicates that the H3BTB molecules have a more upright orientation on this substrate whereas the negative sign reveals a significantly larger tilt of the molecules on UPD-Cu. This is substantiated by the quantitative evaluation of the orientation of the transition dipole moments (TDMs) of the π*
resonances which yields values of 62°/58° (C K-edge/O K-edge) for Ag and (47°/47°) for Cu. The results corroborate the conclusions drawn from the STM images that the rows of protrusions (Fig. 2c) observed on Ag represent stacks of upright standing molecules whereas the triangular shape seen on Cu represent more flat lying molecules in a disordered arrangement. It is noted that in this case the 47° tilt does not imply a well-defined value for the orientation but could be an average over an orientational distribution.
Fig. 5 C (top) and O (bottom) K-edge NEXAFS spectra for H3BTB on Ag and UPD-Cu. Left panels: spectra acquired at an X-ray incidence angle of 55°. Right panels: difference spectra resulting from subtracting the spectra acquired at an X-ray incidence angle of 20° from that acquired at 90°. The most prominent resonances have been assigned. The dashed lines in the difference spectra are the zero lines.
Discussion
Summarising the experimental observations, STM revealed that a highly ordered H3BTB layer is formed on Ag (Fig. 2) whereas on Cu (Fig. 1) the molecules arrange in a rather random fashion. XPS (Figs. 3 and 4) provides clear signatures of both COOH and COO– moieties with COOH prevailing on both substrates. For the SAM on Ag the data are in full agreement
Physical
Chemistry
Chemical
Physics
Accepted
Manuscript
Published on 03 January 2018. Downloaded by University of St Andrews Library on 05/01/2018 15:48:59.
[image:6.612.66.302.101.251.2] [image:6.612.314.542.170.545.2]with a monopodal bidentate binding configuration whereas, lacking an ordered arrangement of the molecules, no clear interpretation is possible for Cu. The pronounced dependence of the assembly process on the substrate is also reflected in the NEXAFS data (Fig. 5) which reveal substantial differences in the molecular orientation by the opposite dichroism.
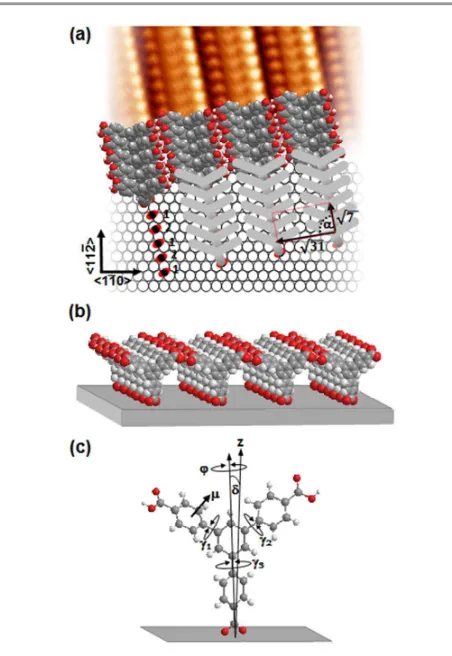
Combining all experimental data on H3BTB on UPD-Ag, the commensurate structure shown in Fig. 6 is proposed. The layer is described by a (√7×√31) unit cell which, within the experimental accuracy, agrees very well with the size and shape determined by STM. It is almost rectangular and contains two molecules, i.e., the area per molecule is 61.5 Å2. The short axis of the unit cell is orientated 10.9° off the
>
<112 direction. In this arrangement the intrarow distance between the molecules is 3.82 Å which is essentially equal to the 3.83 Å for the stacked H3BTB molecules in the crystal82 and in the same range as the intrarow distances for H3BTC62 and H3BPTC.64 Defined by the size of the molecule, the significantly larger interrow distance of 16 Å compared to the other two molecules (9-10 Å) gives rise to the unusal open SAM structure illustrated in Fig. 6b with tunnels about 1 nm wide.
The most obvious structural features of the H3BTB SAM are the π-stacking of the molecules and the alignment of the COOH moieties along the rows, thereby groups of adjacent rows facing each other to form a one-dimensional band of carboxylic acid groups. Notably, distances between the oxygen atoms of adjacent rows are well within the 2.4-3 Å range of hydrogen bonding83 which suggests that they contribute favourably to the highly crystalline structure of the H3BTB SAM. However, the main contribution to the formation of the distinct row structure seems to come from intermolecular π-π
interactions which is concluded from two observations. Firstly, SAMs of bis(pyrazol-1-yl)pyridine thiol84 and bis(pyrazol-1-yl)pyridylbenzoic acid,85 which have extended π-systems of Y-shaped geometry similar to H3BTB but do not have free COOH groups, also form row structures. Secondly, the crystallinity of the layers increases in order of H3BTC < H3BPTC < H3BTB. While all three tricarboxylic acids exhibit a monopodal bonding to the substrate and the remaining two COOH groups account for interrow interactions, the waviness of the rows and occurrence of bends vary within the series and are absent in the H3BTB SAM. We mention in this context that row structures resulting from π-π interactions have also been observed in monolayers of hexabenzocoronene thiol on Au,86
and of H3BTB20 and the structurally analogous tris(carboxyphenylethynyl)benzene52 on graphite. Contrasting the monopodal coordination bonding found for UPD-Ag, a bipodal adsorption geometry was suggested for the latter two systems which were investigated at the solid/liquid interface by in situ STM. Interestingly, due to the relatively weak graphite-molecule interaction, formation of the row structures was found to depend decisively on the type of solvent. While the formation of a row structure, consisting of stacks of molecules in an upright and monopodal configuration is evident from the data, it is not possible to assess the exact inclination and conformation of the H3BTB molecules at this stage. The reason is that, as discussed previously,65 the
orientation derived from a NEXAFS resonance is an average value of all transition dipole moments (TDMs) contributing to a resonance. Since, as seen from Fig. 6c, the orientation of the TDM of an individual moiety depends on a specific combination of tilt, twist and dihedral angles, an orientational interpretation requires either a well-defined correlation between TDMs87 or to make reasonable assumptions about twist and dihedral angles.88 The presentation of the molecules in Fig. 6 accounts for the possibility of a twisted conformation, in analogy to bulk structures where the rings of all three benzoic acid moieties exhibit a significant twist against the central ring in the range of 25-45°.82,89 However, since the twist between adjacent phenyl rings can easily be reduced to an essentially co-planar conformation as known from studies of oligophenylenes,90,91 this has to be substantiated by further combined experimental and computational studies.
Fig. 6 Structural model of a self-assembled monolayer of H3BTB on UPD-Ag. (a) Top view which includes a unit cell averaged STM image of the SAM as displayed in inset of Fig. 2c. The √7×√31 unit cell of the layer with α = 88° is indicated by the red dotted line. Numbered red/black ellipses symbolise carboxylate moieties with the different adsorption sites labelled as 1 and 2. Open circles represent Ag atoms. Note that the exact positions of the adsorption sites of the molecules are not known and, therefore, the Ag layer only serves as reference to illustrate dimensions. (b) SAM structure in front view. (c) Structure of H3BTB indicating angles defining molecular orientation through and conformation the tilt (δ) twist (ϕ) and dihedral (γi) angles. µ exemplifies the
transition dipole moment of a π*Ph resonance of an individual benzene ring.
Physical
Chemistry
Chemical
Physics
Accepted
Manuscript
[image:7.612.313.539.259.587.2]Journal Name
ARTICLE
Related to the issue of conformation and orientation of H3BTB is another salient feature of the STM image which is the appearance of the rows of protrusions at three different heights. There are two possible explanations for this, one being a geometrical argument, i.e., the molecules are somewhat tilted sideways, so that adjacent COOH groups of neighbouring rows are at different heights, similar to the case of H3BPTC.64 The other argument is based on differences in tunneling probabilities due to differences in the local conformations. A twist between neighbouring benzene rings would affect the tunneling and, in the case of an asymmetric conformation, give rise to different apparent heights. It is unclear at present which of these scenarios, including a superposition of both, applies here.
The discussion so far has not yet addressed the SAM-substrate interface which, as known from other strongly adsorbing molecules such as thiols,92,93 can play a decisive role. While the occurrence of three rotational domains and their corresponding mirror domains reflects the symmetry of the (111)-surface and, thus, reveals its influence, this seems minor compared to the intermolecular interactions which give rise to the row structure. This is concluded from a number of observations on the different ArCA SAMs investigated so far.
62-65,73,75
Firstly, the preference of a monopodal over a bipodal configuration for H3BTC62 on UPD-Ag suggests that intermolecular interactions prevail over molecule-substrate interactions. Secondly, there is a noticeable difference in the crystallinity of the SAMs between H3BTC and H3BTB. The former exhibits a degree of waviness in the row structure which is consistent with some competition between intermolecular and substrate-molecule interactions, whereas the latter shows exactly defined straight rows due to increased intermolecular interactions. Thirdly, all but one of the molecules studied so far (only for benzoic acid no molecular resolution STM images were obtained65) form well defined layers, irrespective of the number of carboxylic acid groups, the number or arrangements of the aromatic rings, or the presence of an ethylene linker. Since the molecular lattices differ substantially in these layers one would not expect the formation of highly ordered layers in all cases if, contrasting Cu
(vide infra), the SAM-Ag interface played a crucial role. In addition, calculations on SAMs of oligophenylene carboxylic acids on UPD-Ag yield small energy differences between different adsorption sites.65 A corresponding small corrugation of the molecule-substrate interaction potential would provide the required flexibility to accommodate rather different molecular lattices. In this context we note that the unit cell of the H3BTB SAM contains two molecules which, as seen at the bottom left part of the top view of the SAM model in Fig. 6a, implies two different adsorption sites. Nevertheless there is no indication at all from the STM images that this gives rise to a difference in the arrangement of the molecules. Unit cell averaged images as the one depicted in Fig. 2c look exactly the same as unit cell averaged images where the size of the unit cell has been doubled along the molecular rows.
The ability of H3BTB to form a highly crystalline layer on UPD-Ag is contrasted by the situation met for the UPD-Cu surface
on which an ordered SAM could not be formed and a substantial fraction of the molecules are adsorbed in a flat lying geometry as concluded from the STM images (Fig. 1b). At this point we can only speculate on this striking difference to not only the Ag surface but also the structurally related molecules H3BTC62,63,73 and H3BPTC64 (see Scheme 1) which form highly crystalline SAMs also on UPD-Cu. An obvious explanation of the unexpected behaviour of H3BTB is its size as, due to the significant adsorption energy of a benzene ring (in a vacuum environment about 70 kJ/mol for the coinage metals94,95), the activation barrier to make the transition from a flat to an upright adsorption geometry is expected to scale with the number of aromatic rings. In the series H3BTC H3BPTC, and H3BTB this is consistent with the experimental observations that for the first two molecules ordered SAMs are obtained but the preparation temperature for the larger H3BPTC is pronouncedly higher than for H3BTC.64 Accordingly, H3BTB would require another significant shift in temperature, beyond what was explored in our experiments. Interestingly, Fig. 1b very much resembles Fig. 4b of ref. 64 which shows a disordered arrangement of flat lying H3BPTC molecules, obtained when the preparation temperature was too low. Besides this kinetic reasoning also a thermodynamic argument can be made. The larger π−system, on the one hand, increases the interaction of the molecule with the substrate but, on the other hand, the larger separation of the COOH groups also reduces the density of the substrate-carboxylate bonds, thus, shifting the enthalpy balance to the extent that a flat-lying geometry might be favoured over upright standing molecules. In either case a kinetically limited adsorption process seems to take place with a mixture of flat lying and tilted molecules as inferred from the combination of STM and spectroscopic data. However, to pin down the exact cause of the difficulties in producing highly ordered H3BTB on UPD-Cu, more extended experiments are required to unravel whether, in principle, a limit in the size of molecules exists to form ArCA SAMs on Cu or whether the correct combination of preparation parameters has not yet been identified.
Conclusions
The study of H3BTB assembled onto coordinating metal layers underpotential deposited (UPD) on Au further consolidate our earlier findings62,64,65 that ArCAs assemble easily on the UPD-Ag bilayer due to the dominating role of intermolecular interactions. The substantial variation in size and shape of the molecules studied so far strongly suggests that Ag represents an attractive substrate for a very versatile design of ArCA based SAMs. Further support comes from a very recent study of biphenylethane carboxylic acid on evaporated metal films which also reported the formation of a well-ordered layer.75 Contrasting Ag, UPD-Cu is a more restrictive substrate as inferred from the studies of the series H3BTC, H3BPTC and H3BTB. However, the situation for this substrate is inconclusive since it remains unclear why H3BTB does not form a well-ordered SAM on UPD-Cu. On the one hand, it follows from the comparison of H3BTC62,63 and H3BPTC64 that the
Physical
Chemistry
Chemical
Physics
Accepted
Manuscript
Published on 03 January 2018. Downloaded by University of St Andrews Library on 05/01/2018 15:48:59.
preparation conditions play a crucial role. On the other hand, the data base of the three tricarboxylic acids studied so far is insufficient to decide whether it is matter of matching the required set of preparation parameters or whether there are more fundamental reasons owing to the dominating role of molecule-surface interactions that inhibit the formation of a well-defined H3BTB SAM.
[image:9.612.225.532.66.683.2]H3BTB on Ag marks an interesting point in the design of SAMs. The geometry of the molecule and its arrangement on the surface, characterised by a monopodal anchoring to the substrate and the formation of a row structure with interrow interactions through free COOH groups, indicate a route to more sophisticated SAM architectures. Contrasting uniform layers of densely packed molecules, more open structures can be realised as seen from the model displayed at the bottom of Fig. 6. On the one hand, the distinct anisotropic corrugation of the outer SAM interface might be exploited for epitaxial templating analogous to graphoepitaxy.96 On the other hand, the layer features nanochannels which opens interesting prospects for SAM modification by intercalation. Another structural feature is the 1D band of the COOH moieties for which it will be interesting to elucidate the extent of hydrogen bonding and, accordingly, its influence on the enthalpy of the SAM structure and potential for proton conduction.
Acknowledgements
Support by the Leverhulme Trust (RGP-2013-177) and EPSRC via a doctoral training grant (H.A.) is gratefully acknowledged. We also thank the Max IV facility for the allocation of the beamtime as well as Max IV staff, and A. Preobrajenski, in particular, for the technical support during the experiments. M.Z. appreciates financial support of the German Research Foundation (DFG).
Notes and references
1. A. G. Slater, P. H. Beton and N. R. Champness, Chem. Sci., 2011, 2, 1440-1448.
2. J. V. Barth, Annu. Rev. Phys. Chem., 2007, 58, 375-407. 3. K. G. Nath, O. Ivasenko, J. M. MacLeod, J. A. Miwa, J. D.
Wuest, A. Nanci, D. F. Perepichka and F. Rosei, J. Phys. Chem. C, 2007, 111, 16996-17007.
4. X. Zhang, Q. Zeng and C. Wang, RSC Advances, 2013, 3, 11351-11366.
5. M. O. Blunt, J. C. Russell, C. Gimenez-LopezMaria del, N. Taleb, X. Lin, M. Schröder, N. R. Champness and P. H. Beton, Nat Chem, 2011, 3, 74-78.
6. M. O. Blunt, J. C. Russell, M. D. Gimenez-Lopez, J. P. Garrahan, X. Lin, M. Schroder, N. R. Champness and P. H. Beton, Science, 2008, 322, 1077-1081.
7. M. E. Canas-Ventura, F. Klappenberger, S. Clair, S. Pons, K. Kern, H. Brune, T. Strunskus, C. Wöll, R. Fasel and J. V. Barth, J. Chem. Phys., 2006, 125, 1-8.
8. M. Lackinger, in Self-Healing at the Nanoscale, eds. V. Amendola and M. Meneghetti, Taylor and Francis, 2012, p. 467.
9. G. M. Florio, K. A. Stiso and J. S. Campanelli, J. Phys. Chem. C, 2012, 116, 18160-18174.
10. A. Dmitriev, H. Spillmann, S. Stepanow, T. Strunskus, C. Wöll, A. P. Seitsonen, M. Lingenfelder, N. Lin, J. V. Barth and K. Kern, ChemPhysChem, 2006, 7, 2197-2204. 11. T. Suzuki, T. Lutz, D. Payer, N. Lin, S. L. Tait, G. Costantini
and K. Kern, Phys. Chem. Chem. Phys., 2009, 11, 6498-6504.
12. S. L. Tait, H. Lim, A. Theertham and P. Seidelz, Phys. Chem. Chem. Phys., 2012, 14, 8217-8223.
13. B. G. Frederick, Q. Chen, F. M. Leibsle, M. B. Lee, K. J. Kitching and N. V. Richardson, Surf. Sci., 1997, 394, 1-25. 14. B. G. Frederick, M. R. Ashton, N. V. Richardson and T. S.
Jones, Surf. Sci., 1993, 292, 33-46.
15. F. Grillo, H. Früchtl, S. M. Francis, V. Mugnaini, M. Oliveros, J. Veciana and N. V. Richardson, Nanoscale, 2012, 4, 6718-6721.
16. K. Iritani, K. Tahara, S. De Feyter and Y. Tobe, Langmuir, 2017, 33, 4601-4618.
17. M. Lackinger, S. Griessl, T. Markert, F. Jamitzky and W. M. Heckl, J. Phys. Chem. B, 2004, 108, 13652.
18. B. Xu, B. Varughese, D. Evans and J. Reutt-Robey, J. Phys. Chem. B, 2005, 110, 1271-1276.
19. N. A. Wasio, R. C. Quardokus, R. P. Forrest, C. S. Lent, S. A. Corcelli, J. A. Christie, K. W. Henderson and S. A. Kandel,
Nature, 2014, 507, 86-89.
20. R. Gutzler, T. Sirtl, J. F. Dienstmaier, K. Mahata, W. M. Heckl, M. Schmittel and M. Lackinger, J. Am. Chem. Soc., 2010, 132, 5084-5090.
21. N. Lin, D. Payer, A. Dmitriev, T. Strunskus, C. Wöll, J. V. Barth and K. Kern, Angew. Chem. Int. Ed., 2005, 44, 1488-1491.
22. S. Q. Zhang, J. Y. Zhang, K. Deng, J. L. Xie, W. B. Duan and Q. D. Zeng, Phys. Chem. Chem. Phys., 2015, 17, 24462-24467.
23. R. Han, F. Blobner, J. Bauer, D. A. Duncan, J. V. Barth, P. Feulner and F. Allegretti, Chem. Commun., 2016, 52, 9805-9808.
24. P. Rahe, M. Nimmrich, A. Nefedov, M. Naboka, C. Wöll and A. Kühnle, J. Phys. Chem. C, 2009, 113, 17471-17478. 25. A. Greuling, P. Rahe, M. Kaczmarski, A. Kühnle and M.
Rohlfing, J. Phys. Condens. Matter, 2010, 22.
26. P. Olszowski, L. Zajac, S. Godlewski, B. Such, R. Joehr, T. Glatzel, E. Meyer and M. Szymonski, J. Phys. Chem. C, 2015, 119, 21561-21566.
27. A. Tekiel, J. S. Prauzner-Bechcicki, S. Godlewski, J. Budzioch and M. Szymonski, J. Phys. Chem. C, 2008, 112, 12606-12609.
28. E. S. Skibinski, A. Q. Song, W. J. I. DeBenedetti, A. G. Ortoll-Bloch and M. A. Hines, J. Phys. Chem. C, 2016, 120, 11581-11589.
29. T. Bitzer and N. V. Richardson, Surf. Sci., 1999, 427-28, 369-373.
30. A. Lopez, T. Bitzer, T. Heller and N. V. Richardson, Surf. Sci., 2001, 480, 65-72.
31. H. Ogawa, J. Phys. Org. Chem., 1991, 4, 346-352.
32. M. Einax, T. Richter, M. Nimmrich, P. Rahe, I. G. Stara, I.
Stary, A. Kühnle and P. Maass, J. Chem. Phys., 2016, 145.
Physical
Chemistry
Chemical
Physics
Accepted
Manuscript
Journal Name
ARTICLE
33. K. Markus, R. Philipp and K. Angelika, J. Phys.: Condens. Matter, 2012, 24, 354007.
34. P. Rahe, M. Nimmrich and A. Kühnle, Small, 2012, 8, 2969-2977.
35. J. L. Neff, A. Richter, H. Songen, C. Venturini, A. Gourdon, R. Bechstein and A. Kühnle, Faraday Discuss., 2017, DOI: 10.1039/C1037FD00089H.
36. J. Li, S. Gottardi, L. Solianyk, J. C. Moreno-Lopez and M. Stohr, J. Phys. Chem. C, 2016, 120, 18093-18098.
37. K. Banerjee, A. Kumar, F. F. Canova, S. Kezilebieke, A. S. Foster and P. Liljeroth, J. Phys. Chem. C, 2016, 120, 8772-8780.
38. V. V. Korolkov, M. Baldoni, K. Watanabe, T. Taniguchi, E. Besley and P. H. Beton, Nat Chem, 2017, advance online publication.
39. G. Pawin, K. L. Wong, K. Y. Kwon and L. Bartels, Science, 2006, 313, 961-962.
40. Y. L. Yang and C. Wang, Current Opinion in Colloid & Interface Science, 2009, 14, 135-147.
41. J. V. Barth, J. Weckesser, N. Lin, A. Dmitriev and K. Kern,
Appl. Phys. A-Mater. Sci. Process., 2003, 76, 645-652. 42. A. Kühnle, Current Opinion in Colloid & Interface Science,
2009, 14, 157-168.
43. F. Silly, J. Phys. Chem. C, 2012, 116, 10029-10032. 44. L. Kanninen, N. Jokinen, H. Ali-Loytty, P. Jussila, K.
Lahtonen, M. Hirsimaki, M. Valden, M. Kuzmin, R. Parna and E. Nommiste, Surf. Sci., 2011, 605, 1968-1978. 45. M. Ruben, D. Payer, A. Landa, A. Comisso, C. Gattinoni, N.
Lin, J. P. Collin, J. P. Sauvage, A. De Vita and K. Kern, J. Am. Chem. Soc., 2006, 128, 15644-15651.
46. W. J. Lee, M. H. Weng, S. P. Ju and H. C. Chen, Mol. Phys., 2008, 106, 2371-2380.
47. J. M. MacLeod, Z. Ben Chaouch, D. F. Perepichka and F. Rosei, Langmuir, 2013, 29, 7318-7324.
48. O. Ivasenko and D. F. Perepichka, Chem. Soc. Rev., 2011,
40, 191-206.
49. M. O. Blunt, J. Adisoejoso, K. Tahara, K. Katayama, M. Van der Auweraer, Y. Tobe and S. De Feyter, J. Am. Chem. Soc., 2013, 135, 12068-12075.
50. K. G. Nath, O. Ivasenko, J. A. Miwa, H. Dang, J. D. Wuest, A. Nanci, D. F. Perepichka and F. Rosei, J. Am. Chem. Soc., 2006, 128, 4212-4213.
51. L. Kampschulte, M. Lackinger, A. K. Maier, R. S. K. Kishore, S. Griessl, M. Schmittel and W. M. Heckl, J. Phys. Chem. B, 2006, 110, 10829-10836.
52. R. Gutzler, S. Lappe, K. Mahata, M. Schmittel, W. M. Heckl and M. Lackinger, Chem. Commun., 2009, 680-682. 53. Y. Ikezawa and R. Masuda, Electrochim. Acta, 2008, 53,
5456-5463.
54. Y.-G. Kim, S.-L. Yau and K. Itaya, Langmuir, 1999, 15, 7810-7815.
55. Y. Ishikawa, A. Ohira, M. Sakata, C. Hirayama and M. Kunitake, Chem. Commun., 2002, 2652-2653.
56. P. Zelenay, P. Waszczuk, K. Dobrowolska and J. Sobkowski,
Electrochim. Acta, 1994, 39, 655-660.
57. G. J. Su, H. M. Zhang, L. J. Wan, C. L. Bai and T. Wandlowski, J. Phys. Chem. B, 2004, 108, 1931-1937. 58. Y. Kim, K. Cho, K. Lee, J. Choo, M. S. Gong and S. W. Joo, J.
Mol. Struct., 2008, 878, 155-161.
59. N. T. N. Ha, T. G. Gopakumar and M. Hietschold, Surf. Sci., 2013, 607, 68-73.
60. S. J. H. Griessl, M. Lackinger, F. Jamitzky, T. Markert, M. Hietschold and W. M. Heckl, J. Phys. Chem. B, 2004, 108, 11556-11560.
61. Y. Ye, W. Sun, Y. Wang, X. Shao, X. Xu, F. Cheng, J. Li and K. Wu, J. Phys. Chem. C, 2007, 111, 10138-10141. 62. I. Cebula, H. Lu, M. Zharnikov and M. Buck, Chem. Sci.,
2013, 4, 4455 - 4464.
63. I. Cebula, C. Shen and M. Buck, Angew. Chem. Int. Ed., 2010, 49, 6220-6223.
64. H. Aitchison, H. Lu, M. Zharnikov and M. Buck, J. Phys. Chem. C, 2015, 119, 14114-14125.
65. H. Aitchison, H. Lu, S. W. L. Hogan, H. Früchtl, I. Cebula, M. Zharnikov and M. Buck, Langmuir, 2016, 32, 9397-9409. 66. S. A. Jadhav, Centr. Eur. J. Chem., 2011, 9, 369-378. 67. A. Ulman, Chem. Rev., 1996, 96, 1533-1554.
68. I. Platzman, C. Saguy, R. Brener, R. Tannenbaum and H. Haick, Langmuir, 2010, 26, 191-201.
69. Y.-T. Tao, W.-L. Lin, G. D. Hietpas and D. L. Allara, J. Phys. Chem. B, 1997, 101, 9732-9740.
70. M. H. Hsu, W. S. Hu, J. J. Lin, Y. J. Hsu, D. H. Wei, C. W. Yang, C. S. Chang and Y. T. Tao, Langmuir, 2004, 20, 3641-3647.
71. Y. T. Tao, M. T. Lee and S. C. Chang, J. Am. Chem. Soc., 1993, 115, 9547-9555.
72. S. Jung Ahn, D. Hee Son and K. Kim, J. Mol. Struct., 1994,
324, 223-231.
73. C. Shen, I. Cebula, C. Brown, J. Zhao, M. Zharnikov and M. Buck, Chem. Sci., 2012, 3, 1858-1865.
74. E. Herrero, L. J. Buller and H. D. Abruña, Chem. Rev., 2001,
101, 1897-1930.
75. A. Krzykawska, J. Ossowski, T. Zaba and P. Cyganik, Chem. Commun., 2017, 53, 5748-5751.
76. J. F. Moulder, W. E. Stickle, P. E. Sobol and K. D. Bomben,
Handbook of X-ray Photoelectron Spectroscopy,, Perkin-Elmer Corp.: Eden Prairie, MN, 1992.
77. J. Stöhr, NEXAFS Spectroscopy, Springer, 1992.
78. M. Domke, T. Mandel, A. Puschmann, C. Xue, D. A. Shirley, G. Kaindl, H. Petersen and P. Kuske, Rev. Sci. Instrum., 1992, 63, 80-89.
79. M. Zharnikov, J. Electron. Spectrosc. Relat. Phenom., 2010,
178, 380-393.
80. T. Okajima, K. Teramoto, R. Mitsumoto, H. Oji, Y. Yamamoto, I. Mori, H. Ishii, Y. Ouchi and K. Seki, J. Phys. Chem. A, 1998, 102, 7093-7099.
81. M. Zharnikov, S. Frey, K. Heister and M. Grunze, J. Electron. Spectrosc. Relat. Phenom., 2002, 124, 15-24. 82. C. A. Zentner, H. W. H. Lai, J. T. Greenfield, R. A. Wiscons,
M. Zeller, C. F. Campana, O. Talu, S. A. FitzGerald and J. L. C. Rowsell, The Cambridge Structural Database, CCDC No. 1400566 2015, DOI: 10.5517/cc1j0dkh.
83. T. Steiner, Angew. Chem. Int. Ed., 2002, 41, 48-76. 84. C. Shen, M. Haryono, A. Grohmann, M. Buck, T. Weidner,
N. Ballav and M. Zharnikov, Langmuir, 2008, 24, 12883-12891.
85. H. Aitchison, R. Ortiz de la Morena, H. Lu, M. Zharnikov and M. Buck, in preparation
86. D. Käfer, A. Bashir, X. Dou, G. Witte, K. Müllen and C. Wöll, Adv. Mater., 2010, 22, 384-388.
87. N. Ballav, B. Schüpbach, O. Dethloff, P. Feulner, A. Terfort and M. Zharnikov, J. Am. Chem. Soc., 2007, 129,
15416-15417.
Physical
Chemistry
Chemical
Physics
Accepted
Manuscript
Published on 03 January 2018. Downloaded by University of St Andrews Library on 05/01/2018 15:48:59.
88. Z. She, D. Lahaye, N. R. Champness, M. Bühl, H. Hamoudi, M. Zharnikov and M. Buck, J. Phys. Chem. C, 2013, 117, 4647-4656.
89. S. B. Baek, D. Moon, R. Graf, W. J. Cho, S. W. Park, T.-U. Yoon, S. J. Cho, I.-C. Hwang, Y.-S. Bae, H. W. Spiess, H. C. Lee and K. S. Kim, Proc. Natl. Acad. Sci., 2015, 112, 14156-14161.
90. O. Potzel and G. Taubmann, Phys. Chem. Chem. Phys., 2013, 15, 20288-20293.
91. E. Verwuster, E. Wruss, E. Zojer and O. T. Hofmann, J. Chem. Phys., 2017, 147.
92. H.-T. Rong, S. Frey, Y. J. Yang, M. Zharnikov, M. Buck, M. Wühn, C. Wöll and G. Helmchen, Langmuir, 2001, 17, 1582-1593.
93. P. Cyganik, M. Buck, W. Azzam and C. Wöll, J. Phys. Chem. B, 2004, 108, 4989-4996.
94. W. Liu, F. Maass, M. Willenbockel, C. Bronner, M. Schulze, S. Soubatch, F. S. Tautz, P. Tegeder and A. Tkatchenko,
Phys. Rev. Lett., 2015, 115, 036104.
95. J. A. Garrido Torres, B. Ramberger, H. A. Früchtl, R. Schaub and G. Kresse, Phys. Rev. Mat., 2017, 1, 060803.
96. E. I. Givargizov, J. Cryst. Growth, 2008, 310, 1686-1690.