Sub-problem learning and reversal of a multidimensional visual cue
1
in a lizard: Evidence for behavioural flexibility?
2
3
Birgit Szaboa*, Daniel W. A. Nobleb, Richard W. Byrnec, David S. Taitd, Martin J. Whitinga
4
5
aDepartment of Biological Sciences, Macquarie University, Sydney, Australia
6
b University of New South Wales, School of Biological, Earth and Environmental Sciences,
7
Ecology & Evolution Research Centre, Sydney, Australia
8
c University of St Andrews, School of Psychology and Neuroscience, Centre for Social
9
Learning & Cognitive Evolution, UK
10
d University of St Andrews, School of Psychology and Neuroscience, UK
11
12
13
14
15
16
17
18
*Corresponding author: Birgit Szabo, MSc, Department of Biological Sciences,
19
Macquarie University, 209 Culloden Road, Building W19A, Marsfield, NSW 2122,
20
Australia; mobile: +61 411 78 60 61; email: [email protected]
21
22
Word count: 8,751
23
Declarations of interest: none.
24
ABSTRACT
26
Behavioural flexibility, the ability to adjust behaviour to environmental change by adapting
27
existing skills to novel situations, is key to coping with, for example, complex social
28
interactions, seasonal changes in food availability or detecting predators. We tested the tree
29
skink (Egernia striolata), a family-living skink from eastern Australia, in a set-shifting
30
paradigm of eight colour/shape discriminations including reversals, an intra-dimensional
31
acquisition of a new colour/shape and extra-dimensional shift from colour to shape (and vice
32
versa). Skinks could learn to discriminate between colour/shape pairs and reverse this initial
33
stimulus-reward association; however, they showed no significant decrease in the probability
34
of making a correct choice in the extra-dimensional shift suggesting that they did not form an
35
attentional set. Subjects appear to have learnt each stage as a new problem instead of
36
generalizing stimuli into specific dimensions (set-formation). In conclusion, tree skinks
37
solved a discrimination reversal by focusing their attention towards visual stimuli and flexibly
38
adjusting their choice behaviour accordingly. These lizards learned to use multidimensional
39
visual stimuli to find a food reward, but did not generalise stimuli into dimensions.
40
Furthermore, this study is the first to test for set-shifting in a lizard species and thereby
41
allows us to extend set-shifting theory to a new taxon for comparison with primates, rodents,
42
a bird and a turtle.
43
44
Keywords: cognition, discrimination learning, ID/ED task, reptile, set-shifting
45
INTRODUCTION
47
Social living has many benefits, but can also be a demanding environment in which
48
interactions between individuals shape their social structure (Hinde, 1987). The resulting
49
selective pressure is thought to have led to the evolution of extensive abilities in attention,
50
memory and learning (Byrne, 1998; Byrne, 1994; Byrne & Whiten 1988), forming the
51
foundation of the ‘social intelligence hypothesis’ (Humphrey, 1976). Complex cognition has
52
been frequently investigated through behavioural flexibility—the ability to adjust behaviour to
53
changes in the environment (Brown & Tait, 2015) by directing attention to essential stimuli
54
(Dias, Robbins, & Roberts, 1996;Welsh & Pennington, 1988) and adjusting existing skills to
55
a new problem (Manrique & Call, 2015). Behavioural flexibility can be a valuable tool in the
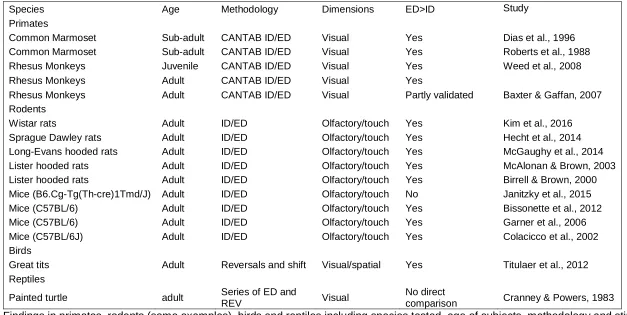
56
social domain. To react flexibly to a change in the social environment (addition or removal of
57
group members) and to selectively pay attention to interactions between individuals can be
58
useful for tracking relationships within a social group (social monitoring; McNelis &
Boatright-59
Horowitz, 1998). The insights gained can then be used to adjust behaviour directed towards
60
conspecifics according to the current state of their inter-individual relationships (Byrne, 1998;
61
McNelis & Boatright-Horowitz, 1998).
62
A common test for behavioural flexibility involves a test of attentional set-shifting
63
which investigates the ability to apply an acquired attentional bias (by forming an attentional
64
set) to novel situations (ID - intra-dimensional; Brown & Tait, 2015; Mukhopadhyay et al.,
65
2008) and then to shift attention away from this established bias when relevance changes to
66
a previously irrelevant stimulus aspect or dimension (ED - extra-dimensional; Brown & Tait,
67
2015). It is possible to examine set-formation in a series of discriminations by quantifying
68
acquisition speed and errors during each stage (Brown & Tait, 2015; Garner, Thogerson,
69
Wurbel, Murray, & Mench, 2006). Perseverative errors to the former relevant dimension and
70
a performance drop during a shift indicate a subject’s level of behavioural flexibility (Brown &
71
Tait, 2015; Garner et al., 2006).
72
human and non-human primates’ attentional set-shifting ability (Dias, et al., 1996; Roberts,
74
Robbins, & Everitt 1988). The task consists of multiple sequential visual discriminations
75
(using shapes and lines as stimulus dimensions), designed to encourage an attentional set
76
(through repeated exposure to consistently relevant and irrelevant information; Sutherland &
77
Mackintosh, 1971) and then test the ability to shift away from that set. First, subjects learn a
78
simple discrimination (SD) between stimuli of only one dimension. After reaching a
79
predetermined learning criterion the stimulus-reward association is reversed and the other
80
stimulus in the pair is reinforced. Next, stimuli of the irrelevant dimension are superimposed
81
onto the SD stimuli, producing compound cues (CD), with the SD stimuli still associated with
82
reward. After reaching criterion the reward associations are again reversed. Next, during the
83
intra-dimensional acquisition (ID), new examples of shapes and lines are introduced. With
84
dimensional relevance staying the same, subjects must maintain their attentional set and
85
apply it to unfamiliar stimuli. After reaching criterion, the reward contingencies are again
86
reversed. Finally, during the extra-dimensional shift (ED), again, unfamiliar shapes and lines
87
are introduced. Contrary to the intra-dimensional acquisition, the reinforcement is now
88
associated with the formerly irrelevant dimension. If set-formation occurred during earlier
89
stages, performance in the extra-dimensional shift is expected to be worse compared to the
90
intra-dimensional acquisition, since the previously established attentional set does not apply
91
any more (Garner et al., 2006; Roberts et al., 1988). The extra-dimensional shift is again
92
followed by a reversal.
93
The assumption that the number of trials to reach criterion during extra-dimensional
94
shifting is higher than during the intra-dimensional acquisition (as a measure of attentional
95
set-shifting) does not rely on absolute values. It is therefore possible to compare shift
96
performance in different species (Table 1). For example, marmosets (Callithrix jacchus) can
97
form an attentional set and shift to a previously irrelevant second dimension (Dias et
98
al.,1996; Roberts et al., 1988); and similar results have been obtained in rhesus monkeys
99
(Macaca mulatta; Weed, Bryant, & Perry, 2008; Baxter & Gaffan, 2007). Rodents, such as
100
2014; McGaughy et al., 2014; McAlonan & Brown, 2003; Birrell & Brown, 2000) and mice
102
(e.g. Janitzky et al., 2015; Bissonette, Lande, Martins, & Powell, 2012; Garner et al., 2006;
103
Colacicco, Welzl, Lipp, & Wuerbel, 2002) also show the ability to form and shift attentional
104
sets. Comparable findings in other taxa such as birds, fishes and reptiles are scarce (Table
105
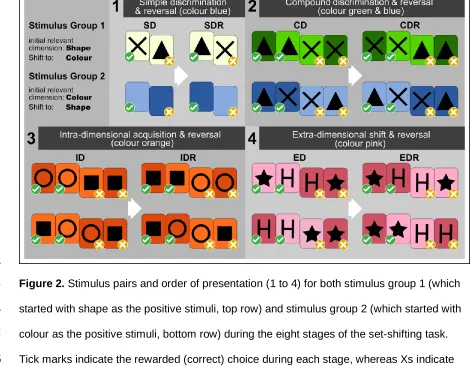
1). One study in great tits (Parus major) showed their ability to form an attentional set and
106
shift to a new dimension (Titulaer, van Oers, & Naguib,2012). Painted turtles (Chrysemys
107
picta) show an improved performance during successive compound discrimination reversals,
108
perhaps indicative of set-formation. However, without comparison between intra-dimensional
109
and extra-dimensional stages, this improvement could equally be evidence of learning
set-110
formation (training effect) instead of attentional set-formation (Cranney & Powers, 1983).
111
Most studies in lizards lack the details needed for a comprehensive comparison of
112
attentional set-shifting because most focus on reversal performance only. For example,
113
Anolis evermanni (Leal & Powell, 2012) were presented with two food wells covered by lids
114
which animals had to dislodge to access a reward. Lizards learnt to open the food dishes
115
using multiple methods and to discriminate between the two wells based on colour (blue and
116
yellow); furthermore, two out of four individuals could reverse this learnt association showing
117
flexibility in their use of visual information. A similar study investigated discrimination
118
learning and reversal in hatchling three-lined skinks (Bassiana duperreyi). Almost all lizards
119
(13/14) that learnt to displace lids could associate lid colour with reinforcement and eight
120
showed flexibility by reversing this learnt association (Clark, Amiel, Shine, Noble, & Whiting,
121
2014).
122
We tested tree skinks (Egernia striolata), which are viviparous, diurnal, family-living
123
lizards found in arboreal as well as rocky habitats throughout eastern Australia (Wilson &
124
Swan, 2008). Tree skinks show complex sociality in which lizards frequently live in family
125
groups consisting of a socially monogamous parental unit and at least one generation of
126
offspring (Whiting & While, 2017; Duckett, Morgan, & Stow, 2012; Chapple, 2003). They are
127
visual foragers that eat plant material (including fruits) as well as insects such as
128
good model to investigate learning in a visual discrimination task. Furthermore, flexibly
130
adjusting behaviour to changing conditions is beneficial for survival (Manrique & Call, 2015).
131
Finally, complex sociality can select for enhanced cognitive abilities including flexibility in
132
learning, attention, and memory (Byrne, 1998; Byrne, 1994; Byrne & Whiten 1988) which
133
can be important tools within a social context as well as outside a social context (Byrne &
134
Bates, 2007).
135
Our aim was to investigate behavioural flexibility in E. striolata by using a
species-136
appropriate modified version of the widely-used set-shifting paradigm designed by Roberts
137
et al. (1988). We presented individuals with visual compound cues consisting of two
138
dimensions (colour and shape) across a series of stages including acquisitions and
139
reversals and a final stage (extra-dimensional shift) in which the reward contingencies were
140
shifted to the formerly irrelevant dimension. Based on this species’ ecology and social
141
structure, we predicted animals would learn the visual discriminations and show learning
142
patterns indicative of set-formation and successful shift of attention.
143
144
METHODS
145
Study Animals and Husbandry
146
We hand-captured 24 adult (snout-vent-length [SVL] ≥ 100 mm; Chapple, 2003) E. striolata
147
(12 males and 12 females, mean SVL ± standard deviation all: 106.08 ± 3.69 mm; male:
148
105.58 ± 4.14 mm; female: 106.58 ± 3.29 mm)near Albury, New South Wales (− 35.980 S,
149
146.970 E), Australia, during April 2016. SVL, total length (TL), mass and sex (presence of
150
hemipenes) were determined on site (Appendix Table A1). Additionally, each lizard was
151
subcutaneously injected with a PIT-tag (Passive Integrated Transponder, Biomark, HPT8,
152
8.4 mm; this method was chosen because animals do not show distinctive markings and it is
153
preferable over toe-clipping) laterally 1.5 cm behind the front leg (no anaesthetic was
154
applied), for individual identification. Skinks were transported to Macquarie University within
155
immediately after arrival. Lizards were housed indoors, with room temperature set at 22.7 ±
157
1.9 °C (mean ± standard deviation, depending on season), relative humidity of 30-65% and
158
a 12:12 h light:dark cycle. We installed heat cord underneath the enclosure to create a
159
thermal gradient between 16-30°C (± 4°C). For the duration of the experiment, room
160
temperature was monitored within enclosures using iButtons (Thermochron iButton model
161
DS1921) which recorded temperature hourly. We used newspaper as a substrate and each
162
enclosure had a hide, a small water bowl, and a wooden ramp. We fed lizards three times a
163
week (Monday, Wednesday and Friday); twice with crickets powdered with vitamins
164
(aristopet Repti-vite) and calcium (URS Ultimate Calcium) and once with baby food (2 ± 0.1
165
g, HeinzTM). During experiments, skinks were fed small amounts (0.15 ± 0.01 g) of baby food
166
daily and crickets on Fridays; animals had ad libitum access to water. To ensure that
167
animals had acclimated to the conditions of captivity, we kept them undisturbed for two
168
weeks and made sure they were feeding consistently. All subjects were naïve and had never
169
participated in any other cognition experiments.
170
171
Learning experiment
172
Habituation
173
To habituate the animals to the experimental setup, we transferred them to bigger tubs (683
174
L x 447 W x 385 H mm) 12 days prior to the start of the experiment. Previous studies have
175
shown that extensive handling and unfamiliar environments induce increased levels of stress
176
which affects learning (Langkilde & Shine, 2006; Burghardt, 1978); therefore, animals were
177
kept and tested in these enclosures for the entire experiment. They were identical to
178
previous enclosures except that a second ramp was introduced (Figure 1). Baby food was
179
presented on top of one ramp in a small white plastic saucer (3 cm in diameter) for two days
180
(counterbalanced for side).
181
Setup
183
During trials the newspaper substrate was taped down to prevent animals from crawling
184
underneath and a small opaque food dish (12 mm high x 55 mm diameter, covered on the
185
outside with black electrical tape) was placed on the top of each ramp. Both dishes
186
contained a small amount of baby food (0.15 ± 0.01 g) and were covered with fine mesh
187
screen; however, the reward was made accessible by a hole cut through the screen.
188
Animals were not able to see into the feeding dishes from the starting position on the other
189
side of the tub. Cue cards containing the stimuli (colour/shape) were fixed directly behind
190
and as close as possible to the dishes. Half of the subjects (N = 12) were first tested with
191
colour as the relevant cue dimension, the other half (N = 12) with shape (Figure 2). Within
192
these two groups half of the subjects (N = 6) started with stimulus 1 (Stages 1&2:
193
triangle/light blue, stages 3&4: X/dark blue, stages 5&6: O/light orange, stages 7&8: H/light
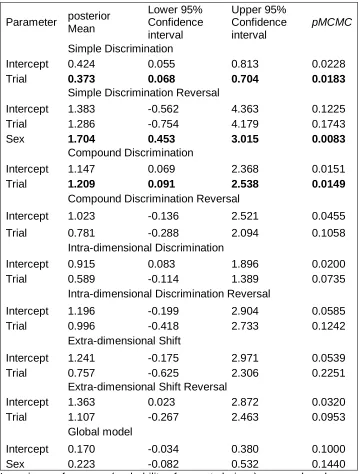
194
pink) and the other half (N = 6) with stimulus 2 (second stimulus in the pair, Figure 2);
195
making four stimulus groups and effectively counterbalancing the rewarded stimulus within
196
the groups. All groups were counterbalanced for sex and mean SVL (± 0.1 mm).
197
198
Stimuli
199
Cue cards with the stimuli (S) were made of pressed wooden coaster cards (rectangle
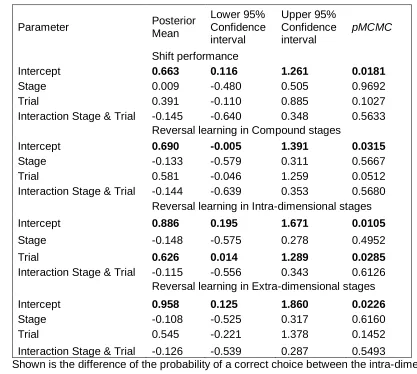
200
coaster, Boyle Industries Pty Ltd, 11.3 L x 9.3 W x 0.3 H mm) and sprayed with differently
201
coloured spray paint (Appendix Table A3). Shapes were drawn onto the sprayed cards by
202
tracing a previously created pattern made of cardboard with a black waterproof marker
203
(Figure 2; for information on area and circumference of the shapes see Appendix Table A5).
204
Colour pairs were chosen to be easily discriminable based on lizards’ perception
205
(Fleishman, Loew, & Whiting, 2011) and shapes were made up of lines (e.g. X, O, H) or
206
were solid. During experiments, left/right position was pseudo-randomly predetermined and
207
counterbalanced for side, so that each stimulus was never on the same side more than twice
208
independently of each other.
210
211
Experimental Procedure
212
At the start of a trial, each individual was ushered into its hide if not already in it and placed
213
at the start position opposite the ramps. Next, both cue-cards were simultaneously fixed with
214
putty (Bostik Blu-Tack) to the inner wall of the tub and immediately afterwards feeding
215
dishes were placed on the ramps in the same manner in front of the stimuli. The order in
216
which the subjects were set up was kept constant over the course of the study. After about
217
three minutes of acclimation, the hide was removed and the trial lasted for 1.5 hours. We
218
then returned the hide and removed feeding bowls and cues. Between trials both dishes
219
were cleaned and rebaited, making sure that both bowls were touched. We made sure that
220
cues and feeding dishes were never interchanged between individuals. Trials were
221
conducted from May 2016 to March 2017. We tested subjects twice a day, between
08:00-222
12:30 h, five days a week (= 10 trials per week) with an inter-trial interval (ITI) of 40 minutes.
223
All trials were videotaped (H.264 Digital Video Recorder, 3-Axis Day & Night Dome
224
Cameras) and scored afterwards. Furthermore, during trials animals were left undisturbed to
225
minimise stress caused by the inability to hide.
226
Choice (correct/incorrect) was scored as the first food dish an animal’s snout passed
227
over the edge of. Latency was scored as the time from first movement (directed,
228
uninterrupted forward movement of the whole body ending in the examination of a food
229
bowl; an interruption is defined as no movement for 10 s or more) to the first food dish
230
examined. Animals were not actively corrected when making a wrong choice (non-correction
231
method) and had ample opportunity to visit both stimuli and feeding dishes during trials. We
232
used a learning criterion of 6/6 or 7/8 correct choices in consecutive trials. These criteria
233
were chosen because they have shown to be good indicators of successful learning (Leal &
234
Powell, 2012). To avoid overtraining, an animal was allowed no more than 100 trials for each
235
weeks (60 trials) or did not show criterion performance of 6/6 or 7/8 consecutive trials correct
237
within the 100 trials, it was removed from the experiment (‘non-learner’); as soon as an
238
individual reached criterion, however, it moved on to the next stage.
239
240
Coding
241
A subset (about 17% = 809) of trials randomly chosen from all subjects and stages was
242
rated by two researchers (ML and PY) unfamiliar with the experiment and blind to the tested
243
questions as well as the first author (BS). Inter-observer reliability was calculated based on
244
Cohens kappa (Falissard, 2012), which estimates the inter-rater agreement between two
245
independent raters; 100% agreement equals a kappa of 1, 0% agreement a kappa of 0. It
246
was estimated at 0.92 and 0.94 between ML and BS and PY and BS, respectively.
247
248
Simple Discrimination and Reversal
249
We conducted a simple associative learning test with one stimulus (e.g. X) being positively
250
reinforced (S+) and the other (e.g. triangle) being unrewarded (S−). This stage required
251
subjects to associate one of the stimuli with a reward. After reaching the learning criterion
252
they moved on to a reversal (SDR). Reversals incorporated the same stimulus pairs as the
253
simple discrimination (SD), but with reward contingencies reversed so that the former S−
254
became S+ and vice versa (e.g. the previously-unrewarded X was now rewarded, and the
255
triangle was no longer rewarded, Figure 2).
256
257
Compound Discrimination and Reversal
258
As soon as subjects reached criterion on the simple discrimination reversal, they were tested
259
on the compound discrimination (CD), introducing a second stimulus dimension. The initially
260
trained stimulus dimension remained relevant (e.g. triangle and X), while the second
261
dimension acted as an irrelevant distractor (e.g. background colour). Stimulus group 1 was
262
green background colours and stimulus group 2 with two different colours at the background
264
(light and dark blue, Figure 2). To succeed at this stage, animals had to maintain their
265
attention on the already learnt stimulus-reward association (e.g. X is rewarded regardless of
266
background colour), while ignoring the new stimulus dimension. After the performance
267
criterion was met on the CD, subjects moved on to a reversal (CDR), again changing the
268
former unrewarded S− to S+ and vice versa (e.g. triangle is rewarded regardless of
269
background colour).
270
271
Intra-dimensional Acquisition and Reversal
272
After reaching the learning criterion on the compound discrimination reversal, we introduced
273
new examples of shapes and colours, however, the relevant dimension (stimulus group 1:
274
shape, stimulus group 2: colour) stayed the same as in previous stages (Figure 2). Test
275
subjects had to apply their attentional set to novel pairs of stimuli (e.g. a square and circle),
276
while still ignoring the second dimension (e.g. background colour). After reaching criterion at
277
the intra-dimensional acquisition (ID), subjects were tested on a reversal (IDR), changing
278
reinforcement to the alternate stimulus in a pair.
279
280
Extra-dimensional Shift and Reversal
281
As with the previous stage, we again introduced unfamiliar colours and shapes to the test
282
subjects, however, S+ was shifted to one of the two stimuli within the former irrelevant
283
dimension (stimulus group 1 to colours and stimulus group 2 to shapes; Figure 2). We
284
introduced new stimuli to avoid any partial reinforcement effects (Shanab, & McClure, 1983),
285
and to ensure the intra-dimensional (ID) and extra-dimensional (ED) stages were equivalent
286
(save for the effects of the primed attentional set). Therefore, the reward contingencies
287
changed so that the previously irrelevant dimension now contained the positive and negative
288
stimuli (e.g. light and dark pink), whereas the former relevant dimension (shapes) became
289
reversal (EDR)—the reward now associated with the formerly unreinforced stimulus in the
291
new relevant dimension (e.g. ED: light pink was reinforced, EDR: dark pink was reinforced).
292
293
Statistical Analyses
294
All statistical analyses were performed in R version 3.2.4 (R Development Core Team, 2008)
295
and reported p-values are two tailed (raw data files and R-code are available online through
296
Zenodo, doi: 10.5281/zenodo.1162406). Prior to the start of the experiment, we measured
297
snout-vent length (SVL; proxy for body size) to the nearest 1 mm using a plastic ruler and
298
mass to the nearest 0.1 g using a digital balance. We compared body condition between
299
learners and non-learners using a linear model (LM; Bates, Maechler, Bolker, & Walker,
300
2015) with mass as the response variable and SVL and exclusion (categorical: yes or no) as
301
fixed effects. Furthermore, we determined whether our learning criterion was robust by
302
examining if the number of errors per stage differed between learners and non-learners
303
(exclusion: yes or no) in a generalized linear mixed-effects model (GLMM; Bates et al.,
304
2015). We performed this analysis to test the prediction that ‘non-learners’ make more errors
305
than learners. Learners could have made many errors before reaching criterion and
non-306
learners could have made few errors but never made enough correct choices in a row to
307
reach the learning criterion. If our criterion was robust enough to detect learning, we would
308
expect non-learners to make significantly more errors than learners.
309
To base estimates on as many data points as possible we included data from all
310
animals that reached criterion in any given stage (excluding the stage they were removed) in
311
the analysis. This means that the number of individuals decreases with stage (as they were
312
removed after not reaching criterion) which can compromise statistical power. We applied
313
Bayesian GLMMs (Hadfield, 2010) to test if the probability of choosing correctly increased
314
with the number of trials (indicative of learning) each animal participated in, in each of the
315
eight stages separately. We used the same approach to test if learning performance was
316
influenced by sex or stimulus group as well as interactions between sex and stage, sex and
317
subsequently dropped and the best-fitting model, based on DIC (deviance information
319
criterion), presented (Appendix Table A4). The final global model included only sex and
320
stimulus group as fixed effects. Our analysis did indicate a significant sex difference in one
321
stage (SDR) and sex was therefore included in the analysis of this stage (Table 3). In all
322
models, “trial” was z-transformed (mean centred and scaled by the standard deviation) for
323
better interpretability of probabilities. Models also included individual level random slopes
324
(trial) and intercepts to account for the possible autocorrelation between successive choices.
325
Instead of an attentional set, animals might have formed a learning set (training
326
effect). To test this, we used a Bayesian approach, like the stage-by-stage analysis but
327
including a random intercept for stage in the random effects term. Furthermore, we ran
328
separate GLMMs to find out if performance on the extra-dimensional shift stage differed from
329
the intra-dimensional acquisition stage (shift performance) as well as between acquisition
330
and reversal stages of compound, intra-dimensional and extra-dimensional discrimination
331
(reversal learning) by focusing only on data from stages of interest (either ID and ED, CD
332
and CDR, ID and IDR or ED and EDR) (Table 3). Trial was included in the models as a fixed
333
effect as a scaling variable to make estimates interpretable. Model diagnostics were
334
performed on all models to ensure that no auto-correlation between samples of the posterior
335
distribution occurred (correlation between lags < 0.1; Hadfield, 2010) and that sufficient
336
mixing took place (by visually inspecting plots of MCMC chains). We used a Heidelberg and
337
Welch diagnostic tests to ensure that the chain was long enough. Lastly, to find out if
338
animals made perseverative errors after the initial shift (extra-dimensional shift stage),
339
indicative of the formation of an attentional set (Garner et al., 2006), we investigated their
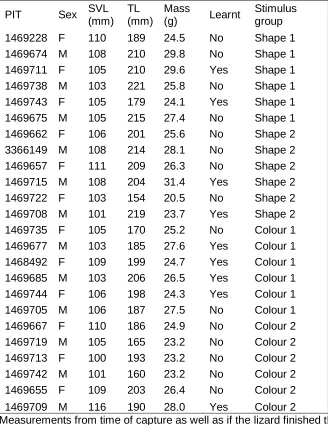
340
choice during the first 10 trials of the extra-dimensional shift stage using the binomial test.
341
342
Ethical note
343
Our study involved non-invasive observations of animal behaviour which were approved by
344
the MacquarieUniversity Animal Ethics Committee (ARA # 2013/031). Collectionof skinks
345
Environment and Heritage (License #SL101264). Skinks were captured individually by hand
347
and placed in cloth bags until they could be transportedby vehicle to Macquarie University
348
from Albury, New South Wales, in an insulated box. If possible both animals in a pair were
349
collected. All animals were euthanized by injecting Lethabarb, diluted 1:1 with saline buffer
350
solution (100mg/kg) intrapleuroperitoneally at the end of the study to extract the brain for a
351
comparative brain study.
352
353
RESULTS
354
Of the 24 animals tested, 15 were excluded because they did not reach the learning criterion
355
in 100 trials: eight (five males and three females) during the simple discrimination; four (two
356
males and two females) during the simple discrimination reversal, two females during the
357
intra-dimensional reversal; and one female during the extra-dimensional shift. Motivation
358
was high during the experiment: in a total of 4854 trials (sum of all 24 individuals) there were
359
only two trials (one each for two subjects) during which the reward was not eaten.
360
Body condition did not differ between learners and nonlearners (LM: estimate =
-361
0.49, std. error = 0.95, t = -0.52, P = 0.610). As predicted, animals that were removed
(non-362
learners) during the experiment made significantly more errors compared to learners
363
(GLMM: estimate = 0.16, std. error = 0.05, Z = 3.14, P = 0.002) showing that non-learners
364
were actually performing badly. Additionally, the probability of choosing correctly increased
365
with trial number, indicated by a positive value, for learners in each stage confirming the
366
robustness of our learning criteria. Due to the decrease in samples size with each stage,
367
statistical power decreases, and consequently, the width of confidence intervals increases to
368
cross zero leading to non-significant results (Table 2). Neither stimulus group nor sex
369
affected performance within any given stage except simple discrimination reversal, in which
370
males’ probability of choosing correctly was significantly higher than females (Table 2).
371
Furthermore, animals did not show a shift cost (increase in number of trial to learn the
extra-372
reversal cost (increased number of trials to learn between acquisition and reversal stages,
374
Table 3 & Figure 3) and animals did not perseverate (base their choice on the previously
375
reinforced dimension) on the formerly relevant dimension (Binomial test, N = 10, P > 0.05;
376
Supplementary material Table 2) during the first 10 trials of the extra-dimensional shift stage.
377
The probability of choosing correctly did not increase significantly with trial when controlling
378
for stage as a random effect, showing that no learning set was formed either (GLMM, post.
379
mean = 0.23, lower 95% Ci = -0.21, upper 95% Ci = 0.66, P = 0.275).
380
381
DISCUSSION
382
Tree skinks learnt to discriminate between three pairs of either two shapes or two colours.
383
Contrary to our predictions, however, animals did not show a significant decrease in the
384
probability of choosing correctly between acquisition and reversal (no reversal cost:
385
compound discrimination and reversal, intra-dimensional acquisition and reversal and
extra-386
dimensional shift and reversal). Furthermore, animals learnt the extra-dimensional shift with
387
the same level of performance as the intra-dimensional acquisition; showing no shift cost
388
either. However, they did learn to use each new set of stimuli to find a reward and to reverse
389
their initial association, indicating behavioural flexibility. Furthermore, the lack of evidence of
390
attentional set-formation and the associated cost to set-shift cannot be based on our failure
391
to reliably detect learning. Non-learners made more errors than learners during the trials
392
they were given and our analyses show a positive effect of trial on choice performance for
393
animals that did learn within a stage. Additionally, we found no effect of body condition or
394
stimulus group on learning ability. Initially males were better at reversing the simple
395
discrimination, but this difference disappeared as stages became more complex.
396
The attentional set-shifting task is designed to show attentional set-formation only if
397
animals experience an increase in trials to criterion during the extra-dimensional shift relative
398
to the intra-dimensional acquisition, after forming a set during the sequential progression
399
& Gaffan, 2007), then compound (in which the same stimuli plus a distractor in the form of a
401
second dimension are presented; Birrell & Brown, 2000), to intra-dimensional discrimination
402
(during which animals have to transfer previously acquired knowledge to unfamiliar stimuli;
403
Brown & Tait, 2015; Dias et al., 1996). Subjects need to overcome this previously learnt
404
attentional set, and shift their attention away from one dimension to the second, formerly
405
irrelevant, dimension. Our data do not show evidence that the tested group of lizards formed
406
an attentional set; therefore, we are not able to conclude that their performance at the
extra-407
dimensional stage reflected an attentional shift. This stands in contrast to findings in
408
primates, rodents and a bird which all showed a decrease in learning speed during the shift
409
stage compared to the intra-dimensional acquisition (Table 1), whereas our lizards showed
410
similar levels of learning in those stages.
411
In addition to the extra-dimensional shift stage, the standard set-shifting task includes
412
reversal stages. During the acquisition (learning) of a discrimination, positive (rewarded
413
stimulus) and negative (unrewarded stimulus) values are assigned to each stimulus (Wise,
414
Murray, & Gerfen, 1996, cited by Manrique & Call, 2015) and the proportion of behavioural
415
responses is increasingly directed towards the reinforced stimulus (learning). When a
416
subject is confronted with a reversal it first must inhibit responding to the formerly positive
417
stimulus and then form a new reward association with the formerly negative stimulus (Dias
418
et al., 1996). Most of our lizards that could learn during acquisitions were able to reverse
419
during the following stage, showing the ability to inhibit responding to an established
420
stimulus-reward relationship and showing flexibility in their response behaviour.
421
Furthermore, our lizards performed well during reversals showing no decrease in
422
performance compared to the respective acquisition stages. This result stands in contrast to
423
findings in rhesus monkeys (e.g. Weed et al., 2008), rats (e.g. McAlonan & Brown, 2003)
424
and mice (e.g. Garner et al., 2006) which perform worse in reversals compared to
425
acquisition.
426
During attentional set-formation, a subject first perceives both dimensions as equal
427
cited by Manrique & Call, 2015). When an attentional set has formed, attention is focused on
429
the relevant information and responses are directed towards the rewarded stimulus (Brown
430
& Tait, 2015) within the relevant dimension. However, a shift to the second dimension
431
requires subjects to inhibit responding to the whole dimension (Dias et al., 1996). Our
432
animals were able to learn the dimensional shift without showing perseverative responses,
433
but as to what strategy they used (e.g. attentional set-shift or learning of each compound
434
cue as a distinct stimulus), and whether an attentional set was overcome, needs to be
435
investigated in future studies. Additionally, based on our analysis, tree skinks also did not
436
form a learning set (training effect), a predisposition to learn based on previous experience.
437
It seems that animals treated each new version of the stimuli as a novel problem and
438
subsequently learnt each acquisition stage individually without experiencing a training effect.
439
The specific learning strategy used by our subjects is also unclear; our dataset is too small
440
to permit any further analysis. Although both concepts, reversal learning and attentional
441
shifts, are similar in the respect that they require some level of behavioural flexibility in
442
responding to the change in stimulus relevance, attentional shifts are generally seen as
443
more complex (Birrell & Brown, 2000; Colacicco et al., 2002).
444
In this study, colour pairs were chosen based on human-perceived brightness and
445
shapes could be categorised into those made up of lines (e.g. X, O, H), and those that were
446
solid (e.g. triangle, square, star). Combinations were chosen to be easily distinguishable
447
based on the lizards’ perceptual ability (they are tetrachromatic and have good visual acuity;
448
Fleishman et al., 2011). Furthermore, skinks could have experienced a sensory bias towards
449
one or more stimuli or a dimension. For example, rhesus monkeys perform differently when
450
shifting according to the stimulus dimension they initially encountered. Monkeys had
451
difficulty shifting from colour to shape but not vice versa (Baxter & Gaffan, 2007). During the
452
first stage, we started each of four subsets of lizards (stimulus groups) with one of the four
453
stimuli (light blue, dark blue, X or triangle). However, performance did not differ between
454
stimulus groups, indicating that our dimensions were of similar difficulty to our test animals.
455
discrimination. As the order of presentation from simple discrimination to intra-dimensional
457
reversal was bright-dark-dark-bright-bright-dark this can be seen as a sequence of simple
458
acquisition and reversal stages. Therefore, if animals had used brightness, our data would
459
show a decrease in trials to criterion since a reversal to a previously correct stimulus is
460
easier than a reversal to a previously not-reinforced stimulus, but no such decrease was
461
found. The same is true for shape solidity, area and circumference
(line-solid-solid-line-solid-462
line, small-large-large-small-large-small and long-short-short-long-short-long). However,
463
there is a small chance that animals used some other property of the cue cards (surface
464
texture or minor imperfections due to the painting process) to learn the discrimination that
465
was not visible to a human observer.
466
In conclusion, tree skinks can learn to distinguish between two visual cues made up of either
467
two colours and/or two shapes. Furthermore, they can reverse an initial stimulus reward
468
association and show behavioural flexibility which can be a beneficial trait while coping with
469
environmental and social challenges. The pattern of learning suggests, however, that they
470
neither formed an attentional set (establishment of a rule set on which subsequent choices
471
are based) nor a learning set (animals’ performance increases based on extensive training).
472
From our results, it is unclear if the tested species is unable to establish dimensionality in
473
compound visual stimuli, or if our methodology was not suitable to test attentional
set-474
formation and shifting in this reptile species. It is most likely that they viewed each new pair
475
of stimuli as a distinct problem and learnt to discriminate the stimuli as a whole, instead of
476
generalizing to a dimension. Our study revealed new insights into visual discrimination
477
learning in lizards that will help design future studies investigating learning in non-avian
478
reptiles. Furthermore, adding evidence on set-shifting in species with a varying degrees of
479
sociality will help understand the relationship between sociality and behavioural flexibility in
480
lizards.
481
482
ACKNOWLEDGEMENTS
483
Cunningham, Christine Wilson, Maiana Lenoir, Pandelitsa Yiasemides and Fonti Kar for their
485
help during data collection and Julia Riley for her help catching lizards and support during
486
data analysis. This project was funded by an ARC Discovery grant (DP130102998) to Martin
487
REFERENCES
489
Bates, D., Maechler, M., Bolker, B., & Walker, S. (2015). Fitting Linear Mixed-Effects Models
490
Using lme4. Journal of Statistical Software, 67(1), 1-48. doi:10.18637/jss.v067.i01.
491
Baxter, M. G., & Gaffan, D. (2007). Asymmetry of attentional set in rhesus monkeys learning
492
colour and shape discriminations. The Quarterly Journal of Experimental Psychology,
493
60(1), 1-8. doi:10.1080/17470210600971485
494
Birrell, J. M., & Brown, V. J. (2000). Medial frontal cortex mediates perceptual attentional
495
set-shifting in the rat. The Journal of Neuroscience, 20(11), 4320-4324.
496
Bissonette, G. B., Lande, M. D., Martins, G. J., & Powell, E. M. (2012). Versatility of the
497
mouse reversal/set-shifting test: Effects of topiramate and sex. Physiology &
498
Behavior, 107(5), 781-786.
499
Brown, V. J., & Tait, D. S. (2015). Behavioral flexibility: attentional shifting, rule switching
500
and response reversal. In I. P. Stolerman & L. H. Price (Eds.), Encyclopedia of
501
Psychopharmacology (pp. 264-269). Berlin, Germany: Springer-Verlag.
502
Burghardt, G. M. (1978). Learning Processes in Reptiles. In C. Gans & D. W. Tinkle (Eds.),
503
Biology of the Reptilia. Volume 7. Ecology and Behaviour A (Vol. 7, pp. 555-681).
504
London, New York: Academic Press.
505
Byrne, R. W. (1994). The evolution of intelligence. Cambridge, GB: Cambridge University
506
Press.
507
Byrne, R. W. (1998). Machiavellian Intelligence. Evolutionary Anthropology, 5(5), 172-180.
508
Byrne, R. W., & Bates, L. A. (2007). Sociality, evolution and cognition. Current Biology,
509
17(16), R714-723. doi:10.1016/j.cub.2007.05.069
510
Byrne, R. W., & Whiten. (1988). Machiavellian Intelligence: Social Expertise and the
511
Evolution of Intellect in Monkeys, Apes, and Humans. New York, NY: Clarendon
512
Press/Oxford University Press.
513
Egernia, with Comments on the Evolution of Complex Sociality in Lizards.
515
Herpetological Monographs, 17, 145-180.
516
Clark, B. F., Amiel, J. J., Shine, R., Noble, D. W. A., & Whiting, M. J. (2014). Colour
517
discrimination and associative learning in hatchling lizards incubated at 'hot' and
518
'cold' temperatures. Behavioral Ecology and Sociobiology, 68(2), 239-247.
519
doi:10.1007/s00265-013-1639-x
520
Colacicco, G., Welzl, H., Lipp, H.-P., & Wuerbel, H. (2002). Attentional set-shifting in mice:
521
Modification of a rat paradigm, and evidence for strain-dependent variation.
522
Behavioural Brain Research, 132, 95-102.
523
Cranney, J., & Powers, A. S. (1983). The effects of core nucleus and cortical lesions in
524
turtles on reversal and dimensional shifting. Physiological Psychology, 11(2),
103-525
111. doi:10.3758/BF03326779
526
Dias, R., Robbins, T. W., & Roberts, A. C. (1996). Primate Analogue of the Wisconsin Card
527
Sorting Test- Effects of Excitotoxic Lesions of the Prefrontal Cortex in the Marmoset.
528
Behavioral Neuroscience, 110(5), 872-886.
529
Duckett, P. E., Morgan, M. H., & Stow, A. J. (2012). Tree-Dwelling Populations of the Skink
530
Egernia striolata Aggregate in Groups of Close Kin. Copeia, 2012(1), 130-134.
531
doi:10.1643/ce-10-183
532
Falissard, B. (2012). psy: Various procedures used in psychometry. R package version 1.1.
533
https://CRAN.R-project.org/package=psy
534
Fleishman, L. J., Loew, E. R., & Whiting, M. J. (2011). High sensitivity to short wavelengths
535
in a lizard and implications for understanding the evolution of visual systems in
536
lizards. Proceedings of the Royal Society B: Biological Sciences, 278(1720),
2891-537
2899. doi:10.1098/rspb.2011.0118
538
Garner, J. P., Thogerson, C. M., Wurbel, H., Murray, J. D., & Mench, J. A. (2006). Animal
539
task for mice. Behavioral Brain Research, 173(1), 53-61.
541
doi:10.1016/j.bbr.2006.06.002
542
Hadfield, J. D. (2010). MCMC methods for Multi-response Generalised Linear Mixed Models:
543
The MCMCglmm R Package. Journal of Statistical Software, 33(2), 1-22.
544
Hecht, P. M., Will, M. J., Schachtman, T. R., Welby, L. M., & Beversdorf, D. Q. (2014).
Beta-545
adrenergic antagonist effects on a novel cognitive flexibility task in rodents.
546
Behavioural Brain Research, 260, 148-154. doi:10.1016/j.bbr.2013.11.041
547
Hinde, R. A. (1987). Themes in the social sciences. Individuals, relationships & culture:
548
Links between ethology and the social sciences. New York: Cambridge University
549
Press.
550
Humphrey, N. (1976). The social function of intellect. In P. P. G. Bateson & R. A. Hinde
551
(Eds.), Growing Points in Ethology (pp. 303-317). Cambridge: Cambridge University
552
Press.
553
Janitzky, K., Lippert, M. T., Engelhorn, A., Tegtmeier, J., Goldschmidt, J., Heinze, H. J., &
554
Ohl, F. W. (2015). Optogenetic silencing of locus coeruleus activity in mice impairs
555
cognitive flexibility in an attentional set-shifting task. Frontiers in Behavioral
556
Neuroscience, 9, 286. doi:10.3389/fnbeh.2015.00286
557
Kim, D. H., Choi, B. R., Jeon, W. K., & Han, J. S. (2016). Impairment of intradimensional
558
shift in an attentional set-shifting task in rats with chronic bilateral common carotid
559
artery occlusion. Behavioural Brain Research, 296, 169-176.
560
doi:10.1016/j.bbr.2015.09.007
561
Langkilde, T., & Shine, R. (2006). How much stress do researchers inflict on their study
562
animals? A case study using a scincid lizard, Eulamprus heatwolei. Journal of
563
Experimental Biology, 209(6), 1035-1043. doi:10.1242/jeb.02112
564
Leal, M., & Powell, B. J. (2012). Behavioural flexibility and problem-solving in a tropical
565
lizard. Biology Letters, 8(1), 28-30. doi:10.1098/rsbl.2011.0480
566
Manrique, H. M., & Call, J. (2015). Age-dependent cognitive inflexibility in great apes. Animal
567
McAlonan, K., & Brown, V. J. (2003). Orbital prefrontal cortex mediates reversal learning and
569
not attentional set-shifting in the rat. Behavioural Brain Research, 146(1-2), 97-103.
570
doi:10.1016/j.bbr.2003.09.019
571
McGaughy, J. A., Amaral, A. C., Rushmore, R. J., Mokler, D. J., Morgane, P. J., Rosene, D.
572
L., & Galler, J. R. (2014). Prenatal malnutrition leads to deficits in attentional
set-573
shifting and decreases metabolic activity in prefrontal subregions that control
574
executive function. Developmental Neuropsychology, 36(6), 532-541.
575
doi:10.1159/000366057
576
McNelis, N. L., & Boatright-Horowitz, S. L. (1998). Social monitoring in a primate group: the
577
relationship between visual attention and hierarchical ranks. Animal Cognition, 1,
65-578
69.
579
Mukhopadhyay, P., Dutt, A., Kumar Das, S., Basu, A., Hazra, A., Dhibar, T., & Roy, T.
580
(2008). Identification of neuroanatomical substrates of set-shifting ability - evidence
581
from patients with focal brain lesions. Progress in Brain Research, 168, 95-104.
582
R Development Core Team (2008). R: A language and environment for statistical computing.
583
R Foundation for Statistical Computing, Vienna, Austria. ISBN 3-900051-07-0, URL
584
http://www.R-project.org.
585
Roberts, A. C., Robbins, T. W., & Everitt, B. J. (1988). The effects of intradimensional and
586
extradimensional shifts on visual discrimination learning in humans and non-human
587
primates. The Quarterly Journal of Experimental Psychology Section B, 40(4),
321-588
341. doi:10.1080/14640748808402328
589
Shanab, M. E., & Mcclure, F. H. (1983). Age and sex differences in discrimination learning.
590
Bulletin of the Psychonomic Society, 21(5), 387-390. doi:10.3758/bf03329988
591
Sutherland, N. S., & Mackintosh, N. J. (1971). Mechanisms of animal discrimination learning.
592
New York: Academic Press.
593
Titulaer, M., van Oers, K., & Naguib, M. (2012). Personality affects learning performance in
594
doi:10.1016/j.anbehav.2011.12.020
596
Weed, M. R., Bryant, R., & Perry, S. (2008). Cognitive development in macaques: attentional
597
set-shifting in juvenile and adult rhesus monkeys. Neuroscience, 157(1), 22-28.
598
doi:10.1016/j.neuroscience.2008.08.047
599
Welsh, M. C., & Pennington, B. F. (1988). Assessing frontal lobe functioning in children:
600
Views from developmental psychology. Developmental Neuropsychology, 4(3),
199-601
230. doi:10.1080/87565648809540405
602
Wiley, R. H. (2013). Specificity and multiplicity in the recognition of individuals: implications
603
for the evolution of social behaviour. Biological Reviews of the Cambridge
604
Philosophical Society, 88(1), 179-195. doi:10.1111/j.1469-185X.2012.00246.x
605
Wilson, S., & Swan, G. (2008). A Complete Guide to Reptiles of Australia. Sydney: New
606
Holland.
607
Wise, S. P., Murray, E. A., & Gerfen, C. R. (1996). The frontal cortex basal ganglia system in
608
primates. Critical Reviews in Neurobiology, 10, 317e356.
609
Whiting, M., & While, G. (2017). Sociality in Lizards. In D. Rubenstein & P. Abbot (Eds.),
610
Comparative Social Evolution (pp. 390-426). Cambridge: Cambridge University
611
Press. doi:10.1017/9781107338319.014
612
Table 1. Literature comparison between studies incorporating the described methodology.
614
Species Age Methodology Dimensions ED>ID Study
Primates
Common Marmoset Sub-adult CANTAB ID/ED Visual Yes Dias et al., 1996 Common Marmoset Sub-adult CANTAB ID/ED Visual Yes Roberts et al., 1988
Rhesus Monkeys Juvenile CANTAB ID/ED Visual Yes Weed et al., 2008
Rhesus Monkeys Adult CANTAB ID/ED Visual Yes
Rhesus Monkeys Adult CANTAB ID/ED Visual Partly validated Baxter & Gaffan, 2007 Rodents
Wistar rats Adult ID/ED Olfactory/touch Yes Kim et al., 2016
Sprague Dawley rats Adult ID/ED Olfactory/touch Yes Hecht et al., 2014 Long-Evans hooded rats Adult ID/ED Olfactory/touch Yes McGaughy et al., 2014 Lister hooded rats Adult ID/ED Olfactory/touch Yes McAlonan & Brown, 2003 Lister hooded rats Adult ID/ED Olfactory/touch Yes Birrell & Brown, 2000 Mice (B6.Cg-Tg(Th-cre)1Tmd/J) Adult ID/ED Olfactory/touch No Janitzky et al., 2015
Mice (C57BL/6) Adult ID/ED Olfactory/touch Yes Bissonette et al., 2012
Mice (C57BL/6) Adult ID/ED Olfactory/touch Yes Garner et al., 2006
Mice (C57BL/6J) Adult ID/ED Olfactory/touch Yes Colacicco et al., 2002 Birds
Great tits Adult Reversals and shift Visual/spatial Yes Titulaer et al., 2012 Reptiles
Painted turtle adult Series of ED and
REV Visual
No direct
comparison Cranney & Powers, 1983
Findings in primates, rodents (some examples), birds and reptiles including species tested, age of subjects, methodology and stimuli used are
615
listed as well as if set-formation impaired performance during the dimensional shift. ID – intra-dimensional acquisition, ED –
extra-616
dimensional shift, REV – reversal, CANTAB ID/ED - Cambridge Neuropsychological Automated Test Battery ID/ED attentional set-shifting test.
617
Table 2. Summary of parameter estimates and test statistics calculated for each stage.
619
Parameter posterior Mean
Lower 95% Confidence interval
Upper 95% Confidence interval
pMCMC
Simple Discrimination
Intercept 0.424 0.055 0.813 0.0228
Trial 0.373 0.068 0.704 0.0183
Simple Discrimination Reversal
Intercept 1.383 -0.562 4.363 0.1225
Trial 1.286 -0.754 4.179 0.1743
Sex 1.704 0.453 3.015 0.0083
Compound Discrimination
Intercept 1.147 0.069 2.368 0.0151
Trial 1.209 0.091 2.538 0.0149
Compound Discrimination Reversal
Intercept 1.023 -0.136 2.521 0.0455
Trial 0.781 -0.288 2.094 0.1058
Intra-dimensional Discrimination
Intercept 0.915 0.083 1.896 0.0200
Trial 0.589 -0.114 1.389 0.0735
Intra-dimensional Discrimination Reversal
Intercept 1.196 -0.199 2.904 0.0585
Trial 0.996 -0.418 2.733 0.1242
Extra-dimensional Shift
Intercept 1.241 -0.175 2.971 0.0539
Trial 0.757 -0.625 2.306 0.2251
Extra-dimensional Shift Reversal
Intercept 1.363 0.023 2.872 0.0320
Trial 1.107 -0.267 2.463 0.0953
Global model
Intercept 0.170 -0.034 0.380 0.1000
Sex 0.223 -0.082 0.532 0.1440
Learning performance (probability of correct choices) was analysed separately for each of
620
the eight stages of the experiment including a global model based on data of all stages to
621
investigate the effect of sex on performance. Sample sizes decreased with stage due to
622
animals being removed as non-learners, they are as follows: SDN = 24, SDRN = 16, CDN =
623
12, CDRN = 12, IDN = 12, IDRN = 12, EDN = 10, EDRN = 9. Significant parameters are
624
indicated in bold. pMCMC – significance of parameter based on Bayesian modelling.
625
Table 3. Summary of parameter estimates and test statistics to investigate reversal and shift
627
performance.
628
Parameter Posterior
Mean
Lower 95% Confidence interval
Upper 95% Confidence interval
pMCMC
Shift performance
Intercept 0.663 0.116 1.261 0.0181
Stage 0.009 -0.480 0.505 0.9692
Trial 0.391 -0.110 0.885 0.1027
Interaction Stage & Trial -0.145 -0.640 0.348 0.5633
Reversal learning in Compound stages
Intercept 0.690 -0.005 1.391 0.0315
Stage -0.133 -0.579 0.311 0.5667
Trial 0.581 -0.046 1.259 0.0512
Interaction Stage & Trial -0.144 -0.639 0.353 0.5680
Reversal learning in Intra-dimensional stages
Intercept 0.886 0.195 1.671 0.0105
Stage -0.148 -0.575 0.278 0.4952
Trial 0.626 0.014 1.289 0.0285
Interaction Stage & Trial -0.115 -0.556 0.343 0.6126
Reversal learning in Extra-dimensional stages
Intercept 0.958 0.125 1.860 0.0226
Stage -0.108 -0.525 0.317 0.6160
Trial 0.545 -0.221 1.378 0.1452
Interaction Stage & Trial -0.126 -0.539 0.287 0.5493
Shown is the difference of the probability of a correct choice between the intra-dimensional
629
and extra-dimensional shift stage (shift performance) as well as acquisition and reversal
630
stages. Significant parameters are indicated in bold. pMCMC – significance of parameter
631
based on Bayesian modelling.
632
Table A1. Summary of measurements and stimulus group composition.
634
PIT Sex SVL
(mm) TL (mm)
Mass
(g) Learnt
Stimulus group 1469228 F 110 189 24.5 No Shape 1 1469674 M 108 210 29.8 No Shape 1 1469711 F 105 210 29.6 Yes Shape 1 1469738 M 103 221 25.8 No Shape 1 1469743 F 105 179 24.1 Yes Shape 1 1469675 M 105 215 27.4 No Shape 1 1469662 F 106 201 25.6 No Shape 2 3366149 M 108 214 28.1 No Shape 2 1469657 F 111 209 26.3 No Shape 2 1469715 M 108 204 31.4 Yes Shape 2 1469722 F 103 154 20.5 No Shape 2 1469708 M 101 219 23.7 Yes Shape 2 1469735 F 105 170 25.2 No Colour 1 1469677 M 103 185 27.6 Yes Colour 1 1468492 F 109 199 24.7 Yes Colour 1 1469685 M 103 206 26.5 Yes Colour 1 1469744 F 106 198 24.3 Yes Colour 1 1469705 M 106 187 27.5 No Colour 1 1469667 F 110 186 24.9 No Colour 2 1469719 M 105 165 23.2 No Colour 2 1469713 F 100 193 23.2 No Colour 2 1469742 M 101 160 23.2 No Colour 2 1469655 F 109 203 26.4 No Colour 2 1469709 M 116 190 28.0 Yes Colour 2
Measurements from time of capture as well as if the lizard finished the eight stages of the
635
task (learnt) and which stimulus group each animal belonged to. PIT – animal ID, SVL –
636
Snout Vent Length, TL – Total length.
637
Table A2. Perseverative errors.
639
PIT Sex Stimulus group
Perseverative trials
(out of 10) Stimulus
Binomial
significance level
1469711 F Shape 1 6/4 Star/H 0.7539
1469743 F Shape 1 4/6 Star/H 0.7539
1469715 M Shape 2 5/5 Star/H 1
1469708 M Shape 2 4/6 Star/H 0.7539
1469677 M Colour 1 5/3 DP/LP 0.7266
1469492 F Colour 1 6/4 DP/LP 0.7539
1469685 M Colour 1 3/7 DP/LP 0.3438
1469744 F Colour 1 5/5 DP/LP 1
1469709 M Colour 2 5/5 DP/LP 1
Number of perseverative errors during the first 10 trials (677 received only eight trials) of the
640
extra-dimensional shift stage of the nine individuals reaching criterion during this stage. The
641
table includes PIT (animal identification), sex of subjects, stimulus group subjects were in,
642
number of errors to the previously reinforced dimension, stimulus perseverative errors were
643
focused on and significance based on a two-tailed binomial test. DP – dark pink, LP – light
644
pink.
645
[image:29.595.79.474.96.257.2]Table A3. Spray paints used to create the colour dimension on the cue cards.
647
Stage Colour Brand Colour name
SD/SDR/CD/CDR colour group
Light blue White Knight, Squirts Gloss Sky Blue Dark blue White Knight, Squirts Gloss Bermuda Blue
SD shape group Beige Fiddly Bits Ivory (discontinued)
CD/CDR shape group Light green
British Paints, Spray
Easy Lime Green
Dark green White Knight, Squirts Gloss Bright Green ID/IDR Light orange White Knight, Squirts Gloss Golden Yellow
Dark orange White Knight, Squirts Gloss Orange X15 ED/EDR Light pink White Knight, Squirts Gloss Pink
Dark pink White Knight, Squirts Gloss Fuchsia List includes the stage cards were used in, the colour, the name of the paint brand and
648
name of the colour as per manufacturer. SD – simple discrimination, SDR – simple
649
discrimination reversal, CD – compound discrimination, CDR – compound discrimination
650
reversal, ID – intra-dimensional acquisition, IDR – intra-dimensional reversal, ED –
extra-651
dimensional shift, EDR – extra-dimensional reversal.
652
Table A4. Order of stepwise model simplification.
654
Order Model DIC Reason for removal of terms
1
Correct ~ Sex + Stimulus group
+ Sex : Stage
+ Sex : Stimulus group + Stimulus group : Stage
4750.95
Important interactions Stimulus group:Stage in CD, ID and ED are not significant (interaction dropped)
2
Correct ~ Sex + Stimulus group
+ Sex : Stage
+ Sex : Stimulus group
4736.71
Sex:Stimulus group interaction was only partly estimable due to
insufficient data (interaction dropped)
3
Correct ~ Sex + Stimulus group
+ Sex : Stage
4736.92
Only one interaction significant (Sex:Stage – SDR), added to stage analysis (interaction dropped) 4 Correct ~ Sex + Stimulus
group 4736.35
Neither Sex nor stimulus group are significant
5 Correct ~ Sex 4735.07 Best fitting model based on DIC 6 Correct ~ Stimulus group 4736.81 Model 5 explains the data better
Models were run to explore the effect of sex, stimulus group, stage and interactions between
655
the three effects on the probability of choosing correctly during the whole experiment (all
656
stages). Reasons for removal of terms is given as well as the DIC (deviance information
657
criterion). The final model was selected based on DIC.
658
Table A5. Shape area and circumference.
660
Shape Stage Area
(cm2)
Circumference (cm)
X Simple & compound discrimination and
reversal 14.08 36.80
Triangle Simple discrimination and reversal 22.01 21.30 Circle Intra-dimensional acquisition and reversal 13.85 30.47 Square Intra-dimensional acquisition and reversal 26.01 22.00 H Extra-dimensional shift and reversal 13.28 35.00 Star Extra-dimensional shift and reversal 17.43 28.00
Amount of black area and circumference of the different shapes used during the set-shifting
661
experiment. Shapes are given in writing and as symbols, as well as what stages they were
662
used in and their area and circumference.
663
665
Figure 1. Schematic representation of the setup used during the set-shifting experiment.
666
Two ramps are place at one end of the tub (approximately 15 cm apart, the water bowl in
667
between) with the cue cards containing the stimuli attached to the inner wall of the enclosure
668
at the top end of the ramp and the food dishes containing the reward directly in front of the
669
cards. The start position indicates the position from where animals started in each trial.
670
672
Figure 2. Stimulus pairs and order of presentation (1 to 4) for both stimulus group 1 (which
673
started with shape as the positive stimuli, top row) and stimulus group 2 (which started with
674
colour as the positive stimuli, bottom row) during the eight stages of the set-shifting task.
675
Tick marks indicate the rewarded (correct) choice during each stage, whereas Xs indicate
676
that access to the reward was blocked (incorrect choice). SD – simple discrimination, SDR –
677
simple discrimination reversal, CD – compound discrimination, CDR – compound
678
discrimination reversal, ID – intra-dimensional acquisition, IDR – intra-dimensional reversal,
679
ED – extra-dimensional shift, EDR – extra-dimensional reversal.
680
682
Figure 3. Mean + SE trials to criterion (including criterion trials) for each stage of the
683
experiment. Sample sizes are given within bars. SD – simple discrimination, SDR – simple
684
discrimination reversal, CD – compound discrimination, CDR – compound discrimination
685
reversal, ID – intra-dimensional acquisition, IDR – intra-dimensional reversal, ED –
extra-686
dimensional shift, EDR – extra-dimensional reversal. Stages were not significantly different
687
from each other.
688
APPENDIX A