9<8=0> 65 /-;- 18-2405;-;365 399<09 168 <9089
7MMH? .?P ?S ?O ?H .?JCIR LB?O EG
- ;FCP GP 9R @KGQ Q CB DMO Q FC /CEO CC MD 49A ?Q Q FC
<LGS CO P GQ U MD 9Q -LBO CT P
(&'+
1R JJ KCQ ?B?Q ? DMO Q FGP GQ CK GP ?S ?GJ?@JC GL 9Q -LBO CT P 8CP C?O AF 8CNMP GQ MO U
?Q ,
FQ Q N,%%O CP C?O AF#O CNMP GQ MO U $P Q #?LBO CT P $?A$R I%
7JC?P C R P C Q FGP GBCLQ GDGCO Q M AGQ C MO JGLI Q M Q FGP GQ CK, FQ Q N,%%FBJ$F?LBJC$LCQ %'&&()%'&&&*
U
NIVERSITY OF
S
T
A
NDREWS
S
CHOOL OF
C
OMPUTER
S
CIENCE
IS 5199
Survey on Data Fragmentation Issues for Users
Pooja Basavaraj Balekundargi
150023241
Submitted in partial fulfilment of the requirements for the degree
of Master of Science in Information Technology
ACKNOWLEDGEMENTS
I would like to express my appreciation to those that helped me throughout the project.
I would like to thank my supervisors Dr. Graham Kirby and Dr. Miguel Nacenta from the School of Computer Science. They have provided immense guidance, support, and patiently helped me to achieve my project outcome, from the initial brainstorming ideas to the analysis.
I would like to thank Tom Kelsey for providing great suggestions and encouragement.
I would like to thank all the students and faculty for taking time out of their busy schedule to take part in this study or providing great suggestions and encouragement
ABSTRACT
Information is just data that is processed and given meaning. We live in a world where we use information to carry out the simplest tasks. We normally have different types of information, some very important and some less. Some of it is used for entertainment, some for the purpose of decision making, or just as a knowledge improvement tool. With new technologies being invented everyday, we tend to use different methods to store this information. We store information across various locations and across different services depending on personal preferences and needs. This causes information to get dispersed, most commonly known as data fragmentation. It is important to have efficient access to information at the time of need. However, although storing information in different places might aid in accessibility beyond geographical boundaries, it also hinders the process of finding and remembering the location of the right information. The following research study aims to gain insight into the methods used by individuals while storing information that is valuable to their daily activities. We also look at the mind sets of the users while they make decisions regarding storage methods. The empirical research carried out over the course of this dissertation provides insight on the causes and consequences of data fragmentation with regards to personal information. The findings have been analyzed and reported in readable format.
TABLE OF CONTENTS
1. INTRODUCTION 10
1.1 BACKGROUND 10
1.2 DEFINITIONS AND IMPORTANT TERMS 11
WHAT IS INFORMATION? 11
WHAT IS DATA FRAGMENTATION? 11
WHAT IS PERSONAL DATA? 12
WHAT IS PERSONAL INFORMATION? 12
WHAT IS PERSONAL INFORMATION MANAGEMENT? 12
2. PURPOSE OF THE PROJECT 13
2.1OBJECTIVES 13
2.2 SCOPE 13
3. LITERATURE SURVEY 14
3.1 PAST TO PRESENT 14
3.2 BASED ON INFORMATION TYPE 15
3.2.1 EPHEMERAL INFORMATION 15
3.2.2WORKING INFORMATION 15
3.2.3 ARCHIVED INFORMATION 16
3.3 BASED ON DIFFERENT FORMATS 16
3.4 BASED ON FOLDER ORGANIZATION 16
3.5 BASED COGNITIVE FACTORS 17
3.6 BASED ON BACK-UP. 18
4. CURRENT POPULAR TECHNOLOGIES AND SOLUTIONS: 18
4.1CLOUD STORAGE SYSTEMS 18
A) THE GAP BETWEEN ONLINE AND OFFLINE 20
B) FILE STORAGE AND SYNCHRONIZATION 20
C) INTERFACE DESIGN 20
4.2 EXTERNAL STORAGE DEVICES AND BACK UP SOFTWARES 20
5. RESEARCH DESIGN AND METHODOLOGY 21
5.1RESEARCH QUESTIONS 21
5.2 RATIONALE 21
5.3DATA COLLECTION 21
A) QUESTIONNAIRE DESIGN 21
B) INTERVIEW DESIGN 22
5.4 PARTICIPANTS 22
5.5 ETHICS 23
5.6 FRAMEWORK FOR DATA ANALYSIS 23
A) INTERVIEW + QUESTIONNAIRE 23
B) SURVEY QUESTIONNAIRE 24
5.8 PROBLEMS FACED AND LIMITATIONS. 25
5.9PROJECT PLAN 26
6. ANALYSIS: SURVEY QUESTIONNAIRE 27
RELATED SAMPLES 27
6.1 ACCESSIBILITY 27
6.1.1 FREQUENTLY USED PRIVATE INFORMATION AND FREQUENTLY USED PUBLIC INFORMATION. 28
6.2 RETRIEVAL 31
COMPARISONS ACROSS DIFFERENT TYPES OF DATA 32
6.2.1FREQUENTLY USED PRIVATE INFORMATION AND FREQUENTLY USED PUBLIC INFORMATION. 32
6.3 SAFETY AND SECURITY 34
COMPARISONS ACROSS DIFFERENT TYPES OF DATA 35
6.3.1 NON-FREQUENTLY USED PRIVATE INFORMATION AND FREQUENTLY USED PRIVATE INFORMATION. 35 6.3.2 FREQUENTLY USED PRIVATE INFORMATION AND FREQUENTLY USED PUBLIC INFORMATION. 36
ONE SAMPLE TESTS 38
6.4 ACCESSIBILITY 38
6.4.1 I FIND THAT DOCUMENTS STORED IN DIFFERENT FORMATS ARE INACCESSIBLE BY DIFFERENT DEVICES 39
6.5RETRIEVAL 41
6.5.1 I SOMETIMES HAVE MULTIPLE COPIES OF THE SAME INFORMATION IN DIFFERENT STORAGE LOCATIONS 42
6.6 SAFETY AND SECURITY: 43
6.6.1 IT WOULD BE TROUBLING AND/OR CAUSE ME DISTRESS IF MY DATA SUDDENLY BECOMES AVAILABLE 44
ADDITIONAL FACTORS: 45
6.6.2 STORING DATA IS EXPENSIVE 45
6.6.3MY DATA IS FRAGMENTED/SPREAD OVER TOO MANY DIFFERENT SERVICES AND/OR DEVICES 46
6.6.4.USAGE OF MULTIPLE METHODS 47
7. ANALYSIS: INTERVIEWS 48
7.1 HOW MANY INFORMATION ITEMS DID THEY FIND? 48
7.2 WHERE DO PEOPLE STORE DIFFERENT TYPES OF DATA? 49
7.2.1 PUBLIC INFORMATION 49
7.2.2PRIVATE INFORMATION 50
7.3WHAT ARE THE FACTORS THAT INFLUENCE INDIVIDUALS WHILE MAKING DECISIONS ABOUT STORING INFORMATION? 52
7.3.1ENVIRONMENTAL FACTORS 52
7.3.2 EMOTIONAL FACTORS 53
7.3.3 COGNITIVE FACTORS 54
8. RESULTS AND DISCUSSION 56
9. PERSONAL REFECTION 57
10. RECOMMENDATIONS AND FUTURE WORK 57
11. CONCLUSION 58
12. REFERENCES 58
13.1 FULL ETHICS FORM 61
13.2ETHICS APPROVAL FORM 61
13.3QUESTIONNAIRE 61
13.4 PARTICIPANT INFORMATION SHEET 61
13.5 PARTICIPANT CONSENT FORM 61
13.6 DEBRIEFING FORM 61
13.7 INTERVIEW QUESTIONS 61
13.8RELATED SAMPLE TESTS:ACCESSIBILITY 61
13.9RELATED SAMPLE TESTS:RETRIEVAL 61
13.10 RELATED SAMPLE TESTS: SAFETY AND SECURITY 61
13.11ONE SAMPLE TESTS:ALL QUESTIONS 62
13.12 FREQUENCY DISTRIBUTIONS OF ALL DATA 62
13.13 GENDER DEMOGRAPHICS OF QUESTIONNAIRE DATA 62
13.14 AGE DEMOGRAPHICS OF QUESTIONNAIRE DATA 62
Table of figures
FIGURE 1: EXAMPLE FOLDER ORGANIZATION BY SUBJECT FRAGMENTATION BY A STUDENT[10] 17
FIGURE 2: BROWSER COMPATIBILITY COMPARISONS OF GOOGLE DRIVE 19
FIGURE 3 :PICTURE SHOWING 4 CATEGORIES OF PERSONAL INFORMATION 22
FIGURE 4: HORIZONTAL TREE DIAGRAM OF DATA COLLECTION METHODS. 23
FIGURE 5: GANTT CHART SHOWING A BRIEF PLAN OF ACTION 26
FIGURE 6: BAR CHART SHOWING PARTICIPANTS RESPONSES ON ACCESSIBILITY OF DIFFERENT TYPES OF
INFORMATION. 28
FIGURE 7: CHART SHOWING ACCESSIBILITY OF NON-FREQUENTLY USED PRIVATE INFORMATION WITH
FREQUENTLY USED PRIVATE INFORMATION 29
FIGURE 8: ACCESSIBILITY OF NON-FREQUENTLY USED PUBLIC INFORMATION AND FREQUENTLY USED PUBLIC
INFORMATION 30
FIGURE 9: BAR CHART SHOWING AN OVERVIEW OF THE PARTICIPANTS VIEWS ON THE QUICK RETRIEVAL OF
DIFFERENT TYPES OF INFORMATION WITH THEIR CURRENT STORAGE SETUP. 32
FIGURE 10:CHART SHOWING RETRIEVAL OF FREQUENTLY USED PRIVATE INFORMATION AND FREQUENTLY USED
PUBLIC DOCUMENTS 33
FIGURE 11: GROUPED BAR CHART SHOWING AN OVERVIEW OF THE PARTICIPANTS VIEWS ON SAFETY AND SECURITY OF DIFFERENT TYPES OF INFORMATION WITH THEIR CURRENT STORAGE SETUP. 35
FIGURE 12: SAFETY AND SECURITY OF NON-FREQUENTLY USED PRIVATE INFORMATION AND FREQUENTLY USED
PRIVATE INFORMATION. 36
FIGURE 13: SAFETY AND SECURITY OF FREQUENTLY USED PRIVATE INFORMATION AND FREQUENTLY USED
PUBLIC INFORMATION 37
FIGURE 14: HORIZONTAL BAR CHART SHOWING PARTICIPANTS VIEWS ON FILE FORMAT CAUSING INFORMATION
TO BE INACCESSIBLE. 40
FIGURE 15: CHART SHOWING THE FREQUENCIES AND PERCENTAGE FREQUENCIES OF RESPONSES ABOUT
MULTIPLE COPIES OF DATA 42
FIGURE 16:BAR CHART SHOWING PARTICIPANTS VIEWS ON DISTRESS CAUSED BY LOSS OR LEAK OF DATA. 44
FIGURE 17:BAR CHART SHOWING THE PARTICIPANTS VIEWS ON EXPENSES OF STORING DATA. 45
FIGURE 18: BAR CHART FOR PARTICIPANTS VIEWS ON DATA FRAGMENTATION 46
FIGURE 20: FACTORS CAUSING DATA FRAGMENTATION. 52
FIGURE 21: INTERVIEW PARTICIPANTS VIEWS ON ACCESSIBILITY 55
Table of tables
TABLE 1: SYSTEMS INTEROPERABILITY OF CLOUD STORAGE APPLICATIONS. [39] 19
TABLE 2: CROSS TABLE CONTAINING 6 GROUPS OF INFORMATION COMPARISONS. 31
TABLE 3 : CROSS TABLE CONTAINING 6 GROUPS OF INFORMATION COMPARISONS 34
TABLE 4 : CROSS TABLE CONTAINING 6 GROUPS OF INFORMATION COMPARISONS 38
TABLE 5: TABLE SHOWING THE FREQUENCIES AND PERCENTAGE FREQUENCIES OF INFORMATION FOR
ACCESSIBILITY. 39
TABLE 6: TABLE SHOWING FREQUENCIES AND PERCENTAGE FREQUENCIES OF PARTICIPANTS RESPONSES ON
RETRIEVAL 41
TABLE 7: TABLE SHOWING FREQUENCIES AND PERCENTAGE FREQUENCIES OF PARTICIPANTS RESPONSES ON
SAFETY AND SECURITY 43
TABLE 8: NUMBER OF ITEMS RETRIEVED BY THE PARTICIPANTS IN 15 MINUTES 48
TABLE 9: TABLE SHOWING MOST COMMONLY USED STORAGE METHODS FOR PUBLIC INFORMATION. 50
1.
INTRODUCTION
With the advent of technology, there is colossal amounts of data being created and stored on a daily basis. The following data is then stored as information files and used by organizations and individuals for efficient decision making. However, these information files are stored in different forms i.e. documents, text files, images, video files, appointment reminders, bookmarks etc. and stored on different types of devices and services i.e. public/private cloud storage services, mobile phones, paper based storage, computer devices, storage servers, external hard drives etc. This results in information being dispersed across various locations thus causing data fragmentation. Dispersal of information across several devices and services makes it accessible from different locations. However, inefficient management of an individual’s storage setup can have an adverse effect in retrieving this information in the time of need.
In reality, making decisions on choices of storage methods is harder due to the variety of options available. It is important to consider factors like safety and security, back up and storage capability of the device in question while making these decisions. Information is used for all purposes by individuals of all generations. There are several forms in which we use our data. For example, one usually begins the day with reading the news either in a paper based format like a newspaper or in a digital text format from a mobile phone, tablet, desktop computer, television. This is followed by using data at work, or at school or while resting at home. All these activities, require us to come in contact with information that we access through information devices. Disruption of these activities can inevitably cause disturbance to one’s entire likelihood. Loss of data or difficulties in retrieving them is a concern of many sectors.
In recent years, there have been major technological improvements in personal information storage devices and services but not enough improvement in management and organization of information stored across these devices and services to help increase the speed of retrieval and accessibility. We live in a world that is data driven. Whether, it is the education sector, businesses or even individuals carrying out their daily activities at their work environment or home. It is important to realize that information not accessible in the time of need can have a significant impact on the efficiency and productivity of daily activities. For this reason, this research project attempts to gain insight into issues caused by data fragmentation, with a specific focus on individuals.
1.1
Background
data, individuals generally choose devices based on their knowledge of and confidence in the storage device and/or service.
Personal information is very easy to create, store and even easier to destroy. Often this kind of information is created in a hurry which results in unclear and inconclusive naming of information, ultimately causing problems in retrieving them for later usage. This suggests that we need improvement in organization methods and systems which will ease the process of finding and retrieving information. In this study, we focus on information management problems caused due to data fragmentation of personal information and look at various devices and services that are currently being used by individuals.
1.2
Definitions and important terms
What is information?
Information is processed data that is used to carry out day today activities and as source for further learning.
“Information is a source of learning. But unless it is organized, processed, and available to the right people in a format for decision making, it is a burden, not a benefit.”- William Pollard [4].
What is data fragmentation?
Individuals generally store data/information across various devices and applications in order to make room for storage. However, this causes data to get dispersed across different locations. This is known as data fragmentation. The term data fragmentation takes different meaning depending on the field of research. It is most commonly used in the field of database management systems where data fragmentation is the breaking up of a single database into multiple fragments. These fragments are then stored individually and accessed by the database management system(DBMS) based of requirement[5].
What is personal data?
According to the data protection act by the ICO –
“Personal data means data which relate to a living individual who can be identified –
(a) from those data, or
(b) from those data and other information which is in the possession of, or is likely to come into the possession of, the data controller,
and includes any expression of opinion about the individual and any indication of the intentions of the data controller or any other person in respect of the individual[7].”
What is Personal information?
Personal information is information that is valuable to an individual. It can be further divided into information that is private, the loss or leak of which could have the potential of causing danger or embarrassment to an individual and public information, the loss or leak of which will not have the potential of causing danger or embarrassment.
Personal information is generally used to help the development of an individuals learning technique or as a reminder of the past and the future. This includes emails, notes, bookmarks, references, files, pictures, receipts, home videos, text messages, meeting reminders, to do lists etc.[8]. It is different types of information that are of value to an individual and are worthy of archiving[9].
What is Personal information management?
2.
PURPOSE OF THE PROJECT
2.1 Objectives
Primary
• Identify and measure of severity of data fragmentation issues inducing inefficient personal information management.
• Outline the behavioral implications that lead to data fragmentation problems and providing suggestions to reduce the impact.
• A written analysis of the causes and consequences of data fragmentation on different types of users.
• Discuss the impact of physical distribution of storage devices hindering easy locating of data.
Secondary
• Provide a taxonomy of personal information storage systems while outlining the potential advantages and disadvantages.
• Identifying the security implications of data fragmentation and the need for back up. • Provide recommendations regarding technological advancements that will help
decrease the severity of the issues.
• Critically analyze the existing research in the following area and summarize the findings.
2.2 Scope
The following study will shed light on the the severity of data fragmentation and the stakeholders include:
1. Individuals:
Individuals who have incomplete knowledge of personal information storage services and are looking for clarity in integration of these services with their personal
information storage setup. Users who are experiencing inconvenience regarding finding, retrieving and accessing information with their current information storage setup.
2. Businesses: Businesses that are looking to create or develop information management systems that cater to the needs of their customers.
3.
LITERATURE SURVEY
3.1 Past to present
There have been several studies addressing issues related to the improper management of personal information. Evidence of data fragmentation and disorganization was noticed quite early on. In the past, individuals faced problems with filing and piling of paper documents on their desks. Large volumes of paper based documents used in their daily life activities and work environment were being stored and retrieved on a regular basis. With the digital era, paper based documents still do form a major part of information documents but have subsequently decreased. In 1983, Malone conducted a study on organizing patterns of paper document on desks in offices. He found that people didn’t want to put things away to organize them because visually accessible documents are easily remembered. He also found differences in cognitive behaviors of people while making decisions about what is to be organized and how. He found that there were similar patterns in the behaviors of storing and retrieving paper documents and electronic documents. He then went on to propose that filing systems should integrate file classification functions based on similar patterns[16].Over the years, studies of similar fashion have been conducted to help decrease data fragmentation problems in systems for improved management and organization with regards to paper-based documents[17], bookmarks[18], emails[19][20], memos, appointment reminders[21]. However, very few studies focus on cross tool organizational strategies and cross device organizational strategies. There have also been studies that address such issues by providing technological solutions. In 1999, Huhn’s suggested building a personal ontology manager which would act as a personal search engine for all online documents[22]. In 2001, Gordon bell proposed a project called cyber all which would help organize, index, store and retrieve personal information for personal and work-related usage. The information items included were CDS, letters, memos emails, photos, papers[23].Following Bells work, an SQL based platform for organizing and accessing information was proposed in 2006. However , the project required the users to manually assign file labels and classification for all pictures, documents , emails which should be done automatically[24]. In 2010, a study suggested that most storing decisions are either user-driven or system-driven and problems with user-driven decisions can be transferred to systems that make makes suggestions for appropriate locations[25].
3.2 Based on Information Type
The differentiation of information management styles for professionals like librarians, employees and individuals who manage personal information has been done by Bergman[15].There is a difference in the way an individual deals with information that related to private life as opposed to information that one needs as part of their work routine.
In 1982, Cole categorized personal information into three differentiable types for filing and organizing office documents as action information, personal work files and archived information[28].Similar categories were adopted by a studies in 1995 to categorize information types for filing, organizing and finding documents in a desktop setting at the work place which were ephemeral, working and archived information[29][30].
3.2.1 Ephemeral information
Ephemeral data is most widely known as temporary information that is regularly created by the user and is most frequently received from an outside source like online articles, new letters. This might also include notes, to do lists, reminders etc. The results from Andersons study showed that the main problem for users while organizing ephemeral data was the short life span, therefore the users didn’t have a set procedure to them. Users generally pile such information on the desktop screen as it is more visually accessible and acts as a reminder[29]. In 1997,a study on customers service executives on storing ephemeral data showed that they would rather write information like phone numbers and to do lists down on paper documents rather than computers to save space on their information systems and out of habit[31]. This causes information to be dispersed everywhere. Boardman and sasse found that some users prefer to file their ephemeral data like emails while the rest just leave it unfiled[32].
Barreau found that the most problematic ephemeral information to be emails. However, the study was conducted on an organizational level and most managers received more that 300 emails a day which made it hard for them to find and retrieve the important ones. Although some managers views emails as ephemeral data, these emails generally contained important working information that can be used as a reference tool later on[33].However, the distinction of the data to be categorized into ephemeral data is quite relative and mainly depends on the user which also suggests that storage systems require flexible organizing procedures that cater to all users.
3.2.2 Working information
information is massive but managed quite efficiently. However, working information eventually turns dormant and if not deleted makes use of unnecessary resources. For example, in Bureau’s study, a manager said that she sends information needed while preparing a speech to her own email and copy pastes it to her messages. such information is not deleted after use and are completely forgotten and useless[33].
3.2.3 Archived information
The main purpose of achieved information is knowledge seeking from data that will be used for a longer duration of time, say 6 months to one year or more. It is generally non-frequently used and stored for specific purposes only. Examples for achieved information are health insurance documents, old receipts, project reports, thesis. These documents are of great value and damage or loss would have undesired consequences. They are the final product from the information gained by using working data and ephemeral data. Bureau’s study showed that users spent a lot of time deciding a structure for these documents because of how important they are[30]. However, once the shelf life period of such documents runs out, users generally forget about the placement of these documents.
3.3 Based on different formats
There also a difference in analyzing if people store information together based on projects that are similar in context or depending on the formats[34]. Studies have shown that users generally ignore the format of the documents and store them according to the context of the projects that they are currently working on. When asked if users organize files based on formats or projects, users choose projects and mentioned that they would organize by formats only if the interface of the storage setup does not allow them to store different formats
together[10].However, this causes inconvenience if different formats in one folder cannot all be read by a device or application due to incompatibility issues.
3.4 Based on folder organization
Figure 1: Example folder organization by subject fragmentation by a student[10]
Folders are generally named by using leading characters like (“A”, “01”) based on the usage pattern. These folder names are sometimes to remember. With the progression of technology, there many extended hierarchies of folders in different applications like webpage bookmarks, emails, messages for different types of information like private information public information, work related information and different types of formats[36][10].Therefore, if not properly managed, retrieval can become a time-consuming task.
3.5 Based cognitive factors
A study conducted at the Tel Aviv University addressed the issues of fragmentation in PIM by suggesting information should be categorized based on the subjective classification principle which implies that all information related to the same subject or topic should be classified in the same folder[15] while other studies focus on search functions based on importance and value of the information[32]. Users generally use different strategies while choosing the PIM methodology. It is a well-known fact that users will use systems that are readily available to them for storing information instead of carefully employing a system that will help them with efficiency in the long run. The cognitive energy [37] and cognitive state[33] has a major influence on the saving , filing , classifying , acquiring, organizing , accessing and retrieving information. It drives an individual to choose the personal information system of their choice. Therefore PIM systems should be alterable and flexible to the requirements of the individuals using them.
3.6 Based on back-up.
Most studies pointed out that there are several approaches to preserving valuable information. Some user’s relied on self back-ups and rarely assessed the safety of their information while others have a set location and procedure to back-up strategies.
It was pointed out during a study that the users did not trust the technologies used for backup. They also had different strategies for backing up private information like pictures, videos and work-related information. While making decisions on what information to back up, users generally categorize them by the level of information, the financial cost of storing this information, value it brings to the customers and organization. However, this study was conducted on an organizational level and not an individual level. [12]
4.
CURRENT POPULAR TECHNOLOGIES AND SOLUTIONS:
Various technologies do currently address the problems related to data fragmentation issues for individuals. The following chapter will be a brief analysis of services that are currently available for users.
4.1 Cloud storage systems
There are currently several cloud storage systems available for users to choose from. For example, Microsoft OneDrive, Google Drive, Dropbox, Box that allow online storage information on the cloud as well as file sharing, online documents editing. The advantages of these storage systems is that as long as one is connected to the internet it is fairly easy to access data from anywhere around the world. These systems automatically backup all online edits and overwritten changes. For example, edits made in desktop applications of drop box and google drive are automatically updated to the newer version. This eliminates the process of making edits offline and accessing the application, delete the older version and uploading of the newer version. However, google drive documents edits uses google tools which does not allow sharing formats. Therefore, in order to edit the document in a different program one will have to export it prior to sharing. Also with regards to storage capabilities, it is an obvious fact that most users use Gmail. Google drive shares storage space with Gmail, which implies that if there is an ample amount of emails, the storage capacity of the drive will be limited[39].
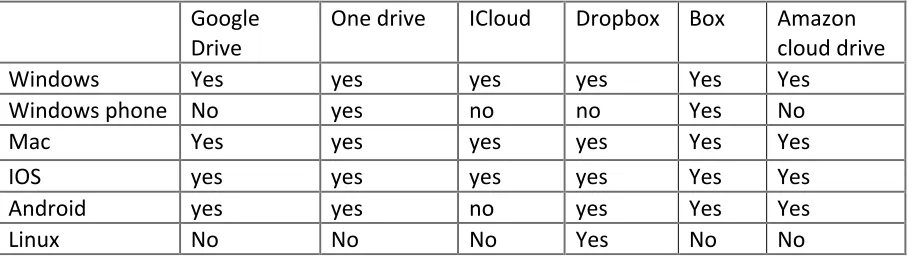
Table 1: Systems interoperability of cloud storage applications. [39]
[image:19.612.74.531.99.229.2]In addition, there are so certain file synchronization problems. For example, if one uses a safari browser on a Mac OS, they will not be able to upload complete folders. A work around for such a problem, is to download the google chrome browser or download the desktop application for google drive. The disadvantage of such a situation is wastage of time spent on uploading a single file as well as time and energy spend in figuring out workarounds to get the task of uploading done faster.
Figure 2: Browser compatibility comparisons of Google Drive
Google Drive accessed though the safari
browser Google Drive accessed through the google chrome browser
Image captured by the researcher
Drive One drive ICloud Dropbox Box Amazon cloud drive
Windows Yes yes yes yes Yes Yes
Windows phone No yes no no Yes No
Mac Yes yes yes yes Yes Yes
IOS yes yes yes yes Yes Yes
Android yes yes no yes Yes Yes
a) The gap between online and offline
The download of desktop applications like Mendeley desktop, Google Drive, OneDrive has many benefits. These files can be accessed by a computer or a phone while the device is not connected to the internet. The problem with backing up everything online is its inaccessibility when offline which has been improved upon in the last few years.
b) File storage and synchronization
With the advantage of having several several file synchronization and file saving applications that cater to the needs of different users, the main disadvantage if this is that information stored in a certain application might not be compatible with another application.
c) Interface design
For files to be easily accessible, the visual design interface should allow users to choose the view based on preference. For example, while google drive allows users to choose between grid view and list view, drop box only allows list view. The disadvantages of this are difficulties in search and scroll functions in case of large amounts of data.
4.2 External storage devices and back up softwares
The most popularly used external storage devices like compact disks, digital versatile disks, blu-ray disks, solid state drives, flash memory cards, USBs, high capacity external drives are the traditional methods generally used to back up information. With the advancements in the cloud, the usage levels of these devices has decreased over the years. However, they are still used by many due to the simplicity and ease of use and mistrust of the cloud. These are most commonly known as direct attached storage (DAS).
The main disadvantage of DAS devices is limited scalability, because of which users are required to invest in additional storage devices and save data across these multiple devices. A possible solution here is using a network attached storage for individual usage. They are reliable, scalable and affordable. NAS also enables redundant array of inexpensive disks. This feature allows the use of multiple drives. NAS can be accessed from anywhere and it is storage locally for immediate retrieval[40].
The most important advantage is the scalability which does not apply to DAS devices. Although, the initial capital investment in NAS devices is higher, it has major benefits in the long run. Most commonly used NAS devices used by home users for personal information are QNAP TS-251, Sinology DS214, WD My Cloud EX2. Options for backs are inbuilt back-up software’s like time-machine for mac only and CrashPlan for Mac, Windows and Linux which allow online and offline back.
5. RESEARCH DESIGN AND METHODOLOGY
The following research study aims to gain insight on data fragmentation problems for individual users. The empirical research intends to answer the research questions while finding evidence of the severity data fragmentation issues. This chapter explains the design of research methodology which was carried out during the course of the project while addressing the data collection methods, methods of analysis and limitations. The research methodology includes a mixture of quantitative and qualitative analysis. Quantitative analysis consists of hypothesis testing and the qualitative analysis consists of interviews. Further description on research methodologies is stated in the framework for data analysis section.
5.1 Research questions
The research questions have been generated by knowledge in the existing literature and missing information. There are several studies that focus on cross-tool fragmentation and organization of personal information but not enough research related to cross-devices and cross-tool issues.
1. How do people treat different types of information? 2. Is data fragmentation causing inconvenience to users?
3. What are the the factors that are influencing individuals to disperse their data across various devices, applications and services?
4. Are there any behavior patterns that are causing these problems? Can change of behavior decrease the degree of the problems associated with data fragmentation?
5.2 Rationale
The preliminary research involved getting a clear understanding of data fragmentation followed by brainstorming of ideas and making a preliminary literature survey which would help in producing the main research questions. After the main research questions were constructed the next step was designing the study and making decisions about the type of data collection. The results acquired from empirical analysis would allow us to analyze the awareness of the content, structure and location of the information that is dispersed across various devices. A mixture of questionnaire data and interview data will provide a comprehensive out-look of individuals experiences towards data fragmentation issues.
5.3 Data Collection
Primary data was collected by 2 methods. i.e. The deployment of a questionnaire survey on an online survey platform and a task-based semi structured interview.
a) Questionnaire design
dissertation is on the behavior patterns of storing information across various devices and applications, the types of information have been categorized into 4 distinct typed based on the ideas acquired by brainstorming with the supervisors.
Figure 3 :Picture showing 4 categories of personal information
Image courtesy by Freerangestock.com and edited by researcher
The questions on the questionnaire were formed to answer the hypothesis. A five-point Likert scale was used as ordinal data .i.e. (i) Strongly agree (ii) Agree (iii) Neutral (iv) Agree (v) Strongly agree[41]. The questionnaire contains a set of 10 questions with open ended responses.
b) Interview design
The Interview was task based and semi-structured. The participants were asked to fill out the same questionnaire before commencing the tasked-based session. At the end of the the questionnaire, participants were provided with a list of projects related to their personal information storage activities. They were then asked to retrieve and access them. The task was given a timeline of 15 minutes and the number of items that the participants were able to retrieve were noted. After the completion of the task followed an open-ended interview to understand the overall experience of the participant while finding these documents and files. Only data related to user experience was recorded on an audio recording device. Participants were allowed to use any device that was available to them which was situational to the location of the study. As the study focuses with certain aspects of behavioral science, the location of the study depended on the daily activities of respective participants being students or employees.
5.4
Participants
Convenience sampling was used for recruiting participants from the online survey. The audience were chosen from survey website and the participants were financially compensated. The age ratio, sex ratio and income ratio of the participants with complete responses have been attached
Types of
Information
NON-FREQUENTLY USED PRIVATE INFORMATION E.g Insurance documents, bank account numbers and statements, old home movies
FREQUENTLY USED PRIVATE INFORMATION E.g Passport number, passport expiry date, social insurance, personal contacts information, health related documents
NON-FREQUENTLY USED PUBLIC INFORMATION E.g User manuals, rules and regulations related to work/academia, scientific journals
in the appendix. The data from this part of the study was collected by respondents that were recruited on Survey Monkey[42].
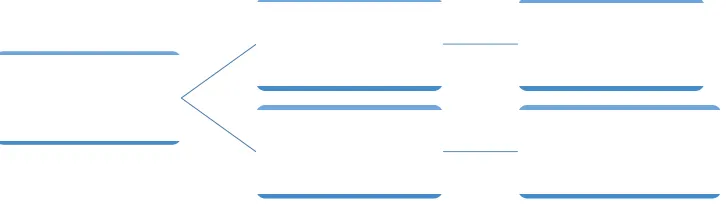
[image:23.612.75.439.218.324.2]Convenience sampling was also used for the participants required for the interviews and email responses from the university. The second part of the study was a task based interview. The participants that took part in the interview were also asked to fill the questionnaire making the total number of respondents to a total of 91.
Figure 4: Horizontal tree diagram of data collection methods.
5.5 Ethics
The participants were chosen on a voluntary basis. The respondents of the interview as well as the questionnaire were provided with a participation information sheet and a consent form and a debriefing form. They were informed about the procedure of the study and risks involved before commencing the study. The data collected from the interviews was stored in an encrypted format using VeraCrypt and the access was provided to the researcher only. The ethics reference number for this research project is CS12314.
5.6 Framework for data analysis
There are 2 approaches to the analysis of the collected data. Both approaches have been analyzed separately and the results come together in the discussion.
a)
Interview + questionnaire
The analysis of the interview data is descriptive. The interviews were audio taped and are being analyzed in an exploratory research format. The concepts have been categorized based on relevance and repetition. The data has been coded based on conceptualization of themes. As the participants also answered the questionnaire, the analysis of the interview will include the codes of the interview results as well as a bar chart with questionnaire answers.
Participants N = 91
Survey Monkey
N = 72 Questionnaire
Interview respondants
N = 19
b)
Survey Questionnaire
The analysis of the survey data is quantitative where we try to answer our research questions by hypothesis testing. As the data from the questionnaire is ordinal and not normally distributed the Wilcoxon sighed rank test has been selected as the primary non-parametric test.
5.7 Hypothesis testing
We used two variations of hypothesis in the following study. The hypothesis testing hasbeen carried out by using SPSS which is a standardized statistics software package.
5.7.1 Related samples:
Overview: The following tests answer to a two-tailed hypothesis to check the median difference between two related samples from data collected from a 5-point Likert scale. If the null hypothesis is rejected, then the alternate hypothesis will be accepted which will mean that the two samples are significantly different.
!"- The median of differences between (Related Sample A) and (Related sample B) equals 0.
!# - The median of differences between (Related Sample A) and (Related sample B) does not equal 0.
Testing criteria:
i. Statistical Test: For the following hypothesis, the non-parametric Wilcoxon signed ranked test has been chosen as it pertains to within subjects i.e. same participants are used under different conditions and the data are ordinal in nature.
ii. Significance level: Let α = .05. Alpha level has been set to the standard level.
iii. Reported statistics: Median, P-value, Z score and effect size.
iv. Rejection criterion: The hypothesis is two-tailed as the direction of the difference is not assumed beforehand. Therefore, if the P – value is found to be less than or equal to the Alpha value (α=.05), the null hypothesis with be rejected thus accepting the alternate hypothesis.
5.7.2 One sample tests:
extremes. We will then be reporting the median to check the direction of the data.
!$- The median of (one sample A) equals 3.00
!#- The median of (one sample B) does not equal 3.00
Testing criteria:
i. Statistical Test: For the following hypothesis, the non-parametric Wilcoxon signed ranked test has been chosen as it pertains to a within subjects i.e. same participants are used under different conditions and the variables are ordinal in nature.
ii. Significance level: Let α = .05. Alpha level has been set to the standard level.
iii. Reported statistics: Median, P-value, Z score and effect size.
iv. Rejection criterion: The hypothesis is two-tailed as the direction of the difference is not assumed beforehand. Therefore, if the P – value is found to be less than or equal to the Alpha value (α=.05), the null hypothesis with be rejected thus accepting the alternate
hypothesis.
5.8 Problems faced and limitations.
1. Schedule constraints: Due the high volume of data being collected, there were several time constraints to the completion of the analysis.
2. Recruiting constraints: The initial sampling size for the interviews was 20. All participants from the interview were asked to fill out the questionnaire before commencing the interview. However, due to technical difficulties a participant did not answer the questionnaire. Therefore, the sample size for the interviews is currently 19.
3. Financial constraints: A larger sample size for the online participant was not chosen due to financial constraints. Also, random random sampling of participants from the questionnaire was not chosen for the following reason.
5.9 Project Plan
Figure 5: Gantt Chart showing a brief plan of action
24/05/16 13/06/16 03/07/16 23/07/16 12/08/16 DISSERTATION PROPOSAL
Draft the research Qs and scope( DOER) Preliminary research Plan resources Address ethical issues and submit the ethics form Manage important refererences LITERATURE REVIEW Preparation phase Find relevant sources Critique the sources Evaluate all sources Update the bibliography Finalise the lit review Make amendments METHODOLOGY Brain storm research methods Filter and select methodology Draft plan of action DATA COLLECTION Create questionnaires and draft the structure for …
6. ANALYSIS: SURVEY QUESTIONNAIRE
The following chapter will contain a detailed analysis of the data collected from the participants of the questionnaire survey. The participants were asked to rate on a 5-point Likert scale on their experiences in finding different types of information and the data is represented in a bar chart format. The main purpose of the analysis is to answer the research questions. The analysis tries to answer the research questions by analyzing the data collected by each question in the survey. In the first part of the survey, we address the research questions
1. How do people treat different types of information? 2. Is data fragmentation causing inconvenience to users?
3. What are the the factors that are influencing individuals to disperse their data across various devices, applications and services?
4. Are there any behavior patterns that are causing these problems? Can change of behavior decrease the degree of the problems associated with data fragmentation?
The process of information storage and retrieval generally involves organizing, storing, maintaining and retrieving information[43]. We look at users’ experiences on accessing and retrieving of frequently used public and private information as well as non-frequently used public and private information. Technologies generally aid in finding information based on the name of the file or format. Along with the capabilities of information systems, it is also important to see how users interact with their data. Cole’s study compared the interaction style of users with ephemeral , action and working data to improve user interaction capabilities of systems[28]
RELATED SAMPLES
6.1 ACCESSIBILITY
Figure 6: Bar chart showing participants responses on accessibility of different types of information.
Description: The grouped bar chart above illustrates the frequency of responses on the convenience of accessing different types of public and private information. From a total of 72 participants, responses of each participant across 4 categories of information type have been graphically represented above.
Comparisons across different types of data
We now compare the accessibility of different types of information to see if people treat them differently by hypothesis testing.
6.1.1 Frequently used private information and frequently used public
information.
i. Decision: Reject !%
used private information and frequently used public information is not equal to zero. This suggests that individuals access frequently used private information differently from frequently used public information (|Z| = 3.510, p < .000, r = 0.29). The descriptive statistics show a median of 3 for frequently used private information and a median of 4 for frequently used public information. From a total of N = 72, positive differences are N = 27 and negative differences are N = 10 with a total of 35 ties. Therefore, we have significant evidence to reject the null hypothesis thus accepting the alternative hypothesis.
[image:29.612.75.485.262.516.2]iii. Reporting:
Figure 7: Chart showing accessibility of Non-frequently used private information with frequently used private information
6.1.2 Non-frequently used public information and frequently used public information.
i. Decision: Reject !%
ii. Wilcoxon signed-ranked test indicates that the median of differences between non-frequently used public information and non-frequently used public information is not equal to zero. This suggests that individuals access non-frequently used public information differently from frequently used public information (|Z| =2.777, p < .005, r = 0.23). The descriptive statistics show a median of 3 for non-frequently used public information and 4 for frequently used public information. From a total of N = 72, the positive differences are N = 20 and negative differences are N = 9 with a total of 43 ties. Therefore, we have significant evidence to reject the null hypothesis thus accepting the alternative hypothesis.
[image:30.612.90.502.392.646.2]iii. Reporting:
Figure 8: Accessibility of non-frequently used public information and frequently used public information
that one can conveniently access non-frequently used public information, only 13 participants disagree and 1 participant strongly disagrees that one can conveniently access frequently used public information conveniently. This suggests that most people feel that they can access frequently used public information easily as compared to non-frequently used public information. Furthermore, while 19 participants agree and 6 participants strongly agree for the former, 31 participants agree and 7 strongly agree for the latter which further confirms the judgment stated above. The neutral responses for non-frequently used public information and frequently used public information are 25 and 19 respectively.
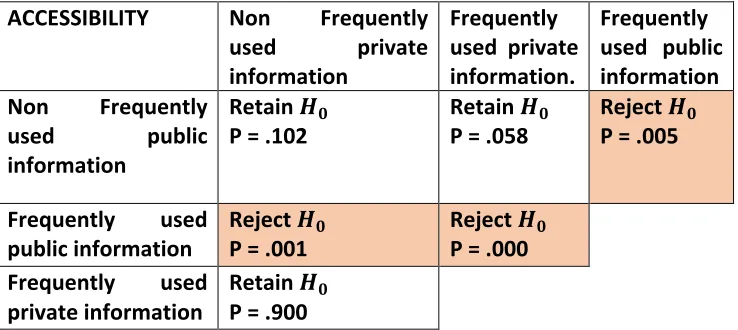
Table 2: Cross table containing 6 groups of information comparisons.
ACCESSIBILITY Non Frequently used private information
Frequently used private information.
Frequently used public information Non Frequently
used public information
Retain !%
P = .102 Retain
!%
P = .058 Reject
!%
P = .005
Frequently used
public information Reject
!%
P = .001 Reject
!% P = .000 Frequently used
private information Retain
!%
P = .900
Description: The table above shows the results of hypothesis tests on different types of information tested against each other.
6.2 RETRIEVAL
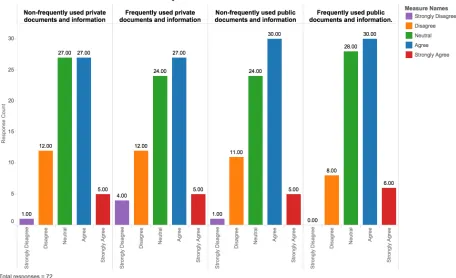
Figure 9: Bar chart showing an overview of the participants views on the quick retrieval of different types of information with their current storage setup.
Description: The grouped bar chart above illustrates the frequency of responses on the quickness of retrieving different types of public and private information. From a total of 72 participants, responses of each participant across 4 categories of information type have been graphically represented above.
Comparisons across different types of data
6.2.1 Frequently used private information and frequently used public
information.
i. Decision: Reject !%
descriptive statistics show a median of 3 for frequently used private information and 3.5 for frequently used public information. From a total of N = 72, the positive differences are N = 13 and negative differences are N = 17 with a total of 42 ties. Therefore, we have significant evidence to reject the null hypothesis thus accepting the alternative hypothesis. However, as seen from the p-value of .045, although we have significant, the effect size is very small and the p-value is very close to the alpha value.
iii. Reporting:
Figure 10:Chart showing retrieval of frequently used private information and frequently used public documents
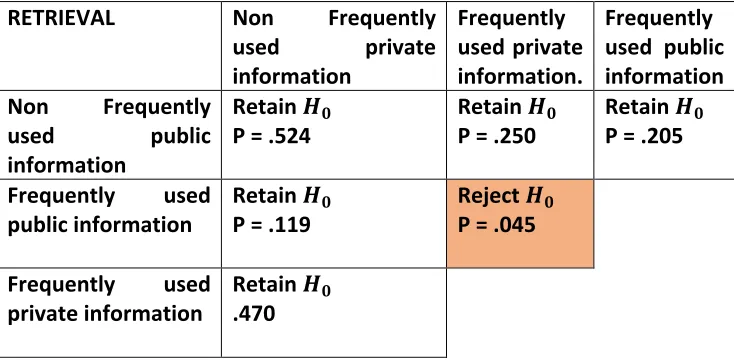
[image:33.612.75.503.274.552.2]Table 3 : Cross table containing 6 groups of information comparisons
Description: The table above shows the results of hypothesis tests on different types of information tested against each other.
6.3 SAFETY AND SECURITY
The following question an analysis of the participants’ experiences with regards to the safety and security of information with their current information storage setup. Here, safety of information refers to loss of data and security of information refers to leak of information to a third party, both could lead to potential embarrassment, humiliation or identity theft. An individual generally makes decisions regarding storage, based on safety and security measures of certain applications or devices.
RETRIEVAL Non Frequently used private information
Frequently used private information.
Frequently used public information Non Frequently
used public information
Retain !%
P = .524 Retain
!%
P = .250 Retain
!%
P = .205
Frequently used
public information Retain
!%
P = .119 Reject
!%
P = .045
Frequently used
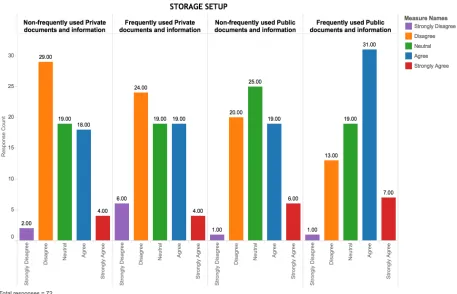
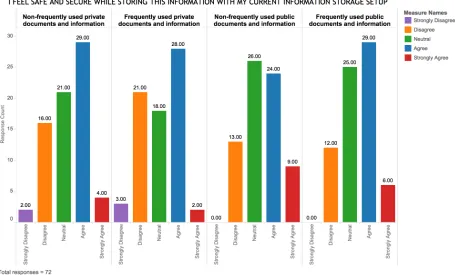
Figure 11: Grouped bar chart showing an overview of the participants views on safety and security of different types of information with their current storage setup.
Description: The grouped bar chart above illustrates the frequency of responses on each participant’s feelings on safety and security while storing different types of public and private information. From a total of 72 participants, responses of each participant across 4 categories of information type have been graphically represented above.
Comparisons across different types of data
6.3.1 Non-frequently used private information and frequently used private
information.
i. Decision: Reject !%
negative differences are N = 13 with a total of 56 ties. Therefore, we have significant evidence to reject the null hypothesis thus accepting the alternative hypothesis.
[image:36.612.74.507.198.459.2]iii. Reporting:
Figure 12: safety and security of non-frequently used private information and frequently used private information.
Description: The Chart above shows the frequency distribution of the responses with regards to safety and security while storing non-frequently used private information and frequently used private information. The frequencies illustrate that, while 16 participants disagree and 2 participants strongly disagree that they that they feel safe about non frequently used private information, 21 participants disagree and 3 participants strongly disagree for frequently used private information. This suggests that most people feel that their non frequently used private information is much safer than their frequently used private information. Furthermore, while 29 participants agree and 4 participants strongly agree for the former, 28 participants agree and 2 strongly agree for the later which further confirms the judgment stated above. The neutral responses for non frequently used private information and frequently used private information are 21 and 18 respectively.
i. Decision: Reject !%
ii. Wilcoxon signed-ranked test indicates that the median of differences between frequently used private information and frequently used public information is not equal to zero. This suggests that individuals do not feel the same level of safety and security with regards to frequently used private information and frequently used public information (|Z| =3.190, p < .001, r = 0.26). The descriptive statistics show a median of 3 for frequently used private information and 3.5 for frequently used public information. From a total of N = 72, the positive differences for N = 19 and negative differences for N = 5 with a total of 48 ties. Therefore, we have significant evidence to reject the null hypothesis thus accepting the alternative hypothesis.
[image:37.612.75.435.337.602.2]iii. Reporting:
Figure 13: safety and security of frequently used private information and frequently used public information
their frequently used private information. Furthermore, while 28 participants agree and 2 participants strongly agree for the former, 29 participants agree and 9 strongly agree for the latter which further confirms the judgment stated above. The neutral responses for frequently used private information and frequently used public information are 18 and 25 respectively Table 4 : Cross table containing 6 groups of information comparisons
SAFETY AND
SECURITY Non Frequently used private information
Frequently used
private information. Frequently used public information
Non Frequently used public information
Retain !%
P = .094 Reject
!%
P = .002 Retain
!%
1.000
Frequently used
public information Reject
!%
P = .046 Reject
!%
P = .001 Frequently used
private information
Reject !% P = .029
Description: The table above shows the results of hypothesis tests on different types of information tested against each other.
ONE SAMPLE TESTS
The following tests answer to a two tailed hypothesis to check if the median is 3 (neutral responses). If the null hypothesis is rejected, then the alternate hypothesis will be accepted and which will mean that the the median falls on either end of the Likert scale.
6.4 ACCESSIBILITY
d) The Wilcoxon signed-ranked test indicates that the median of frequently used public data
Table 5: Table showing the frequencies and percentage frequencies of information for accessibility.
Decision : Retain !% Decision : Retain !%
Decision : Retain !% Decision : Reject !%
Justification: The chart above illustrates the frequencies and percent frequencies of responses for quick retrieval of different types of information. We only have significant evidence to reject the null hypothesis for accessibility of frequently used public documents.
6.4.1 I find that documents stored in different formats are inaccessible by
different devices
i. Decision: Reject !%
ii. The Wilcoxon signed-ranked test indicates that the median does not equal to 3 (neutral). This proves that the results are directed towards either ends of the Likert scale.
Figure 14: Horizontal Bar chart showing participants views on file format causing information to be inaccessible.
6.5 RETRIEVAL
a) The Wilcoxon signed-ranked test indicates that the median of non-frequently used private data, median of non-frequently used public data and median of frequently used public data do not equal to 3 (neutral). This proves that the results are directed towards either ends of the Likert scale.
For non-frequently used private data, the observed median is 3 and hypothesized median is also 3 (|Z| = 2.891, p < .004, r = 0.24).
For non-frequently used public data, the observed median is 3 and hypothesized median is also 3 (|Z| = 2.333, p < .001, r = 0.19).
For frequently used public data, the observed median is 3.50 and hypothesized median is also 3 (|Z| = 4.307, p < .000, r = 0.35).
[image:41.612.72.510.314.680.2]Therefore, we have significant evidence to reject the null hypothesis thus accepting the alternative hypothesis.
Table 6: table showing frequencies and percentage frequencies of participants responses on retrieval
Decision : Reject !% Decision : Retain !%
Decision : Reject !% Decision : Reject !%
quick retrieval of different types of information. We only have significant evidence to reject the null hypothesis for retrieval of non-frequently used private documents, frequently used public documents and non-frequently used public documents.
6.5.1 I sometimes have multiple copies of the same information in different
storage locations
i. Decision: Reject !%
[image:42.612.81.419.360.625.2]ii. The Wilcoxon signed-ranked test indicates that the median of the study result is not 3 which stands for neutral responses. This proves that the results are directed towards either ends of the Likert scale. The observed median is 4 (Agree) and hypothesized median is 3 (Neutral) (Z = 4.873, p < .000, r =.40). Therefore, we have significant evidence to reject the null hypothesis thus accepting the alternative hypothesis.
Figure 15: chart showing the frequencies and percentage frequencies of responses about multiple copies of data
6.6 SAFETY AND SECURITY:
a) The Wilcoxon signed-ranked test indicates that the median of non-frequently used private data, median of non-frequently used public data and median of frequently used public data
do not equal to 3 (neutral). This proves that the results are directed towards either ends of the Likert scale.
For non-frequently used private data, the observed median is 3 and hypothesized median is also 3 (Z = 2.034, p < .042, r = 0.16)
For non-frequently used public data, the observed median is 3.50 and hypothesized median is also 3 (Z = 3.433, p < .001, r = 0.28).
For frequently used public data, the observed median is 3.50 and hypothesized median is also 3 (Z = 3.605, p < .000, r = 0.30).
[image:43.612.74.542.316.706.2]Therefore, we have significant evidence to reject the null hypothesis thus accepting the alternative hypothesis.
Table 7: table showing frequencies and percentage frequencies of participants responses on safety and security
Decision : Reject !% Decision: Retain
!%
Justification: The chart above illustrates the frequency and percent frequencies of responses for safety and security of different types of information. We have significant evidence to reject the null hypothesis for safety and security of all documents.
6.6.1 It would be troubling and/or cause me distress if my data suddenly
becomes available
i. Decision: Reject !%
ii. The Wilcoxon signed-ranked test indicates that the median does not equal to 3 (neutral) This proves that the results are directed towards either ends of the Likert scale. The observed median is 4.50 (Agree – Strongly agree) and hypothesized median is 3 (Z = 6.537, p < .000, r = 0.54). Therefore, we have significant evidence to reject the null hypothesis thus accepting the alternative hypothesis.
[image:44.612.79.419.364.626.2]iii. Reporting:
Figure 16:Bar chart showing participants views on distress caused by loss or leak of data.
Additional factors:
6.6.2 Storing data is expensive
i. Decision: Retain !%
[image:45.612.98.427.304.558.2]ii. The Wilcoxon signed-ranked test indicates that the median of the study result is 3 which stands for neutral. This proves that the results are not directed towards either ends of the Likert scale. The observed median is 3 and hypothesized median is also 3 (Z = .588, p < .556, r = 0.04). Therefore, we have insignificant evidence to reject the null hypothesis.
Figure 17:Bar chart showing the participants views on expenses of storing data.
6.6.3 My data is fragmented/spread over too many different services and/or
devices
i. Decision: Reject !%
ii. The Wilcoxon signed-ranked test indicates that the median of the study result is 3 which stands for neutral. This proves that the results are directed towards either ends of the Likert scale. The observed median is 4.50 (Agree – Strongly agree) and hypothesized median is 3 (Z = 2.030, p < .042, r =.16). Therefore, we have significant evidence to reject the null hypothesis thus accepting the alternative hypothesis.
Figure 18: bar chart for participants views on data fragmentation
6.6.4. Usage of multiple methods
Figure 19: stalked bar showing the usage of different storage devices and services
Description: The chart above illustrates the multiple methods of storage used by participants and the level of usage. Each participant chooses one category for each type of storage method. The most commonly used storage service that is part of all user’s routine is storing information on a local drive followed by email, paper copies, cloud storage, cloud applications, storage provided by the institution and lastly back up storage.
With regards to back up storage, cloud applications and storage provided by the institution most participants said that they never used this method.
With regards to cloud storage, emails and paper documents, most participants said that they occasionally used them.
7. ANALYSIS: INTERVIEWS
OVERVIEW
This will be a descriptive analysis of data collected from the task-based semi-structured interviews. The participants were asked to retrieve 20 different types of information documents. The number of items retrieved in 15 minutes were recorded. The type of information that they were asked to retrieve ranged from frequently used and non-frequently used private and public documents and information. During the task, participants were required them to use any device or application that were available to them to find different types of information. As the research is relating to everyday behavioral sciences of the participants, the location of the study was decided by the participant based on their convenience.
[image:48.612.72.541.310.718.2]7.1 How many information items did they find?
Table 8: Number of items retrieved by the participants in 15 minutes
ID CURRENT
OCCUPATION STUDY/WORK FIELD OF AGE DEVICES USED NUMBER OF DOCUMENT
S RETRIEVED
1 Senior
Lecturer Computer science 50 to 59 Work computer Phone 13
2 Secretary Data
Administration 50 to 59 work computer 10
3 Senior
Academic Liaison
Library & Information
Science
50 to 59 Work computer 11
4 Secretary Data
Administration 40 to 49 Work computer 12
5 Senior
Manager Librarianship 40 to 49 Work computer Phone 11 6 Repository
Support Officer
Library & Information
Science 40 to 49
work computer 13
7 Lecturer Software
Engineering 40 to 49 Work computer 15
8 Lecturer Software
9 Msc student School of English 18 to 29 Personal computer 15
10 Msc student Psychology 18 to 29 Work computer
Mobile Phone 9
11 MSc student Computing and IT 18 to 29 Lab computer Mobile phone
5
12 MSc student Management and
IT 18 to 29 Personal computer phone 17
13 MSc Student Computer
Science 18 to 29 Personal computer phone 15
14 MSc student IT 18 to 29 Personal computer
Mobile phone 12
15 MSc student Software
Engineering 18 to 29 Personal computer 13
16 MSc student Advanced
Computer Science.
18 to 29 Personal computer
Phone 14
17 MSc student Management & IT 18 to 29 Personal computer
Phone 14
18 MSc student Marketing 18 to 29 Personal computer
phone 18
19 MSc Student Law, Computing
and IT 18 to 29 Personal computer Phone 17