A STUDY ON FINANCIAL
1
Nayana,
1
Assistant Professor, Acharya Bangalore
2Associate Professor, Department of Master
Mysore
ARTICLE INFO ABSTRACT
The Global stagnation to grow SBI group The RBI and advances, particularly profitability profitability time to attempt are to study data collection period
Copyright © 2018, Nayana and Veena. This is an open use, distribution, and reproduction in any medium, provided
INTRODUCTION
The banking sector is the life blood of any modern is one of the important financial basements
sector, which plays a vital role in the functioning economy. It is very important for economic
country that it’s financing requirements of trade, agriculture are met with higher degree of responsibility. The Indian banking sector is into scheduled banks and non-scheduled banks. banks are those included under the 2nd Reserve Bank of India Act, 1934. The scheduled further classified into: nationalized banks; State and its associates; Regional Rural Banks - foreign other Indian private sector banks. The term refers to both scheduled and non-scheduled regulated under the Banking Regulation integrally linked in banking industry in gradually They role of mobilization of deposits and credit to various sector of banking industry. reflect health of the country.
*Corresponding author: Nayana, N.,
Assistant Professor, Acharya Bangalore B-School Andrahalli Magadi Road, Bengaluru - 560 091.
ISSN: 0975-833X
Article History:
Received 19th February, 2018
Received in revised form 05th March, 2018 Accepted 10th April, 2018
Published online 23rd May, 2018
Citation: Nayana, N. and Dr. Veena, K.P. 2018. “A (05), 69288-69292.
Key words:
Deposit, Advances, Net Profit, Borrowing, Investment.
RESEARCH ARTICLE
FINANCIAL PERFORMANCE OF STATE BANK OF
Nayana, N. and
2Dr. Veena, K.P.
Bangalore B-School Andrahalli Main Road, Off Magadi
Master of Business Administration, Visvesvaraya
Mysore Regional Centre, Mysore - 570 019
ABSTRACT
Global growth continued to remain sluggish in every year. Weaken stagnation in growth dynamics. According to the latest IMF projections,
grow at 3.2% in 2016 and pick up to 3.5% in 2017. There is growing group on the declining profitability of the banking system due RBI pressures on banks profitability and suggest various methods
advances, with changes in the social and economic objec particularly of SBI group. It becomes extremely over and finds profitability in the value of current banking philosophy. The approach profitability has changed, with the result that low profits have become
to concentrate on analysis of the profitability performance. attempt has been made to analyze the profitability performance of
study the profitability position of SBI and to analyze the profitability collection of the paper is primarily based on secondary data with
from 2003-04 to 2015-16.
open access article distributed under the Creative Commons Attribution provided the original work is properly cited.
modern economy. It basements of the financial functioning of an development of a trade, industry and of commitment and broadly classified banks. The scheduled Schedule of the scheduled banks are State Bank of India foreign banks and commercial banks commercial banks Act, 1949.Thus, gradually increasing. and disbursement of industry. This will also
Andrahalli Main Road, Off
The efficiency of financial system sound banking system efficiently productive sector and solvent sy meet the depositor obligation. crucial role in socio-economic independence. It is dominant in than half the assets of financial
State Bank of India: State Bank multinational, public sector banking company. It is a government headquarters in Mumbai, Maharashtra assets of 20.480 trillion (US$300 14,000 branches, including 191 36 countries, making it the services company in India by 232nd on the Fortune Global corporations as of 2016. responsible for the preparation that give a true and fair view of performance and cash flows of the requirements of the Reserve of the Banking Regulation Act, Act, 1955 and recognized accounting including the Accounting Standards
International Journal of Current Research
Vol. 10, Issue, 05, pp.69288-69292, May, 2018
A study on financial performance of state bank of India”, International
OF INDIA
Magadi Road, Bengaluru - 560 091
Visvesvaraya Technological University,
Weaken business environment near projections, the world economy is poised growing evidence of concern by the due to unsecured loans and advances. methods to reduce the unsecured loans objective of Indian commercial banks finds remedial measures to reduce the approach of policy makers towards become a fact of life. Therefore, it is a performance. Hence, in the present paper an of SBI. The objectives of the paper profitability performance of SBI. The with various data tool using R for the
ribution License, which permits unrestricted
system is strength of economy. A efficiently mobilized saving in system ensures the capabilities to obligation. The banking sector is playing economic progress of the country after in India as it accounts for more
sector.
Bank of India (SBI) is an Indian banking and financial services government-owned corporation with its Maharashtra. As of 2014-15, it had (US$300 billion) and more than 191 foreign offices spread across largest banking and financial assets. The company is ranked 500 list of the world's biggest The Bank’s management is preparation of these financial statements of the financial position, financial of the Bank in accordance with Reserve Bank of India, the provisions Act, 1949, the State Bank of India accounting policies and practices, Standards issued by the Institute of INTERNATIONAL JOURNAL OF CURRENT RESEARCH
Chartered Accountants of India (ICAI). This responsibility of the management includes the design, implementation and maintenance of internal controls and risk management systems relevant to the preparation of the financial statements that are free from material misstatement, whether due to fraud or error. In making those risk assessments, the management has implemented such internal controls that are relevant to the preparation of the financial statements and designed procedures that are appropriate in the circumstances so that the internal control with regard to all the activities of the Bank is effective.
Objectives of the Study
To study the financial performance of State Bank of India and ICICI Bank.
To know the profitability position of State Bank of India
To study the managerial efficiency of State Bank of India.
To offer findings and suggestions to enhance the financial performance of State Bank of India
Scope of the Study: The research paper will also help to understand the financial performance SBI. This study will throw light on the different aspects where the State Bank of India stand out and how the banks will provide an opportunity in corresponding its activities to achieve the best performance.
RESEARCH METHODOLOGY
The study has been conducted with reference to the data related to SBI. The study examines the financial performance of some variables and compares the performance of SBI for the period of 2003-04 to 2015-16. A. The study is an exploratory and analytical in nature with an attempt to explore the financial performance of SBI.
Source of Data Collection: The Data collection is secondary source was used in the form of reports through internet.
Tools for Data Collection: The data required for the study will be collected from
Annual reports of respective banks
Journals and reports on trends
Progress of Banking of India
Books and websites
Tools for Data Analysis: The data tool using R
Mean, Standard Deviation, Covariance, P-value Df
Hypothesis
Lower Correlation
Sampling Variables: To apply Regression technique with following variables are required
Independent variable are Deposits, Borrowings, Investments, Advances, Return on Average Assets(%),Return on Equity(%),Dividend Payout Ratio(%),Net NPA to Net Advances
Dependent variables are Net Profit
Abhay Jaiswal and Chanchala Jain (2016), A Comparative Study of Financial Performance of SBI and ICICI, The study is an attempt to analyze the financial performance of SBI and ICICI banks. The State Bank of India, popularly known as SBI is one of the leading bank of public sector in India. SBI has 14 Local Head Offices and 57 Zonal Offices located at important cities throughout the country. ICICI bank is the second largest, leading bank of private sector in India The Bank has 2,533 branches and 6,800 ATMs in India. The study is descriptive and analytical in nature. The collected data was secondary in nature and collected from various reports issued by these banks through internet. The comparison of financial performance of these two banks was made on the basis of ratio analysis. The results indicated that the SBI is performing well and financially sound than ICICI Bank. Also the market position of SBI is better than ICICI in terms to earning per share, price ratio per share and dividend payout ratio, but on the other hand ICICI bank is performing well in terms of NPA and provision for NPA in comparison of SBI bank.
Dr. Guruswamy, (2012), describe analysis of profitability Performnce of SBI and ITS Associates, the paper an attempt has been made to analyze the profitability performance of SBI and its associates. The objectives of the paper are to study the profitability of SBI and Its Associates and to analyze the profitability performance of SBI and Its Associates. This paper is primarily based on secondary data. In order to derive the open handed results from the information collected through secondary data, various statistical tools like mean, S.D, variance, CAGR, and ANOVA have been accomplished. The scope of the paper is confined to all the banks of SBI group for a data period from 1996-97 to 2007-08. In the present paper, for the purpose of evaluating the performance of SBI and its associates, five profitability ratios have been considered. On the basis of analysis of profitability ratios it is printout that all the five ratios shows fluctuating trend during the study period in all the banks.
Dr. Kingshuk Adhikari, Nitashree Barman, Pinkumoni Kashyap(2014), study on Profitability of State Bank of India: An Analysis-The paper attempts to analyze the profitability of State bank of India for the period of seven years. Apart from studying the trend of different components of both income and expenditure, performance of the bank has been analysed with the parameters like OPTWF, ROA, ROE, ROI and EPS. There is a significant difference not only between the components of income but also across the components of expenditure. The paper concludes that the profitability performance of the SBI is not consistent during the study period. The bank should focus more on diversification of income and should also curtail operating expenses in order to improve profitability performance.
performance, eleven financial ratios have been used. These ratios further have been categorized into two categories viz. liquidity and profitability. The period of study cover the years 2005-06 to 2011-12. From the results, it has been found that during the study period the liquidity and profitability position of public sector bank group declined while it has improved in other two groups.
Dr. V.N. Sailaja* Dr.N. Bindu Madhavi (2015), emphasis study on comparison of capital structure of public sector banks and private sector banks and its effect on bank’s profitability- the capital structure and profitability was analyzed by too many researchers in academic level. However, most of them excluded banking industry due to different market structure and regulatory frameworks. The differential point of banking industry with other financial industries is minimum capital requirement that is 8% of equity capital. This requirement is for coverage of the bank's risk associated assets. Research is aiming to analyze the relationship between capital structure of the public and private sector banks and its profitability. The aim of the paper -To know the portion of debt and equity in capital structure of selected banks, To find out the Weighted Average Cost of Capital (WACC) of selected banks, To conduct comparative study regarding capital structure of selected banks, To examine the effect of capital structure on bank’s profitability. Sample size is 3 private banks and 3 public banks based on the convenience sampling technique which is one of the methods in non-probability sampling methods. The paper concludes that sector banks is high as compared to the private sector banks which can be overburden to the banks to pay high amount of interest out of the profits.
Ms. Shikha Gupta (2014), An empirical study of financial performance of icici bank- a comparative analysis,-The Bank works closely with ICICI Foundation across diverse sectors and programs. As of 2014 it is the second largest bank in India in terms of assets and market capitalization. ICICI bank emerged as a pioneer venture on the horizon of offering an expanded range of banking products and financial services for corporate and retail customers through its diverse delivery channels and specialized subsidiaries in the areas of investment banking, asset management, venture capital and insurance. In the light of its strategic importance in the nation interest, it is crucial to evaluate the financial performance of the ICICI Bank. And the present study focused on operational control, profitability and solvency etc. This research paper is aimed to analyze and compare the Financial Performance of ICICI Bank and offer suggestions for the improvement of efficiency in the bank.
Loriya Chirag, Thakarshibhai (2014), study on A Profitability Analysis of Banks in India- banks include commercial banks and the co-operative banks. This study attempts to measure the relative profitability of Indian banks. For this study, we have used public sector banks and private sector banks. It is very essential to analyze how their profitability is influenced by number of factors which will further suggest them where they need to concentrate more. In this article we have analyzed of mean, standard deviation and ANOVA test have been used. The paper concludes Profitability is the primary motivating force for any economic activity. Business enterprise is essentially being an economic organization; it has to maximize the welfare or the investment of its stakeholders. To this end, the business
Undertaking has to earn profit from operations. Profitability acts as a yardstick to measure the effectiveness and efficiency of business effort for the growth and success of any business entities.
Brindadevi (2013), A Study on Profitability Analysis of Private Sector Banks In India- The objective of this study was overall profitability analysis of different private sectors banks in India based on the performances of profitability ratios like interest spread, net profit margin, return on long term fund, return on net worth & return on asset. Profitability is a measure of efficiency and control it indicates the efficiency or effectiveness with which the operations of the business are carried on. Recording profitability for the past period or projecting profitability for the coming period, measuring profitability is the most important measure of the success of the business. A business that is not profitable cannot survive. Conversely, a business that is highly profitable has the ability to reward its owners with a large return on their investment. Increasing profitability is one of the most important tasks of the business managers. Managers constantly look for ways to change the business to improve profitability. These potential changes can be analyzed with a support of income statement and balance sheet.
Data Analysis and Interpretation
Table 1. Shows the Regression Statistics
Regression Statistics
Multiple R 0.992
R Square 0.985
Adjusted R Square 0.954
Standard Error 749.56
[image:3.595.307.560.464.599.2]F 32.42
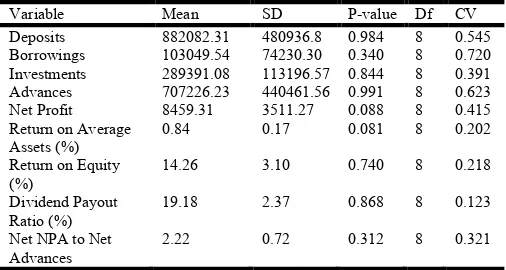
Table 2. Performance indicators of SBI
Variable Mean SD P-value Df CV
Deposits 882082.31 480936.8 0.984 8 0.545
Borrowings 103049.54 74230.30 0.340 8 0.720
Investments 289391.08 113196.57 0.844 8 0.391
Advances 707226.23 440461.56 0.991 8 0.623
Net Profit 8459.31 3511.27 0.088 8 0.415
Return on Average Assets (%)
0.84 0.17 0.081 8 0.202
Return on Equity (%)
14.26 3.10 0.740 8 0.218
Dividend Payout Ratio (%)
19.18 2.37 0.868 8 0.123
Net NPA to Net Advances
2.22 0.72 0.312 8 0.321
Table value =0.0023 at 5%level of Significance
Hypothesis Testing
H01: There is no significant difference of performance of SBI in terms of Deposits.
H02: There is no significant difference between performances of SBI in terms of Borrowing.
H03: There is no significant difference between performances of SBI in terms of Investment.
H04: There is no significant difference between performances of SBI in terms of Advances.
H05: There is no significant difference between performances of SBI in terms of Net Profit.
H06: There is no significant difference between performances of SBI in terms of ROA.
H08: There is no significant difference between performances of SBI in terms of DPR.
H09: There is no significant difference between performance of SBI in terms of Net NPA to Net Advances.
Table1 shows a regression statistics which shows relationship of the variable which shows positively held between dependent and independent variable. Multiple R is 99.23 which near to 100 and with 5% confidence level. And R square is 98.48. F is 32.41. Table 2 shows the performance indicator of SBI -Deposits: the calculated value of covariance is 0.545 is greater than the table value 0.0023. Therefore, H01 is rejected. P-value is 0.984 Hence, it is indirect that there is a significant difference between the performance of SBI Deposit. Borrowings: the calculated value of covariance is 0.720 is greater than the table value 0.0023. Therefore, H02 is rejected. P-value is 0.340. Hence, it is indirect that there is a significant difference between the performance of SBI Borrowings.
Investment: the calculated value of covariance is 0.391 is greater than the table value 0.0023. Therefore, H03 is rejected. P-value is 0.844 hence, it is indirect that there is a significant difference between the performance of SBI Investment.
Advances: the calculated value of covariance is 0.623 is greater than the table value 0.0023. Therefore, H04 is rejected. P-value is 0.991. Hence, it is indirect that there is a significant difference between the performances of SBI Advances.
Net Profit: the calculated value of covariance is 0.415 is greater than the table value 0.0023. Therefore, H05 is rejected. P-value is 0.0881. Hence, it is indirect that there is a significant difference between the performances of SBI Net Profit.
ROA: the calculated value of covariance is 0.202 is greater than the table value 0.0023. Therefore, H06 is rejected. P-value is 0.081. Hence, it is indirect that there is a significant difference between the performances of SBI ROA.
ROE: the calculated value of covariance is 0.218 is greater than the table value 0.0023. Therefore, H07 is rejected. P-value is 0.740. Hence, it is indirect that there is a significant difference between the performances of SBI ROE.
DPR: the calculated value of covariance is 0.123 is greater than the table value 0.0023. Therefore, H08 is rejected. P-value is 0.868. Hence, it is indirect that there is a significant difference between the performances of SBI DPR.
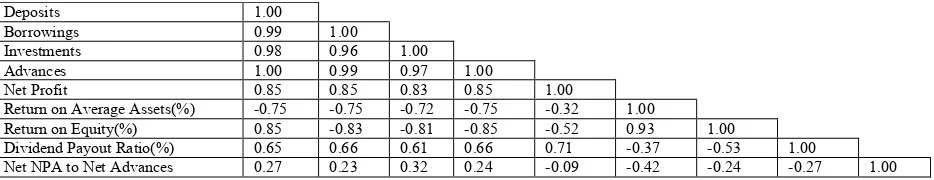
Net NPA to Net Advances: the calculated value of covariance is 0.321 is greater than the table value 0.0023. Therefore, H09 is rejected. P-value is 0.321. Hence, it is indirect that there is a significant difference between the performances of SBI Net NPA to Net Advances. Table 3 To interpret correlations coefficients Deposits with Borrowings, Investment, Advances closer the correlation is to 1.0, the stronger the relationship
between the each other variables. A correlation of 0.0 indicates the absence of a relationship. The correlation coefficient of ROE with Borrowings, Advances is –0.80, which indicates the presence of a strong relationship. A positive correlation coefficient means that as variable 1 increases, variable 2 increases, and conversely, as variable 1 decreases, variable 2 decreases. In other words, the variables move in the same direction when there is a positive correlation. A negative correlation means that as variable 1 increases, variable 2 decreases and vice versa. In other words, the variables move in opposite directions when there is a negative correlation. The negative sign indicates that as class size increases, mean reading scores decrease.
FINDINGS
Return on average is 0.94 in 2003-04 gradually started decreasing in 2005-06, in the year 2007-09 it has reached 1.00 and there is a fluctuation in ever year.
Initially the Return on equity is 18.12 then it started fluctuating in coming years at the end 2015-16it is 7.74.
In the year 2003-04 the Dividend payout ratio is 15.72 and increasing in the coming year and reached 20.28 in 2015-16.
Net NPA to Net Advances initially it is more 3.48 and decreased in 2006-07 i.e., 1.56 then it has reached to 3.81.
Regression statistics which shows relationship of the variable which shows positively held between dependent and independent variable.
Multiple R is 99.23 which near to 100 and with 5% confidence level. And R square is 98.48. F is 32.41
The performance indicator of SBI -Deposits: the calculated value of covariance is 0.545 is greater than the table value 0.0023. Therefore, H01 is rejected. P-value is 0.984 hence; it is indirect that there is a significant difference between the performances of SBI Deposit.
Borrowings: the calculated value of covariance is 0.720 is greater than the table value 0.0023. Therefore, H02 is rejected. P-value is 0.340. Hence, it is indirect that there is a significant difference between the performances of SBI Borrowings.
Investment: the calculated value of covariance is 0.391 is greater than the table value 0.0023. Therefore, H03 is rejected. P-value is 0.844 hence; it is indirect that there is a significant difference between the performances of SBI Investment.
[image:4.595.65.532.291.381.2] Advances: the calculated value of covariance is 0.623 is greater than the table value 0.0023. Therefore, H04 is rejected. P-value is 0.991. Hence, it is indirect that there is a significant difference between the performances of SBI Advances.
Table 3. Shows Lower Correlation of Variables
Deposits 1.00
Borrowings 0.99 1.00
Investments 0.98 0.96 1.00
Advances 1.00 0.99 0.97 1.00
Net Profit 0.85 0.85 0.83 0.85 1.00
Return on Average Assets(%) -0.75 -0.75 -0.72 -0.75 -0.32 1.00
Return on Equity(%) 0.85 -0.83 -0.81 -0.85 -0.52 0.93 1.00
Dividend Payout Ratio(%) 0.65 0.66 0.61 0.66 0.71 -0.37 -0.53 1.00
Net Profit: the calculated value of covariance is 0.415 is greater than the table value 0.0023. Therefore, H05 is rejected. P-value is 0.0881. Hence, it is indirect that there is a significant difference between the performances of SBI Net Profit.
Suggestions
Decline in profitability of the banking system due to unsecured loans and advances.
The performance will indirectly affect the profitability of SBI.
Proper control over leverage should be taken in order to magnify DP ratio.
The DER is quite high viz. worrisome, as it indicates a precarious amount of leverage.
There should be a steady stream of sustainable dividends from a company, the dividend payout ratio analysis is important.
A consistent trend in this ratio is usually more important than a high or low ratio. Bank has fallen a percentage each year for the last five years might indicate that the company can no longer afford to pay such high dividends. This could be an indication of poor operating performance.
Conclusions
The banking sector is very important for the economic development of a country. The SBI is one of the leading bank of Public sector Bank in India. The market position of SBI is better. The analysis reveals that there is no significant difference between Deposits, Investment, Advances, Borrowing, Net Profit etc., there is growing evidence of concern by the SBI group on the declining profitability of the banking system due to unsecured loans and advances. It has becomes extremely over and finds remedial measures to reduce the profitability in the value of new banking philosophy. Hence, in the present paper of the study an attempt has been made to analyze the financial performance of SBI.
REFERENCE
Abhay Jaiswal*, Chanchala Jain A Comparative Study of Financial Performance of SBI and ICICI, Volume-4, Issue-3 E-ISSN: 2Issue-320-76Issue-39, 2016, IJSRCSE Volume 6, Issue 12, June 2014
Brindadevi .V, A Study on Profitability Analysis of Private Sector Banks In India, IOSR Journal of Business and
Management (IOSR-JBM) e-ISSN: 2278-487X, p-ISSN:
2319-7668. Volume 13, Issue 4 (Sep. - Oct. 2013), PP 45-50
Dr. Kingshuk Adhikari, Nitashree Barman, Pinkumoni Kashyap Profitability of State Bank of India: An Analysis, Pacific Business Review International
Dr. V.N. Sailaja* Dr.N. Bindu Madhavi, Comparison of capital structure of public sector banks and private sector banks and its effect on bank’s profitability, IJMSRR, E- ISSN - 2349-6746, ISSN -2349-6738, Vol.1, Issue.11, May-2015 Dr.D. Guruswamy, Analysis of profitability performnce of sbi
and its associates, Vol.2 Issue 1, January 2012, ISSN 2249 8826, ZENITH International Journal of Business Economics & Management Research
Loriya Chirag, Thakarshibhai, A Profitability Analysis of Banks in India, Volume: 3, Issue: 12, Dec 2014, ISSN - 2250-1991
Ms. Shikha Gupta, An empirical study of financial performance of icici bank- a comparative analysis, IITM Journal of Business Studies (JBS) Vol. 1, Issue 1, 2014 Urmila Bharti, Surender Singh, Liquidity and Profitability
Analysis of Commercial Banks in India – A Comparative Study, Vol 6, Issue 4, October-December 2014, www.gjeis.org, GJEIS | Print ISSN: 0975-153X | Online ISSN: 0975-1432