ISSN Online: 2331-2017 ISSN Print: 2331-1991
DOI: 10.4236/ae.2019.74008 Sep. 20, 2019 92 Advances in Entomology
Relationship between Macroinvertebrates and
Physico-Chemical Parameters to Access Water
Quality of the Affon River in Bénin
Fadéby Modeste Gouissi
*, Olakonlé Samon, Koudjodé Simon Abahi, David Darius Adje,
Christelle Madina Tchaou, Zoulkanerou Orou Piami, Jeff Gildas Antoine Okoya,
Midogbo Pierre Gnohossou
Department of Management of Natural Resources (AGRN), Water and Soil Engineering, Laboratory of Ecology, Health and Animal Production (LESPA), Faculty of Agronomy (FA), University of Parakou (UP), Parakou, Bénin
Abstract
The Affon River is one of the important rivers of the Ouémé River whose benthic diversity remained unknown. The present study aims to make the re-lationship between macroinvertebrates and physico-chemical parameters to access water quality of the Affon River. The measurement of physico-chemical parameters (temperature, pH, conductivity, transparency, depth and TDS, dissolved oxygen, ammonium, nitrite and phosphate) and the sampling of macroinvertebrates using a Surber net were carried out during floods in eight stations. A principal component analysis (PCA) and canonical correspon-dence analysis (CCA) were used. The indices of Shannon, Piélou, Simpson, Hilsenhoff, EPT and EPT/Chironomidae were used to assess the level of wa-ter pollution. The study identified 9755 macroinvertebrates divided into 4 classes, 14 orders and 49 families. Pollution-sensitive families (14 families) that are organic pollution indicators, as well as pollution-tolerant families (Chironomidae, Limnaeidae, Bithynidae, Physidae) were captured. Chirono-midae were the most predominant and abundant family (FO = 100%). The predominance of Chironomidae coupled with the rarity of the Ephemeropte-ra, Trichoptera and Plecoptera would reflect the poor quality of the Affon River waters. The principal components analysis yielded groups of associa-tions: The first group of stations Taneka 2 and 3 characterized by high values of ammonium and phosphate; and low values of conductivity and TDS; the second group of Tanéka 1 and Kolokondé 1 stations with low values of pH, transparency, ammonium and phosphates; and the third group of stations Kolokondé 2, Kpébouko1, Kpébouko 2 and Affon marked by high values of conductivity, TDS, transparency, depth and temperature. The canonical cor-respondence analysis revealed a strong positive correlation between Nemou-How to cite this paper: Gouissi, F.M.,
Samon, O., Abahi, K.S., Adje, D.D., Tchaou, C.M., Orou Piami, Z., Okoya, J.G.A. and Gnohossou, M.P. (2019) Relationship between Macroinvertebrates and Physico-Chemical Parameters to Access Water Quality of the Affon River in Bénin. Advances in Ento-mology, 7, 92-104.
https://doi.org/10.4236/ae.2019.74008
Received: August 23, 2019 Accepted: September 17, 2019 Published: September 20, 2019
Copyright © 2019 by author(s) and Scientific Research Publishing Inc. This work is licensed under the Creative Commons Attribution International License (CC BY 4.0).
DOI: 10.4236/ae.2019.74008 93 Advances in Entomology ridae and ammonium as well as between Perlidae, Taeniopterygidae, Ephe-meridae, Heptageniidae, Isonychiidae, Elmidae and phosphate. This study is a crucial step for any management and monitoring of this river.
Keywords
Macroinvertebrates, Diversity, Biotic Indices, Environmental Variables, Water Quality, Affon River
1. Introduction
Agricultural intensification is the major cause of degradation of aquatic ecosys-tems in rural areas [1]. The increase in production and yield requires the use of synthetic chemicals such as mineral fertilizers for soil and pesticide fertilization for weed control and phytosanitary treatment of plants. These agricultural activ-ities on watersheds have serious ecological implications for rivers [2]. After their use, these pesticides and agricultural inputs are dispersed in different compart-ments of the environment. More than 99% of these pesticides are used in eco-systems to pollute water, land and air [3]. Pesticide damage is heavy for water resources, for aquatic populations in general. Because they degrade populations, cause poisoning, induce biocenotic disturbances and even sometimes lead to the extinction of biodiversity [3]. Among this biodiversity, the fauna that should be highlighted is the group of macroinvertebrates because they are excellent indi-cators of human impacts especially contamination [4]. These benthic macroin-vertebrates are easy to sample, abundant and sedentary in all streams [5]. Unlike chemical analyzes, benthic macroinvertebrates can detect disturbances that oc-cur even if they are no longer present at the time of sampling [6]. This makes them good witnesses to local conditions [7]. Hence these are used as bioindica-tors in many studies evaluating the biological quality of aquatic ecosystems. While the use of any biological community in conservation systems and/or wa-ter monitoring requires the characwa-terization of its diversity and its structure [8]. Indeed, in Benin, some studies have been devoted to macroinvertebrates in riv-ers such as: Alibori [9] [10]; Oueme [11] [12]; Sô [13] and Sota [14]. These stu-dies reinforce the state of knowledge on macroinvertebrates and know their im-portance. Despite these studies, our knowledge is still limited on the diversity and distribution of macroinvertebrates with respect to altitude. Therefore, the study aims to gain a better understanding of benthic macroinvertebrate distribu-tion and biodiversity of Affon River in order to assess its ecological quality.
2. Materials and Methods
2.1. Study Area and Sampling Stations
DOI: 10.4236/ae.2019.74008 94 Advances in Entomology 152 km and a catchment area of 4320 km2. The river is located in the
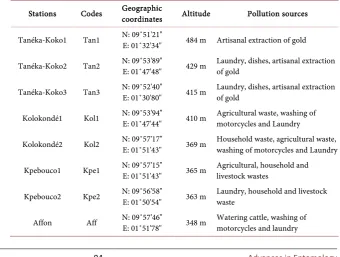
Suda-no-Guinean zone and is under the influence of the tropical climate characterized by the succession in the year of a single rainy season from April to October and a single dry season from November to March, marked by the preponderance of the harmattan. On the Affon River, 08 stations were selected after prospecting. They were chosen based on the sustainability of the water, the altitude, accessi-bility in all seasons, the depth and speed of the water [11]. Table 1 shows the characteristics of these different stations.
2.2. Measurement of Water Physico-Chemical Parameters
[image:3.595.199.540.489.746.2]At each station, the measurements of physical parameters (temperature, depth, transparency, TDS, conductivity, pH, oxygen) were carried out in situ very early in the morning between 08:00 and 12:00, before the sampling of macroinverte-brates to avoid any disturbance of the environment. Water temperature, TDS and conductivity were determined using a portable conductivity meter (HANNA HI 99300). The pH was measured with a portable pH meter (HANNA HI 98107). A Secchi disk with a graduated rope is used to measure the transparency of the water and depth of the stations. Water samples were made at each station in 500 ml plastic bottles decontaminated and stored in a cooler containing ice for transport to the laboratory for analysis of the dissolved substances. The dis-solved elements concentration’s determination of the water samples was carried out in the Laboratory of Hygiene, Sanitation, Ecotoxicology and Environmental Health (HECOTES) using a spectrophotometer DR 6000. The chemical parame-ters such as ammonium, nitrite and phosphate were respectively measured by the Nessler method [15], the iron sulphate method and the Vanadomolybdic method with persulfate digestion.
Table 1. Location, geographic coordinates and characteristics of sampling stations.
Stations Codes Geographic coordinates Altitude Pollution sources
Tanéka-Koko1 Tan1 N: 09˚51'21" E: 01˚32'34" 484 m Artisanal extraction of gold
Tanéka-Koko2 Tan2 N: 09˚53'89" E: 01˚47'48" 429 m Laundry, dishes, artisanal extraction of gold
Tanéka-Koko3 Tan3 N: 09˚52'40" E: 01˚30'80" 415 m Laundry, dishes, artisanal extraction of gold
Kolokondé1 Kol1 N: 09˚53'94" E: 01˚47'44" 410 m Agricultural waste, washing of motorcycles and Laundry
Kolokondé2 Kol2 N: 09˚57'17" E: 01˚51'43" 369 m Household waste, agricultural waste, washing of motorcycles and Laundry
Kpebouco1 Kpe1 N: 09˚57'15" E: 01˚51'43" 365 m Agricultural, household and livestock wastes
Kpebouco2 Kpe2 N: 09˚56'58" E: 01˚50'54" 363 m Laundry, household and livestock waste
DOI: 10.4236/ae.2019.74008 95 Advances in Entomology
2.3. Sampling of Macroinvertebrates
The benthic macroinvertebrates were sampled at the 08 stations. They were tak-en by using a Surber sampler with a 500-µm mesh. This material was placed on the bottom of the river, the opening of the net facing the watercourse and the substrate is scraped a few centimeters with the hand. Twelve samples with a unit area of 1/20 m2 were done per station: (08) eight on the dominant habitats and
(04) on the marginal habitats as recommended by the standard IBGN and al-ready used in the North of Benin by Abahi et al. (2018) [11]. The organisms col-lected in surber sampler were spilled in labeled jars and fixed to 10% formalin and then sent to the laboratory.
2.4. Macroinvertebrates Identification
In the laboratory, the captured macroinvertebrates were rinsed in order to rid them of the formalin and then they were sorted station by station under a bino-cular dissecting microscope. After the sorting, we grouped them according to their classes up to their families apart from oligochaetes, nemathelminths, hy-dracarians, hydrozoans, sponges, bryozoans and nemerteans that are kept aside such as Abahi et al. (2018) [11] has done. The following articles: “Benthic ma-croinvertebrates of the streams of ‘la Nouvelle-Calédonie’” by Mary (2017) [16], “Identification guide of the main benthic macroinvertebrates of freshwater from Quebec” written by Moisan (2010) [17], “Freshwater invertebrates: Systematics, biology, ecology” by Tachet et al. (2000) [18] and “Aquatic entomology” by McCafferty (1981) were the key highlighted supports in making the taxonomic determination after which macroinvertebrates were enumerated and then stored in pillboxes containing 70% alcohol.
2.5. Data Interpretation
The identified fauna data allowed us to calculate the following metrics and in-dices:
Taxonomic richness (S) = number of taxa present in each station
Abundance (N) = number of individuals from a taxonomic group in each sta-tion
Relative abundance (Nr) = ratio as a percentage of the number of taxon indi-viduals in a station to the total number of indiindi-viduals of all species of all stations. Frequency of family observation (FO) = (Fi × 100)/Ft. In such, Fi = number of
stations containing the family and Ft = total number of stations studied. Three
families were thus distinguished as Abahi et al. (2018) [11] has previously dem-onstrated. We have “very frequent families’’ (F ≥ 50%), “frequent families’’ (25% ≤ F ≤ 50%) and “rare families’’ (F ≥ 25%).
Shannon diversity index (H) = −£pi⋅log2pi, with pi meaning the relative
DOI: 10.4236/ae.2019.74008 96 Advances in Entomology polluted water.
Piélou index (E) = H'/log2S with S standing for the total number of individu-als.
Simpson index (D) = 1 − £iS=1
( )
pi 2 with S standing for the total number ofindividuals and pi = meaning the relative abundance.
Family biotic index (Hilsenhoff index): To determine the water quality of the different stations, the family biotic index developed by Hilsenhoff was used. It has been calculated as follows:
F i i i n t
FBI N
=
∑
in which F is the family number, ni is the number of individuals, ti is the
toler-ance value of the family i and N is the total number of individuals. The tolerance values of the macroinvertebrate families come from Hilsenhoff (Table 2).
2.6. Statistics Analysis of Data
The obtained data was processed using Excel 2010 software and R3.4.4 software [19]. The taxonomic richness, the taxonomic abundance, the average values of the physico-chemical parameters were calculated per each station. Parametric and non-parametric tests (test t student and test of Kruskal-Wallis) were used to evaluate the variability of the taxonomic richness of the abundances and diversi-ty indices at the 5% threshold with the R3.4.2 software [19]. Moreover, the ftorial correspondence analysis (FCA) was used for grouping the stations ac-cording to the similarity association of macroinvertebrate families. In addition, a canonical correspondence analysis (CCA) was performed using PAST statistical package [20].
3. Results
3.1. Relationship between Macroinvertebrates and
Physico-Chemical Parameters
DOI: 10.4236/ae.2019.74008 97 Advances in Entomology
Table 2. Score pattern of Hilsenhoff index.
Value of FBI Water quality Degree of organic pollution
0.00 à 3.75 Excellent Without organic pollution
3.76 à 4.25 Very good Slight organic pollution
4.26 à 5.00 Good Probable organic pollution
5.01 à 5.75 Average Substantially organic pollution
5.76 à 6.50 Rather bad Substantial organic pollution
6.51 à 7.25 Bad Very substantial organic pollution
7.26 à 10.00 Very bad Serious organic pollution
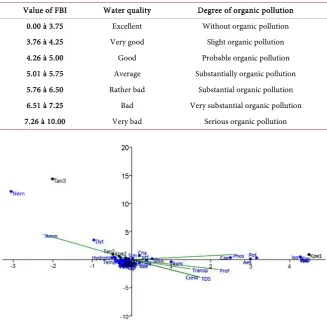
Figure 1. Canonical correspondence analysis of macroinvertebrates and physiochemical
variables.
3.2. Ecological Quality of the Affon River Waters
Spatial variation of the Shannon biodiversity index (H')
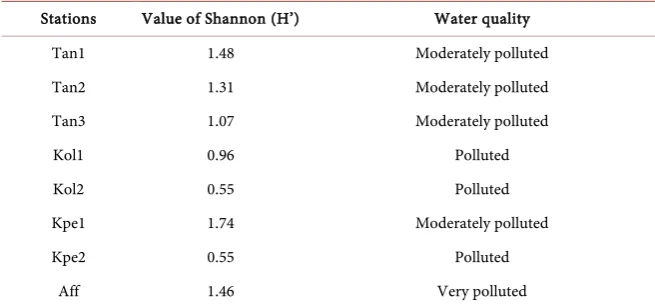
Table 3 presents the values of the Shannon index and the water quality of the stations studied. Thus, the values of the Shannon index vary between 0.55 bit (Kolokondé 2 and Kpébouco 2) and 1.74 bits (Kpébouco 1). These results show that the water quality of the Affon River varied between polluted and moderately polluted (Table 3). In addition, Shannon index values showed significant dif-ferences between stations (p = 0.001).
Spatial variation of Piélou and Simpson’s equitability indices
The spatial variations of Piélou and Simpson’s equitability indices are pre-sented in Table 4. The Piélou equitability index ranged from 0.18 (Kpekouco 2) to 0.63 (Tanéka 2). While, Simpson’s index fluctuated between 0.20 (Kpekouco 2) and 0.73 (Kpekouco 1). Finally, these indices showed significant differences (p > 0.05) between the stations (Table 4).
Spatial variation of the EPT and EPT/Chironomidae indices
DOI: 10.4236/ae.2019.74008 98 Advances in Entomology
Table 3. Shannon index values and ecological status of the stations.
Stations Value of Shannon (H’) Water quality
Tan1 1.48 Moderately polluted
Tan2 1.31 Moderately polluted
Tan3 1.07 Moderately polluted
Kol1 0.96 Polluted
Kol2 0.55 Polluted
Kpe1 1.74 Moderately polluted
Kpe2 0.55 Polluted
[image:7.595.209.537.277.329.2]Aff 1.46 Very polluted
Table 4. Piélou and Simpson equitability indices.
Stations Tan1 Tan2 Tan3 Kol1 Kol2 Kpe1 Kpe2 Aff p
[image:7.595.212.539.363.531.2]Index of Pielou 0.43 0.63 0.59 0.33 0.19 0.58 0.18 0.49 0.01 Index of Simpson 0.59 0.62 0.55 0.4 0.22 0.73 0.2 0.62 0.001
Table 5. EPT and EPT/Chironomidae indices.
Stations
Descriptors Tan1 Tan2 Tan3 Kol1 Kol2 Kpe1 Kpe2 Aff
Taxonomic richness 30 8 6 19 19 20 20 20
EPT Richness 8 1 2 4 4 10 3 3
Total abundance 2652 98 43 756 2940 468 1459 1339
EPT abundance 447 23 2 13 228 253 17 320
Chironomidae abundance 1645 55 12 577 2594 169 1306 780
% EPT 16.9 23.5 4.7 1.7 7.8 54.1 1.2 23.9
% Chironomidae 62.0 56.1 27.9 76.3 88.2 36.1 89.5 58.3
EPT/Chironomidae 0.3 0.4 0.2 0.0 0.1 1.5 0.0 0.4
of the EPT index reflect the deterioration of the water quality of the Affon River. Regarding the percentage of Chironomidae, it is higher than 55% on all stations except Tanéka 3 and Kpébouco 1 stations. In addition, the values of the EPT/C index of the different stations are generally low and close to zero. These results indicate that the waters of the different stations are of poor ecological quality and reveal the environmental stress suffered by the Affon River.
Family Biotic Index (Hilsenhoff Index)
DOI: 10.4236/ae.2019.74008 99 Advances in Entomology
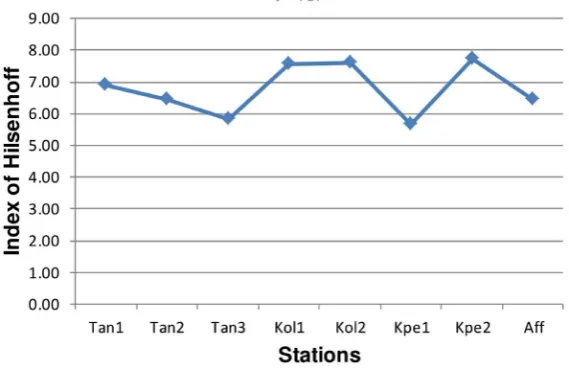
Figure 2. Hilsenhoff index variation.
(FBI) calculated for the Affon River is 7.14. This high value of the family biotic index indicates that the water of this river is of poor quality and that it presents a very substantial organic pollution.
4. Discussion
4.1. Ecological Quality of Affon River Waters
val-DOI: 10.4236/ae.2019.74008 100 Advances in Entomology ues of the family biotic index (FBI) confirm once again and indicate that the wa-ter of the Affon River is of very poor quality and subjected to a very substantial organic pollution. These high values of the Hilsenhoff index indicate a degraded environment and are due to the preponderance of pollution-sensitive families such as Chironomidae [25]. These observations corroborate those made by Nuamah et al. (2018) [26] at Nima stream in Ghana. The observed water degra-dation can be attributed to discharges into the stream of agricultural and domes-tic effluents that contain nutrients [26] [27].
4.2. Composition and Distribution of Macroinvertebrates
ammo-DOI: 10.4236/ae.2019.74008 101 Advances in Entomology nium on the one hand and between Perlidae, Taeniopterygidae, Ephemeridae, Heptageniidae, isonychiidae, Elmidae and phosphate where there was a strong positive correlation. These correlations show the invulnerability of these fami-lies, which are mostly pollution-sensitive famifami-lies, at the doses of phosphate and ammonium measured in this study.
5. Conclusion
The present study inventoried 9755 macroinvertebrate individuals belonging to four classes, fourteen orders and forty-nine families. Insects were the most do-minant with 97.40% of the total richness. Taxonomic richness and abundance tend to follow an altitudinal gradient. The analysis of the indices reveals an undiversi-fied population and the environmental stress that this river undergoes. The strong positive correlations observed between Nemouridae and ammonium on the one hand and between Perlidae, Taeniopterygidae, Ephemeridae, Heptageniidae, iso-nychiidae, Elmidae and phosphate show the invulnerability of these families, which are mostly pollution-sensitive families, at the doses of phosphate and am-monium measured in this study. Nevertheless, certain protection and recovery measures must be taken to preserve and improve the ecological status of the Af-fon River waters. It involves the implementation of a sustainable river manage-ment plan, the promotion of organic farming, the awareness of the population on the importance of water and its quality. In addition, a long-term investigation based on biomonitoring and a sustainable management program are recom-mended to conserve the biodiversity of this river.
Acknowledgements
We thank the people of our sampling places for their participation in the study. Special thanks go to the team of the Laboratory of Hygiene, Sanitary, Ecotox-icology and Environmental health (HECOTES) and the team of the Laboratory of Ecology, Health and Animal Production (LESPA).
Conflicts of Interest
The authors declare that they have no conflict of interest.
References
[1] Leigh, C., Burford, M.A., Robert, D.T. and Udy, J.W. (2010) Predicting the Vulne-rability of Reservoirs to Poor Water Quality and Cyanobacterial Blooms. Water Re-search, 44, 4487-4496. https://doi.org/10.1016/j.watres.2010.06.016
[2] Hepp, L.U., Milesi, S.V., Biasi, C. and Restello, R.M. (2010) Effects of Agricultural and Urban Impacts on Macroinvertebrates Assemblages in Streams (Rio Grande do Sul, Brazil) Zool. Curitiba, 27, 106-113.
https://doi.org/10.1590/S1984-46702010000100016
[3] Agbohessi, T.P., Toko, I.I. and Kestemont, P. (2012) État des lieux de la contamina-tion des écosystèmes aquatiques par les pesticides organochlorés dans le Bassin co-tonnier béninois. Cahiers Agricultures, 21, 46-56.
DOI: 10.4236/ae.2019.74008 102 Advances in Entomology
[4] Benetti, C.J., Pérez-Bilbao, A. and Garrido, J. (2012) Macroinvertebrates as Indica-tors of Water Quality in Running Waters: 10 Years of Research in Rivers with Dif-ferent Degrees of Anthropogenic Impacts. In: Ecological Water Quality-Water Treatment and Reuse, InTech, London.
[5] Moisan, J., Pelletier, L., Gagnon, E., Piedboeuf, N. and La Violette, N. (2013) Guide de surveillance biologique basée sur les macroinvertébrés benthiques d’eau douce du Québec, 2e ed. Direction du suivi de l’état de l’environnement.
[6] Chessman, B.C. (1995) Rapid Assessment of Rivers Using Macroinvertebrates : A Procedure Based on Habitat-Specific Sampling, Family Level Identification and Bio-tic Index. Australian Journal of Ecology, 20, 122-129.
https://doi.org/10.1111/j.1442-9993.1995.tb00526.x
[7] Camargo, J.A., Alonso, A. and De La Puente, M. (2004) Multimetric Assessment of Nutrient Enrichment in Impounded Rivers Based on Benthic Macroinvertebrates.
Environmental Monitoring and Assessment, 96, 233-249. https://doi.org/10.1023/B:EMAS.0000031730.78630.75
[8] Allan, J.D. and Johnson, L.B. (1997) Catchment-Scale Analysis of Aquatic Ecosys-tems. Freshwater Biology, 37, 107-111.
https://doi.org/10.1046/j.1365-2427.1997.00155.x
[9] AgblononHouelome, T.M.A., Adandedjan, D., Chikou, A., ImorouToko, I., Kou-denoukpo, C.Z., Youssao, I. and Laleye, P. (2017) Inventaire et caractéristiques fau-nistiques des macroinvertébrés de la rivière Alibori dans le bassin cotonnier du Bénin. International Journal of Innovation and Applied Studies, 21, 433-448. [10] Imorou Toko, I., Attakpa, E.Y., Gnohossou, P. and Aboudou, E.F. (2012)
Biodiver-sité et structure des macroinvertébrés benthiques du bassin cotonnier béninois.
Annales des Sciences Agronomiques, 16, 165-182.
[11] Abahi, K.S., Gnohossou, P., Akodogbo, H.H., Orou Piami, Z., Adje, D., Tchaou, C. and Okoya, J. (2018) Structure et diversité des macroinvertébrés benthiques de la partie supérieure du fleuve Ouémé au Bénin. Afrique Science: Revue internationale des sciences et technologie, 14, 259-270.
[12] Zinsou, H.L., Gnohossou, P., Adandedjan, D. and Laleye, P. (2016) Profil de distri-bution des macroinvertébrés benthiques du delta de l’Ouémé à partir du Self Orga-nizing Map (SOM). Afrique Science, 12, 224-236.
[13] Koudenoukpo, Z.C., Chikou, A., Imorou Toko, I., Togouet, S.H.Z., Tchakonté, S., Hazoume, R. and Piscart, C. (2017) Diversity of Aquatic Macroinvertebrates in Re-lationship with the Environmental Factors of a Lotic Ecosystem in Tropical Region: The Sô River in South-East of Benin (West Africa). Journal of Entomology and Zo-ology Studies, 5, 1-10.
[14] Orou Piami, Z. (2018) Diversité et distribution spatiale des macroinvertébrés ben-thiques de la rivière Sota au Bénin. Mémoire pour l’obtention du Diplôme de Mas-ter Recherche de l’Ecole Doctorale des Sciences Agronomiques et de l’eau de l’Université de Parakou, Bénin, 43 p.
[15] APHA (1992) Standard Methods for the Examination of Water and Wastewater. 18th Edition, American Public Health Association (APHA), Washington DC. [16] Mary, N. (2017) Les macroinvertébrés benthiques des cours d’eau de la
Nou-velle-Calédonie. Guide d’identification. Version révisée 2017, DAVAR Nouvelle-Calédonie. ed, OEIL, CNRT.
Développe-DOI: 10.4236/ae.2019.74008 103 Advances in Entomology
ment durable, environnement et parcs Québec.
[18] Tachet, H., Richoux, P., Bournaud, M. and Usseglio-Polatera, P. (2000) Invertébrés d’eau douce: Systématique, biologie, écologie. CNRS Ed. 588 p.
[19] R Core Team (2018) R: A Language and Environment for Statistical Computing. R Foundation for Statistical Computing, Vienna, Austria.
[20] Hammer, Ø., Harper, D.A.T. and Ryan, P.D. (2001) Paleontological Statistics Soft-ware: Package for Education and Data Analysis. PalaeontologiaElectronica, 4, 9-18. [21] Foto, M.S., Tchakonté, S., Ajeagah, G.A., Zebaze, T.S.H., Bilong, B.C.F. and Njiné,
T. (2013) Water Quality Assessment Using Benthic Macroinvertebrates in a Periur-ban Stream (Cameroon). International Journal of Biotechnology, 2, 91-104. [22] Ibezute, A.C., Asibor, G.I. and Ibezute, S.U. (2016) Ecological Assessment of
Bre-wery Effluent Impact on the Macrobenthic Invertebrates of Ikpoba River, Edo State, Nigeria. International Journal of Ecosystem, 6, 47-54.
[23] Foto, M.S., Zebaze, T.S.H., Nyamsi, T.N.L., Ajeagah, G.A. and Njiné, T. (2011) Evolution Spatiale de la Diversité des Peuplements de Macroinvertébrés Benthiques dans un cours d’eau Anthropisé en Milieu Tropical (Cameroun). European Journal of Scientific Research, 55, 291-300.
[24] Abahi, S. (2018) Les macroinvertébrés de l’Ouémé supérieur: Abondance, diversité et variation spatiale. Mémoire pour l’obtention du Diplôme de Master Recherche de l’Ecole Doctorale des Sciences Agronomiques et de l’eau de l’Université de Parakou, Bénin, 77 p.
[25] Grandjean, F., Momon, J. and Bramard, M. (2003) Biological Water Quality As-sessment of the White-Clawed Crayfish Habitat Based on Macroinvertebrate Communities: Usefulness for Its Conservation. Bulletin français de la pêche et de la pisciculture, 370, 115-125.
[26] Nuamah, L.A., Huang, J. and Dankwa, H.R. (2018) Biological Water Quality As-sessment of Shallow Urban Streams Based on Abundance and Diversity of Benthic Macroinvertebrate Communities: The Case of Nima Creek in Ghana. Environment and Ecology Research, 6, 93-101. https://doi.org/10.13189/eer.2018.060201
[27] Nurhafizah-Azwa, S. and Ahmad, A.K. (2018) Biodiversity of Benthic Macroinver-tebrates in Sungai Kisap, Langkawi, Kedah, Malaysia. Journal of Tropical Resources and Sustainable Science, 6, 36-40.
[28] Alhou, B., Issiaka, Y., Awaiss, A. and Micha, J.-C. (2014) Premier inventaire des macro-invertébrés du fleuve Niger à Niamey comme bioindicateurs de la pollution urbaine et industrielle. Hydroécologie Appliquée, 18, 139-163.
[29] Diomandé, D., Bony, Y.K. and Edia, E.O. (2009) Diversité des Macroinvertébrés Benthiques de la Rivière Agnéby (Côte d’Ivoire; Afrique de l’Ouest). European Journal of Scientific Research, 35, 368-377.
[30] Sanogo, S., Kabré, T.J.A. and Cecchi, P. (2014) Inventaire et distribution spa-tio-temporelle des macroinvertébrés bioindicateurs de trois plans d’eau du bassin de la Volta au Burkina Faso. International Journal of Biological and Chemical Sciences, 8, 1005-1029. https://doi.org/10.4314/ijbcs.v8i3.16
[31] Kabré, T.A., Illé, A. and Guenda, W. (2000) Inventaire et étude de la densité de dis-tribution des insectes du benthos des deux lacs de barrage de Bagré. Revue Sciences et Techniques, Série Science Naturelle et Agronomie, 24, 121-132.
Ecol-DOI: 10.4236/ae.2019.74008 104 Advances in Entomology ogy, 31, 21-35. https://doi.org/10.1080/02705060.2015.1017847
[33] Pan, B., Wang, Z., Yu, G., Xu, M., Zhao, N. and Brierley, G. (2013) An Exploratory Analysis of Benthic Macroinvertebrates as Indicators of the Ecological Status of the Upper Yellow and Yangtze Rivers. Journal of Geographical Sciences, 23, 871-882.