A reduced computational load protein coding predictor using
equivalent amino acid sequence of DNA string with period-3
based time and frequency domain analysis
J. K. Meher1, G. N. Dash2, P. K. Meher3, M. K. Raval4
1Department of Computer Science and Engineering, Vikash College of Engineering for Women, Bargarh, Orissa, India; 2School of Physics, Sambalpur University, Orissa, India;
3Department of Embedded System, Institute for Infocomm Research, Singapore; 4PG Department of Chemistry, G.M. College, Sambalpur, Orissa, India.
E-mail: [email protected], [email protected], [email protected], [email protected]
Received 12 May 2011; revised 14 June 2011; accepted 29 June 2011.
ABSTRACT
Development of efficient gene prediction algorithms is one of the fundamental efforts in gene prediction study in the area of genomics. In genomic signal processing the basic step of the identification of pro-tein coding regions in DNA sequences is based on the period-3 property exhibited by nucleotides in exons. Several approaches based on signal processing tools and numerical representations have been applied to solve this problem, trying to achieve more accurate predictions. This paper presents a new indicator se-quence based on amino acid sese-quence, called as ami-noacid indicator sequence, derived from DNA string that uses the existing signal processing based time- domain and frequency domain methods to predict these regions within the billions long DNA sequence of eukaryotic cells which reduces the computational load by one-third. It is known that each triplet of bases, called as codon, instructs the cell machinery to synthesize an amino acid. The codon sequence there-fore uniquely identifies an amino acid sequence which defines a protein. Thus the protein coding re-gion is attributed by the codons in amino acid se-quence. This property is used for detection of period- 3 regions using amino acid sequence. Physico-chemi- cal properties of amino acids are used for numerical representation. Various accuracy measures such as exonic peaks, discriminating factor, sensitivity, speci-ficity, miss rate, wrong rate and approximate corre-lation are used to demonstrate the efficacy of the proposed predictor. The proposed method is vali-dated on various organisms using the standard data-set HMR195, Burdata-set and Guigo and KEGG. The si-mulation result shows that the proposed method is an
effective approach for protein coding prediction. Keywords: Genomics; Bioinformatics; Codon; Coding Region; Amino Acid Sequence; Fourier Transform; Antinotch Filter; Periodicity-3; Indicator Sequence
1. INTRODUCTION
Over the past few decades, major advances in the field of molecular biology, coupled with advances in genomic technologies, have led to an exponential growth of ge-nomic sequences. An important step in gege-nomic annota-tion is to identify protein coding regions of genomic sequences, which is a challenging problem especially in the study of eukaryote genomes. In eukaryote genome, protein coding regions (exons) are usually not continu-ous [1]. Due to the lack of obvicontinu-ous sequence features between exons and introns, distinguishing protein coding regions effectively from noncoding regions is a chal-lenging problem in bioinformatics. Gene Prediction re-fers to detecting locations of the protein-coding regions of genes in a long DNA sequence. For most prokaryotic DNA sequences, the problem is to determine which segments, in the given sequence, are really coding quences coding for proteins. For eukaryotic DNA se-quences, the problem is to determine how many exons and introns (non-coding regions) are there in the given sequence and what are the exact boundaries between the exons and introns [2].
methodologies could not lead to satisfactory results. A variety of computational algorithms have been devel-oped to predict exons. Most of the exon-finding algo-rithms are based on statistics methods, which usually use training data sets from known exon and intron sequences to compute prediction functions. As examples, GenScan algorithm [1,2] measured distinct statistics features of exons and introns within genomes and employed them in prediction via hidden Markov model (HMM).
Signal processing techniques offer a great promise in analyzing genomic data because of its digital nature. Signal processing analysis of bio-molecular sequences plays important role for their representation as strings of characters [4,5]. If numerical values are assigned to these characters, the resulting numerical sequences are readily applicable to digital signal processing. During recent years, signal processing approaches have been attracting significant attentions in genomic DNA re-search and have become increasingly important to elu-cidate genome structures because they may identify hid-den periodicities and features which cannot be revealed easily by conventional statistics methods [6,7]. After converting symbol DNA sequences to numerical se-quences, signal processing tools, typically, discrete Fou-rier transform (DFT) or digital filter can be applied to the numerical vectors to study the frequency domain of the sequences [8]. For most of DNA sequences, one of the principal features is the periodic 3-nucleotide pattern which has been known phenomenon for eukaryotic ex-ons. DNA periodicity in exons is determined by codon usage frequencies. There has been a great deal of work done in applying signal processing methods to DNA recently. The discrete Fourier transform and antinotch filter are applied based on the period-3 property.
The DFT of a given input DNA sequence exhibits a peak at the frequency 2/3 due to periodicity in the se-quence [9]. The DNA sese-quence consisting of indicator sequence {x(n)} of the four bases can be represented in
corresponding binary sequences xA(n), xT(n), xC(n) and xG(n). The DFT of length N for input binary sequence xA(n) is defined by
1
2 /
0
( ) ( )
0 1
N
j kn N
A A
n
X k x n e
k N
(1)Similarly, XT[k], XC[k] and XG[k] can be found out and
the total power at frequency k then be expressed as
2 2
2 2
( ) A( ) T( ) C( ) G( )
S k X k X k X k X k (2)
The frequency spectrum of S[k], is found to exhibit a
peak at k = N/3 which indicates the presence of a coding
region in the gene.
In digital filtering, for each indicator sequence xA(n),
xT(n), xC(n) and xG(n), a corresponding filter output YA(n), YT(n), YC(n) and YG(n), respectively are computed. The
sum of the square of magnitude of these filter outputs is expressed as
2
2 2
( ) A( ) T( ) C( ) G( )
Y n Y n Y n Y n Y n 2
(3)
A plot of Y(n) has been used to extract the period-3region of the DNA effectively [9]. This principle has been applied in antinotch filter and multistage filter. The notch filter is a bandpass filter with passband centered at = 2/3 and minimum stop-band attenuation of about 13 dB. The antinotch filter is a power complementary of notch filter.
In Ref. [6], Tiwari, et al. utilized Fourier analysis to
detect the probable coding regions in DNA sequences, by computing the amplitude profile of this spectral component which is evidenced as a sharp peak at fre-quency f = 1/3 in the power spectrum. The strength of
the peak depends markedly on the gene. Anastassiou proposed a mapping technique to optimize gene predic-tion using Fourier analysis and introduced color spectro-gram for exon prediction [7]. Although this mapping technique produced comparatively good results than DFT but it was DNA sequence dependent and thus re-quires computation of the mapping scheme before proc-essing for gene prediction. To improve the filtering through DFT computation, P. P. Vaidyanathan, in [9], proposed digital resonator (antinotch filter) to extract the period-3 components. Short time Fourier transform (STFT) with entropy based methods is incorporated to increase its efficacy to identify the homogeneous regions. [10]. Identification of protein coding regions was devel-oped using modified Gabor-Wavelet transform [11] for the having advantage of being independent of the win-dow length. Entropy minimization criterion in DNA sequences is discussed by Galleani and Garello [12]. Tuqan and Rushdi [13] had explained 3-periodicity re-lated to the codon bias using two stage digital filter and multirate DSP model. Criteria to select the numerical
values to represent genomic sequences are discussed by Akhtar et al. [14,15].
quaternion [20], Gailos field assignment [21], EIIP [22, 23], paired numeric [14] to make indicator sequence in DSP methods to improve the accuracy of exons predic-tion. Another four-indicator sequence called as relative frequency indicator sequence based on various coding statistics like single-nucleotide, dinucleotide and trinu-cleotide biases are incorporated into the algorithm to improve the selectivity and sensitivity of filter methods [24]. Real-number representation maps A = 1.5, T = –1.5, C = 0.5, and G = –0.5 similar to the complementary
property of the complex method are used in [14]. Despite many progresses being made in the identifica-tion of protein coding regions by computaidentifica-tional methods the performances and efficiencies of the prediction me-thods still need to be improved. It is indispensable to develop new prediction methods to improve the predic-tion accuracy. The existing numerical encoding methods can be classified into four-indicator sequences, three- indicator sequences and single-indicator sequences based on computational overhead. The single-indicator sequ- ence reduces the computational overhead by 75% in compared to four-indicator sequence.
A new method to predict protein coding regions is developed in this paper based on the amino acid indica-tor sequence obtained from DNA string that exon se-quences have a 3-base periodicity, while intron sequen- ces do not have this unique feature. The method com-putes the 3-base periodicity and the background noise of the stepwise amino acid segments of the target amino acid sequences using distributions in the codon positions of the amino acid sequences. The proposed single indi-cator sequence based on amino acids reduces further the computational load by one-third.
The rest of the paper is organized as follows. Section- 2 presents amino acid indicator sequence approach for identification of protein coding regions using Fourier transform and digital filter. Section-3 focuses on the re-sults of the proposed methods with accuracy measures and validated with standard datasets such as HMR195, Burset and Guigo and KEGG. Section-4 presents the conclusions of this paper.
2. PROPOSED AMINO ACID INDICATOR
SEQUENCE
[image:3.595.317.532.82.143.2]It is known that each triplet of bases, called as codon, instructs the cell machinery to synthesize an amino acid. The codon sequence therefore uniquely identifies an amino acid sequence which defines a protein. Thus the protein coding region is attributed by the codons in amino acid sequence [2]. This property is used for detec-tion of period-3 regions using amino acid sequence. The period-3 property is related to difference in the statistical distributions of codon sequence between protein-coding
Figure 1. Central Dogma of molecular biology.
and non-coding sections. This periodicity reflects corre-lations between residue positions along coding se-quences.
The genetic information contained in DNA sequences, RNA sequences, and proteins is extracted in Genomic signal processing. A DNA sequence is made from an alphabet of four elements, namely A, T, C, and G
mole-cules called nuclotides or bases. This quarternary code of DNA contains the genetic information of living or-ganisms. Similarly protein is also a discrete-alphabet sequences that imparts genetic information and large number of functions in living organism. A protein can be represented as a sequence of amino acids. There are twenty distinct amino acids, and so a protein can be re-garded as a sequence defined on an alphabet of size twenty. The twenty letters used to denote the amino ac-ids are the letters from the English alphabet such as ACDEFGHIKLMNPQRSTVWY. It is common that some letters representing amino acids are identical to some letters representing bases. For example the A in the
DNA is a base called adenine, and the A in the protein is
an amino acid called alanine. It is known that each gene is responsible for the creation of a specific protein when expressed and this is called as central dogmaof molecu-lar biology [2] as shown in Figure 1.
The information of expression of particular protein from a gene is contained in a code which is common to all life. The gene gets duplicated into the mRNA mole-cule which is then spliced so that it contains only the exons of the gene. Each triplet of three adjacent bases of mRNA is called a codon. There are 64 possible codons. Thus the mRNA is nothing but a sequence of codons. Each codon instructs the cell machinery to synthesize a protein using the genetic code. When all the codons in the mRNA are exhausted we get a long chain of amino acids. This is the protein corresponding to the original gene.
In practice numerical values are assigned to the four letters in the DNA sequence to perform a number of signal processing operations such as Fourier transforma-tion, digital filtering, time-frequency plots such as wave- let transformations. Similarly, once we assign numerical values to the twenty amino acids in protein sequences we can do useful signal processing.
Table 1.The genetic code.
S.N. Amino acids Codon
1 A Alanine GCA, GCC, GCG, GCT 2 C Cysteine TGC, TGT
3 D Aspartic acid GAG, GAT 4 E Glutamic acid GAA, GAG 5 F Phenylalanine TTC, TTT
6 G Glycine GGA, GGC, GGT, GGG 7 H Histidine CAC, CAT
8 I Isoleucine ATA, ATC, ATT 9 K Lysine AAA, AAG 10 L Leucine TTA, TTG,CTA, CTC, CTG, CTT 11 M Methionine ATG
12 N Asparagine AAC, AAT
13 P Proline CCA, CCC, CCG, CCT 14 Q Glutamine CAA, CAG
15 R Arginine AGA, AGG, CGA, CGC, CGG, CGT
16 S Serine AGC, AGT, TCA, TCC, TCG, TCT 17 T Threonine ACA, ACC, ACG, ACT 18 V Valine GTA, GTC, GTG, GTT 19 W Tryptophan TGG
20 Y Tyrosine TAG, TAT
amino acid sequence. In this work the DNA sequence is converted to amino acid sequence i.e., the A, T, C, G
language is converted to amino acid language [14]. Three characters consisting of nucleotides are represented as codon consisting of twenty alphabets of aminoacids. The mapping from amino acids to codons is many-to-one (Table 1). For a given DNA sequence xB(n), where B is
nucleotide bases, the corresponding amino acid sequence is obtained as xR(n), where R represents 20 amino acids.
For example
ATGGGTCCAGCTCCAGTTTTCCCAAATTCGCGGAAGCCGGCGACACTB x n
MGPAPVFPNSRKPAT
R x n
The most relevant for the application of signal proc-essing tools is the assignation of properties of amino acid alphabets to form amino acid indicator sequence.
There are several approaches to convert genomic infor-mation in numeric sequences using different representa-tions. Physico-chemical properties of amino acids such as volume, charge, area, EIIP, dipole moment, alpha etc obtained from Hyperchempro 8.0 software of Hyper-CubeInc, USA are used in this paper for analysis of the proteins (Table 2). The resulting numerical sequence by substituting these values is called amino acid indicator sequence.
Each amino acid is associated with a unique number of alpha propensities. The indicator sequence is obtained by spreading the numerical value on the amino acid se-quence.
{1.501 1.058 0.519 1.409 0.519 1.694 1.966 0.519 0.434 0.774 0.240 0.181 0.519 1.409 0.828}
AA
x
Table 2. Physico-chemical properties of amino acids.
Amino acid Alpha EIIP Dipole moment
A 1.409 0.0373 5.937
R 0.240 0.0959 37.5
N 0.434 0.0036 18.89
D 0.192 0.1263 29.49
C 1.069 0.0829 10.74
Q 0.333 0.0761 39.89
E 0.175 0.0058 42.52
G 1.058 0.0050 0.0
H 0.558 0.0242 20.44
L 1.702 0.0000 3.782
I 1.990 0.0000 3.371
K 0.181 0.0371 50.02
M 1.501 0.0823 8.589
F 1.966 0.0946 5.98
P 0.519 0.0198 7.916
S 0.774 0.0829 9.836
T 0.828 0.0941 9.304
W 1.314 0.0548 10.73
Y 0.979 0.0516 10.41
V 1.694 0.0057 2.692
One of the advantages of using amino acid indicator sequences lies in reducing computational load by one-third as compared to processing DNA indicator se-quence.
This technique has been used to identify the coding region which can predict whether a given sequence frame, limited to a specific length N, belongs to a coding
region or not. This is done by sliding frame in which the amino acids of length N of the frame are rated. After that
the frame is shifted through a fixed number of samples of residues downstream. The output of every rated win-dow belongs to residues at the specific position. The existence of three-base periodicity exhibited by the se-quence as a sharp peak at frequency f = 1/3 in the power
spectrum in the protein coding regions helps in the pre-diction of exons.
The discrete Fourier transform (DFT) has been used to predict coding regions in equivalent amino acid se-quences of DNA string. As a consequence of the non-uni- form distribution of codons in coding regions, a three- periodicity is present in most of genome coding regions, which show a notable peak at the frequency component
N/3when calculating their DFT. The DFT of length N for
input amino acid indicator sequence xAA(n) is defined by
1
2π /
0
( ) N ( ) e j kn N
AA AA
n
X k x n
, 0 k N1 (4)for AA = amino acids. The absolute value of power of
DFT coefficients is given by
1
2
0
( ) N | AA( ) |
k
S k X k
(5)The plot of S(k) against k, results in peak at k = N/3 due
[image:4.595.309.538.93.291.2]coding regions.
Taking into account the validity of this result the an-tinotch filter has been applied to amino acid sequences to predict coding regions, using a sliding frame along the sequence. In digital filtering method for indicator se-quence xAA(n), corresponding filter output YAA(n) is
computed where AA represents 20 amino acids. The sum
of the square of magnitude of these filter outputs is ex-pressed as
1
2
0
( ) N | AA( ) |
n
Y n Y n
(6)A plot of Y(n) has been used to extract the period-3
region of the of the sequence effectively. Prediction of protein coding regions can be summarized as the fol-lowing sequence of steps.
1. Convert DNA string to equivalent amino acid se-quence with three character code.
2. Substitute physico-chemical properties of amino acid to construct indicator sequence.
3. Apply this sequence to DFT or digital filter to de-tect period-3 regions.
4. Observe peaks for determining protein coding re-gions.
5. Evaluate assessment parameters to check accuracy.
3. RESULT AND DISCUSSION
In this paper we propose the technique of using amino acid indicator sequence for prediction of protein coding
region in gene sequence. We have used digital filtering techniques, such as antinotch filter to detect the protein coding segments using the existing indicator sequences as well as the proposed single indicator sequences based on physico-chemical properties for several organisms. Mainly, three data sets Burset and Guigo [25], HMR195 [26] and KEGG [27] are used for validation of proposed method. The proposed methods performed well in a good number of cases.
The accuracy measures for evaluating the different methods used in this paper are exon-intron discrimina-tion factor D [23], sensitivity (SN), specificity (SP), miss rate (MR), wrong rate (WR) [3,15] and approximate cor-relation [28]. The discriminating factor is defined as
Lowest of exon peaks Highest peak in noncoding regions
D (7)
The miss rate and wrong rate are defined as
R
ME M
AE
(8)
R
WE W
PE
(9)
[image:5.595.311.537.106.165.2] [image:5.595.327.540.407.467.2]where ME = missing exons, AE = actural exons, WE =
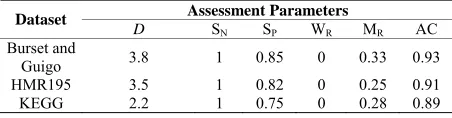
Table 3. Summary of performance evaluation of amino acid
indicator sequence.
Assessment Parameters Dataset
D SN SP WR MR AC
Burset and
Guigo 3.8 1 0.85 0 0.33 0.93 HMR195 3.5 1 0.82 0 0.25 0.91 KEGG 2.2 1 0.75 0 0.28 0.89
wrong exons, PE = predicted exons.
We define TP (true positives) as the number of coding
regions predicted as coding; TN (true negatives) as the
number of noncoding regions predicted as noncoding, FP (false positives) as the number of noncoding regions predicted as coding, and FN (false negatives) as the
number of coding regions predicted as noncoding. Based on these parameters, sensitivity and specificity are de-fined as
P N
P N
T S
T F
(10)
P P
P P
T S
T F
(11)
These are widely used measures of accuracy for gene prediction programs. Another measure that captures both specificity and sensitivity is AC (approximate
correla-tion). AC is defined by
1
0.5 2
4
P P
P N P P
N N
N P N N
T T
T F T F
AC
T T
T F T F
(12)
If D is more than one (D > 1), all exons are identified.
High sensitivity and specificity are desirable for higher accuracy. Low miss rate and wrong rate are desirable for better result. The list of genes of organisms is processed with the proposed single-indicator sequences using fil-tering method and corresponding gene prediction meas-ures have been evaluated. Table 3 summarizes the ob-servations of eight genes from Burset and Guigo dataset, HMR195 and KEGG dataset. In all the examples cited, the proposed encoding methods show better discrimina-tion compared to the method using multiple indicator sequences. The simulation result shows high discrimi-nating factor, sensitivity and specificity with low miss rate and wrong rate for the proposed methods.
Table 4.Simulation results on selected genes from Burset and
Guigo dataset, HMR195 and KEGG dataset.
Gene Name, Acc. No.
Numerical
Representations Accuracy Measures Voss D SN SP MR WR AC
Real numbers 2.75 1 0.66 0 0.5 0.84 Raltive frequency 2.1 1 0.66 0 0.5 0.84 EIIP 3 1 0.66 0 0.5 0.84 Amino acid 2 1 0.66 0 0.5 0.84 HSODF2,
X74614, Homo Sapiens
ODF2 gene
Voss 3.5 1 0.75 0 0.33 0.89 Real numbers 11 1 1 0 0 1 Raltive frequency 12 1 1 0 0 1
EIIP 14 1 1 0 0 1 Amino acid 20.6 1 1 0 0 1 PP32R1,
AF00A216, Homo Sapiens
Voss 22 1 1 0 0 1 Real numbers 1.2 1 0.75 0 0.25 0.9 Raltive frequency 1 1 0.66 0 0.5 0.83
EIIP 1.04 1 0.66 0 0.5 0.83 Amino acid 1.5 1 0.75 0 0.25 0.91 Humbetgloa,
26462, human
betaglobin Voss 1.8 1 0.75 0 0.25 0.91 Real numbers 1.45 1 0.66 0 0.33 0.89 Raltive frequency 1 1 0.66 0 0.33 0.89 EIIP 1.04 1 0.5 0 0.5 0.78 Amino acid 4 1 0.5 0 0.5 0.78 CLDN3,
AF007189, Homo sapiens
Claudin 3 Voss 1.1 1 0.66 0 0.33 0.86 Real numbers 2.2 1 0.66 0 0.5 0.86 Raltive frequency 1.33 1 0.66 0 0.5 0.86 EIIP 3 1 0.66 0 0.5 0.86 Amino acid 1.33 1 0.66 0 0.5 0.86 D p19,
AFO61327, Homo sapiens cyclin-dependent
kinase 4 inhibitor Voss 2.5 1 0.66 0 0.5 0.86 Real numbers 2 0.66 0.66 0.5 0.5 0.66 Raltive frequency 1.33 1 0.66 0 0.5 0.86 EIIP 3.2 1 0.66 0 0.5 0.86 Amino acid 5 1 1 0 0 1 GalR2,
AF042784, Musculus galin
receptor
type 2 gene Voss 5.2 1 1 0 0 1 Real numbers 2 1 0.66 0 0.5 0.86 Raltive frequency 1.3 1 0.66 0 0.5 0.86 EIIP 1.8 1 0.66 0 0.5 0.86 Amino acid 2 1 1 0 0 1 NC_002650
Tre-ponema Denticola U9b Plasmid pTS1
Voss 2.2 1 1 0 0 1 Real numbers 1.1 1 0.6 0 0.5 0.86 Raltive frequency 1.3 1 0.6 0 0.5 0.86 EIIP 1.3 1 0.75 0 0.33 0.89 Amino acid 1.4 1 0.75 0 0.33 0.89 NC_004767
Heli-cobacter pylory plamid pHP51
1.8 1 0.75 0 0.33 0.89
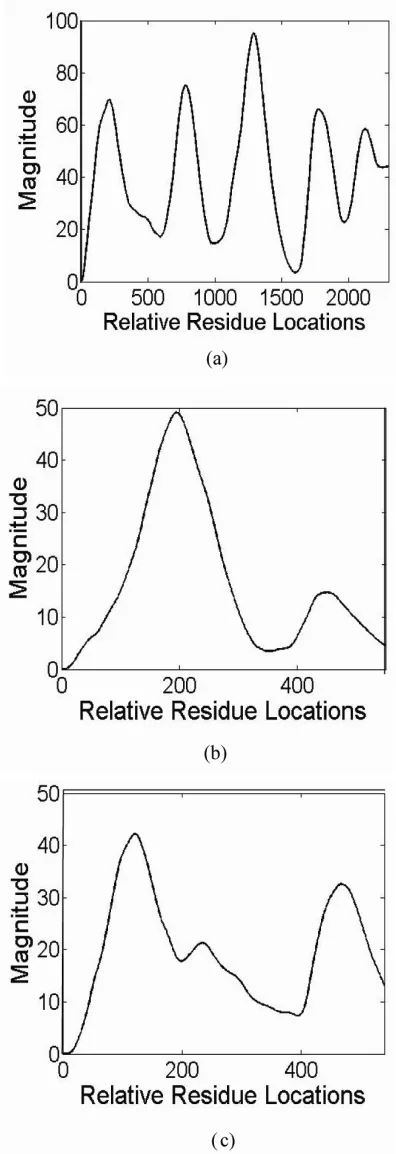
[image:6.595.60.286.105.503.2]The gene sequences “F56 F11.4a” from “Chromo-some III” of the organism “C.elegans” (Accession Number AF099922), HUMELAFIN (D13156) of Homo sapiens and ODF2 of Homo sapiens are used for detecting protein coding regions. All the exons of three genes mentioned above are correctly identified as shown in Figure 2. In particular Figure 2(a) shows the exon prediction results for gene F56 F11.4a showing five peaks corresponding to the exons loca-tions. The simulation result using MATLAB 7.0 shows that of the proposed technique identifies even short sequence. This is observed in first peak of gene F56 F11.4a, whereas it is not pronounced in tradi-tional methods. Similarly Figure 2(b) shows two peaks for two exons in gene Humelafin and Figure 2(c) shows two peaks for two exons in gene ODF2. The length of amino acid sequence is one-third of that
of DNA sequence. Hence the exon locations need to be mapped due to reduction of size of the string.
The proposed indicator sequence consisting of alpha propensity, dipole moment and EIIP of amino acids are used for numerical representation and produce sharp peaks at exon locations as well as suppresses the false exons. False exons are the peaks observed in intron loca-tions which do not take part in protein coding. Thus the proposed method is more sensitive to detect true exons which take part in protein coding. Again the execution of reduced sequence due to representation of codons i.e.,
amino acid sequence reduces the computation time to one-third as compared to the execution of whole se-quence of original DNA sese-quence. Thus the proposed method in not only fast but also efficient.
4. CONCLUSIONS
The new proposed predictor for protein coding regions based on the amino acid indicator sequence has good
efficacy. The efficacy of the proposed predictor was evaluated by means of accuracy measures such as exonic peaks, discriminating factor, sensitivity, specificity, ap-proximate correlation, wrong rate and miss rate which shows better performance in coding regions detection when compared to the existing methods. The execution of reduced sequence due to representation of codons i.e.,
amino acid sequence reduces the computation time to one-third as compared to the execution of whole se-quence of original DNA sese-quence. Again the filtering technique with amino acid indicator sequence enables to detect smaller exon regions by showing high peak and minimizes the power in introns giving more suppression to the intron regions. Thus the proposed method is not only fast but also more sensitive.
REFERENCES
[1] Burge, C.B. and Karlin, S. (1998) Finding the genes in genomic DNA. Current Opinion in Structural Biology, 8, 346-354. doi:10.1016/S0959-440X(98)80069-9
[2] Gusfield, D. (1997) Algorithms on strings, trees, and sequences: Computer science and computational biolo- gy. Cambridge University Press, Cambridge.
doi:10.1017/CBO9780511574931
[3] Wang, Z., Chen, Y.Z. and Li, Y.X. (2004) A brief review of computational gene prediction methods. Genomics Proteomics Bioinformatics, 2, 216-221.
[4] Fickett, J.W. (1982) Recognition of protein coding re- gions in DNA sequences. Nucleic Acids Research, 10, 5303-5318. doi:10.1093/nar/10.17.5303
[5] Silverman, B.D. and Linsker, R. (1986) A measure of DNA periodicity. Journal of Theoretical Biology, 118, 295-300. doi:10.1016/S0022-5193(86)80060-1
[6] Tiwari, S., Ramachandran, S. and Bhattachalya, A. (1997) Prediction of probable gene by Fourier analysis of geno- mic sequences. CABIOS, 13, 263-270.
[7] Anastassiou, D. (2000) Frequency-domain analysis of biomolecular sequences. Bioinformatics, 16, 1073-1081. doi:10.1093/bioinformatics/16.12.1073
[8] Anastassiou, D. (2001) Genomic Signal Processing. IEEE Signal Processing Magazine, 8-20.
doi:10.1109/79.939833
[9] Vaidyanathan, P.P. and Yoon, B.J. (2002) Digital filters for gene prediction applications. Proceedings of the 36th Asilomar Conference on Signals, Systems and Compu- ters, 3-6 November 2002, 306-310.
[10] Fuentes, A., Ginori, J. and Abalo, R. (2008) A new pre- dictor of coding regions in genomic sequences using a combination of different approaches. International Jour- nal of Biological, Biomedical and Medical sciences. [11] Jesus, P., Chalco, M. and Carrer, H. (2008) Identification
of protein coding regions using the modified gabor- wavelet tranform. IEEE/ACM Transaction on Compu- tational Biology and Bioinformatics, 5, 198-207.
[12] Galleani, L. and Garello, R. (2010) The minimum entropy mapping spectrum of a dna sequence. IEEE Transaction on Information Theory, 56, 771-783. doi:10.1109/TIT.2009.2037041
[13] Tuqan, J. and Rushdi, A. (2008) A DSP approach for finding the codon bias in dna sequences. IEEE Journal of Selected Topics in Signal Processing, 2, 343-356. doi:10.1109/JSTSP.2008.923851
[14] Akhtar, M., Epps, J. and Ambikairajah, E. (2007) On DNA numerical representations for period-3 based exon prediction. Proceedings of IEEE International Workshop on Genomic Signal Processing and Statistics, Tuusula, 1-4. doi:10.1109/GENSIPS.2007.4365821
[15] Akhtar, M., Epps, J. and Ambikairajah, K. (2008) Signal processing in sequence analysis:Advances in eukaryotic gene prediction. IEEE Journal of Selected Topics in Signal Processing, 2, 310-321.
doi:10.1109/JSTSP.2008.923854
[16] Voss, R. (1992) Evolution of long-range fractal correla- tions and 1/f noise in DNA base sequences. Physical Review Letters, 68, 3805-3808.
doi:10.1103/PhysRevLett.68.3805
[17] Zhang, R. and Zhang, C.T. (1994) Z curves, an intuitive tool for visualizing and analyzing the DNA sequences. Journal of Biomolecular Structure & Dynamics, 11, 767- 782.
[18] Rushdi, A. and Tuqan, J. (2006) Gene identification using the Z-curve representation. Proceedings of IEEE International Conference on Acoustics, Speech and Sig- nal Processing, Toulouse, 14-19 May 2006, 1024-1027. [19] Cristea, P.D. (2002) Genetic signal representation and
analysis. Proc. SPIE Conference, International Biomedi- cal Optics Symposium (BIOS’02), 4623, 77-84.
[20] Brodzik, A.K. and Peters (2005) Symbol-balanced qua- ternionic periodicity transform for latent pattern detec- tion in DNA sequences. Proceedings of IEEE Interna- tional Conference on Acoustics, Speech, and Signal Processing, 5, 373-376.
[21] Rosen, G.L. (2006) Signal processing for biologically- inspired gradient source localization and DNA sequence analysis. Ph.D. Thesis, Georgia Institute of Technology, Atlanta.
transcription terminator prediction. FEBS Letters, 346, 273-277. doi:10.1016/0014-5793(94)00489-7
[23] Nair, A.S. and Sreenathan, S.P. (2006) A coding measure scheme employing electron-ion interaction pseudopoten- tial (EIIP). Bioinformation, 1, 197-202.
[24] Nair, A.S. and Sreenathan, S.P. (2006) An improved digital filtering technique using frequency indicators for locating exons. Journal of the Computer Society of India, 36.
[25] Burset, M. and Guigo, Â.R. (1996) Evaluation of gene structure prediction programs. Genomics, 34, 353-367. doi:10.1006/geno.1996.0298
[26] Rogic, S., Mackworth, A. and Ouellette, F. (2001) Eva- luation of genefinding programs on mammalian sequen- ces. Genome Resarch, 11, 817-832.
doi:10.1101/gr.147901
[27] Kanehisa, M. and Goto, S. (2000) KEGG: Kyoto encyc- lopedia of genes and genomes. Nucleic Acid Research, 28, 27-30. doi:10.1093/nar/28.1.27