Synthetic Workload Generation for Cloud
Computing Applications
Arshdeep Bahga, Vijay Krishna Madisetti
Electrical and Computer Engineering, Georgia Institute of Technology, Atlanta, USA. Email: {arshdeep, vkm}@gatech.edu
Received May 19th, 2011; revised June 18th, 2011; accepted June 26th, 2011.
ABSTRACT
We present techniques for characterization, modeling and generation of workloads for cloud computing applications. Methods for capturing the workloads of cloud computing applications in two different models - benchmark application and workload models are described. We give the design and implementation of a synthetic workload generator that accepts the benchmark and workload model specifications generated by the characterization and modeling of work-loads of cloud computing applications. We propose the Georgia Tech Cloud Workload Specification Language (GT-CWSL) that provides a structured way for specification of application workloads. The GT-CWSL combines the specifications of benchmark and workload models to create workload specifications that are used by a synthetic work-load generator to generate synthetic workwork-loads for performance evaluation of cloud computing applications.
Keywords: Synthetic Workload, Benchmarking, Analytical Modeling, Cloud Computing, Workload Specification Language
1. Introduction
Synthetic workload generation techniques are required for performance evaluation of complex multitier applica-tions such as e-Commerce, Business-to-Business, Bank-ing and Financial, Retail and Social NetworkBank-ing applica-tions deployed in cloud computing environments. Each class of applications has its own characteristic workloads. There is a need for automating the process of extraction of workload characteristics from different applications and a standard way of specifying the workload characte-ristics that can be used for synthetic workload generation for evaluating the performance of applications. The per-formance of complex multitier systems is an important factor for their success. Therefore, performance evalua-tions are critical for such systems. Provisioning and ca-pacity planning is a challenging task for complex mul-ti-tier systems as they can experience rapid changes in their workloads. Over-provisioning in advance for such systems is not economically feasible. Cloud computing provides a promising approach of dynamically scaling up or scaling down the capacity based on the application workload. For resource management and capacity plan-ning decisions, it is important to understand the workload characteristics of such systems and measure the sensitive-
2. Related Work
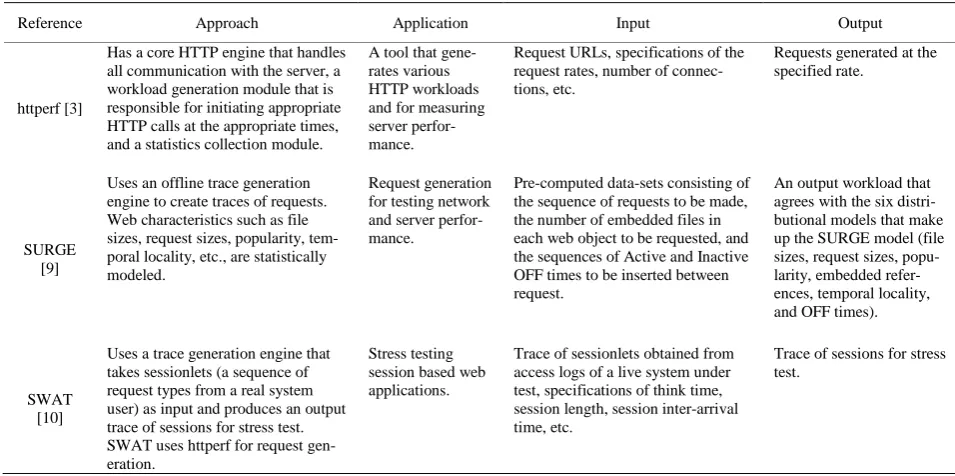
Several studies on analysis and modeling of web work-loads have been done [1-3]. Since obtaining real traces from complex multi-tier systems is difficult, a number of benchmarks have been developed to model the real sys-tems [4-8]. There are several workload generation tools developed to study Web servers such as SPECweb99 [3], SURGE [9], SWAT [10] and httperf [3]. Such workload generation tools repeatedly send requests from machines configured as clients to the intended systems under test. Table 1 provides a comparison of few workload genera-tion tools. Several other tools generate synthetic work-loads through transformation (eg. permutation) of empir-ical workload traces [11-13]. The commonly used tech-niques for workload generation are user emulation and aggregate workload generation. In user emulation, each user is emulated by a separate thread that mimics the actions of a user by alternating between making requests and lying idle. The attributes for workload generation in the user emulation method include think time, request types, inter-request dependencies, etc. User emulation allows fine grained control over modeling the behavioral aspects of the users interacting with the system under test, however, it does not allow controlling the exact time instants at which the requests arrive the system [9]. This is because in user emulation, a new request is issued only after the response to the previous request has been re-ceived. Thus, due to network delays, heavy loads on sys-tem under test, etc, the intervals between successive re-quests increase. Aggregate workload generation is another approach that allows specifying the exact time instants at which the requests should arrive the system under test [14]. However, there is no notion of an indi-vidual user in aggregate workload generation, therefore, it is not possible to use this approach when dependencies between requests need to be satisfied. Dependencies can be of two types - inter-request and data dependencies. An inter-request dependency exists when the current request depends on the previous request, whereas a data depen-dency exists when the current requests requires input data which is obtained from the response of the previous request.
3. Motivation
We now describe the motivation for workload characte-rization and modeling, workload specification and syn-thetic workload generation for cloud computing applica-tions.
3.1. Workload Modeling
Workload modeling involves creation of mathematical models that can be used for generation of synthetic
workloads. Workloads of applications are often recorded as traces of workload related events such as arrival of requests along with the time-stamps, details about the users requesting the services, etc. Analysis of such traces can provide insights into the workloads characteristics which can be used for formulating mathematical models for the workloads.
3.2. Workload Specification
Since the workload models of each class of cloud compu-ting applications can have different workload attributes, there is a need for standardizing the specification of ap-plication workloads. A Workload Specification Lan-guage (WSL) can provide a structured way for specifying the workload attributes that are critical to the perfor-mance of the applications. WSL can be used by synthetic workload generators for generating workloads with slightly varying the characteristics. This can be used to perform sensitivity analysis of the application perfor-mance to the workload attributes by generating synthetic workloads.
3.3. Synthetic Workload Generation
An important requirement for a synthetic workload ge-nerator is that the generated workloads should be repre-sentative of the real workloads and should preserve the important characteristics of real workloads such as in-ter-session and intra-session intervals, etc. There are two approaches to synthetic workload generation: 1) Empiri-cal approach, in which traces of applications are sampled and replayed to generate the synthetic workloads, 2) Analytical approach, which uses mathematical models to define the workload characteristics that are used by a synthetic workload generator. The empirical approach lacks flexibility as the real traces obtained from a partic-ular system are used for workload generation which may not well represent the workloads on other systems with different configurations, load conditions, etc. On the oth-er hand, the analytical approach is flexible and allows generation of workloads with different characteristics by varying the workload model attributes. With the analyti-cal approach it is possible to modify the workload model parameters one at a time and investigate the effect on application performance to measure the application sen-sitivity to different parameters.
4. Current Challenges & Contributions
We now describe the shortcomings in the previous ap-proaches and the contributions in our proposed metho-dology to address these shortcomings.
4.1. Accuracy
Table 1. Comparison of published approaches.
Reference Approach Application Input Output
httperf [3]
Has a core HTTP engine that handles all communication with the server, a workload generation module that is responsible for initiating appropriate HTTP calls at the appropriate times, and a statistics collection module.
A tool that gene-rates various HTTP workloads and for measuring server perfor-mance.
Request URLs, specifications of the request rates, number of connec-tions, etc.
Requests generated at the specified rate.
SURGE [9]
Uses an offline trace generation engine to create traces of requests. Web characteristics such as file sizes, request sizes, popularity, tem-poral locality, etc., are statistically modeled.
Request generation for testing network and server perfor-mance.
Pre-computed data-sets consisting of the sequence of requests to be made, the number of embedded files in each web object to be requested, and the sequences of Active and Inactive OFF times to be inserted between request.
An output workload that agrees with the six distri-butional models that make up the SURGE model (file sizes, request sizes, popu-larity, embedded refer-ences, temporal locality, and OFF times).
SWAT [10]
Uses a trace generation engine that takes sessionlets (a sequence of request types from a real system user) as input and produces an output trace of sessions for stress test. SWAT uses httperf for request gen-eration.
Stress testing session based web applications.
Trace of sessionlets obtained from access logs of a live system under test, specifications of think time, session length, session inter-arrival time, etc.
Trace of sessions for stress test.
defined by how accurately it is able to model the perfor-mance of the application. Accuracy of a benchmarking methodology is determined by how closely the generated synthetic workloads mimic the realistic workloads. Ag-gregate workload generation techniques such as the one used in Geist [14], can run into difficulties when in-ter-request or data dependencies exist. Therefore, we adopt a user emulation approach where the workload characterizations are in the form of the behavior of an individual user. By accurately modeling the application characteristics, request types, inter-request dependencies, data dependencies, transition probabilities, think times, intersession intervals and session lengths, by analysis of traces of applications, our proposed methodology is able to generate workloads that are representative of the real workloads.
4.2. Ease of Use
The existing tools reviewed in the related work section, require a significant amount of hand coding effort for writing scripts for workload generation that take into account the dependencies between requests, workload attributes, etc. For example, TPC-W [7] uses a remote browser emulation (RBE) system for generating work-loads that accepts specifications for workload mix which are provided in separate script files. Furthermore, there are scripts for requests that are executed such that the specified workload mix can be obtained. To add new specifications for workload mix and new requests, addi-tional scripts need to be written. Writing addiaddi-tional scripts for new requests may be complex and time
con-suming as inter-request dependencies need to be take care of. In our proposed approach, we perform an auto-mated analysis of the application traces and extract the application characteristics using the benchmark and workload model generators. Addition of new requests can be done by changing the benchmark model specifica-tion whereas new workload mix can be specified by making changes in the workload model specification. The GT-CWSL code generator accepts these benchmark and workload model specifications and generates the benchmark driver file that drives the synthetic workload generator.
4.3. Flexibility
Our proposed methodology allows fine grained control over the workload attributes such as think time, in-ter-session interval, session length, workload mix, etc. By varying the characterizations of the attributes of the benchmark and workload models, different workloads can be generated to test the system under study and also perform a sensitivity analysis of the performance of the system to various model attributes. Sensitivity analysis is performed by varying one workload characteristic at a time while keeping others constant. Such an analysis is not possible using an empirical approach as it not possi-ble to obtain empirical traces with such varying work-loads.
4.4. Wide Application Coverage
investigated in the past for different classes of applica-tions. For each class of application, different workload specification and generation approaches have been used. Our approach differs from the existing approaches as we provide a generic methodology for extraction of workload characteristics from different classes of applications, cap-turing the workload characteristic in benchmark and workload models and a synthetic workload generator that accepts the workload specifications in the form of our proposed cloud workload specification language (GT- CWSL). The advantage of using two separate models to guide the synthetic workload generation is that the pro-posed workload generation process becomes independent of the application under study. The benchmark model captures the different requests types/operations allowed in the benchmark application, proportions of different re-quest types and the dependencies between the rere-quests. The workload model captures workload attributes such as inter-session interval, think time and session length. Since the synthetic workload generator used in our methodology is generic in nature and generates workloads based on the GT-CWSL specifications, the workload generation process becomes independent of the application.
[image:4.595.68.528.416.693.2]5. Proposed Methodology
Figure 1 shows an overview of our proposed approach for workload characterization, modeling and generation.
5.1. Trace Generation and Analysis
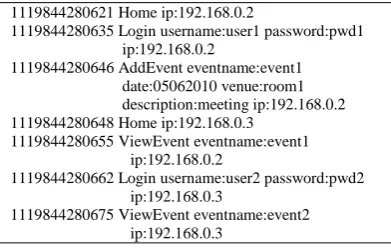
A benchmark application is instrumented to generate traces which have information regarding the user, the requests submitted by the user and the time-stamps of the requests. Typically in the benchmark applications sepa-rate threads are created for each user, where each thread creates an instance of the load driver or the load genera-tion logic. By instrumenting the load driver of a bench-mark application we can obtain the access logs. An ex-ample of a trace generated from a benchmark application is shown in Table 2. Each entry in the trace has a time-stamp, request type, request parameters and user’s IP address. For a benchmark application that uses a syn-thetic workload generator running on a single machine, IP address cannot be used for identifying the users. In that case, the thread-ID (where each thread represents a separate user) is used. The trace generated from a benchmark has all the requests from all users merged into a single file. The trace analyzer identifies unique us-ers/sessions based on the IP address or thread-ID from which the request came. The terms user and session can-not be always used interchangeably because a single user can create multiple sessions. Therefore, we use a time-threshold to identify a session. All requests that come from a single user within that threshold are consi-dered as a single session.
Table 2. Trace generated from a benchmark application.
1119844280621 Home ip:192.168.0.2
1119844280635 Login username:user1 password:pwd1 ip:192.168.0.2
1119844280646 AddEvent eventname:event1 date:05062010 venue:room1 description:meeting ip:192.168.0.2 1119844280648 Home ip:192.168.0.3
1119844280655 ViewEvent eventname:event1 ip:192.168.0.2
1119844280662 Login username:user2 password:pwd2 ip:192.168.0.3
1119844280675 ViewEvent eventname:event2 ip:192.168.0.3
5.2. Modeling Workloads
The trace generated from a benchmark application is analyzed by a trace analyzer. Two different models are generated from the analysis of the traces, 1) Benchmark Model, 2) Workload Model. The attributes of benchmark and workload models are shown in Table 3. The charac-terizations for the attributes of benchmark and workload models are obtained by the analysis of empirical traces obtained from benchmark applications.
a) Session: A set of successive requests submitted by a user constitute a session.
b) Inter-Session Interval: Inter-session interval is the time interval between successive sessions.
c) Think Time: In a session, a user submits a series of requests in succession. The time interval between two successive requests is called think time. Think time is the inactive period between subsequent requests in a session. It is the time taken by the user to review the response of a request and decide what the next request should be.
d) Session Length: The number of requests submitted by a user in a session is called the session length.
e) Workload Mix: Workload mix defines the transi-tions between different pages of an application and the proportion in which the pages are visited.
5.3. Benchmark Model
The benchmark model includes attributes such as opera-tions, workload mix, inter-request dependencies and data dependencies. The benchmark modeling approach in our proposed methodology is based on Probabilistic Finite State Machine (PFSM) Model [15]. A Probabilistic Fi-nite State Machine (PFSM) is a non-deterministic fiFi-nite state machine in which every transition has an associated
Table 3. Attributes of benchmark and workload models.
Model Attributes
Benchmark Model Operations, Workload mix, Inter-request dependencies, Data dependencies Workload Model Inter-session interval, Think time, Session
length
output and a probability. A PFSM M is defined by a tuple, M = (I, O, S, T, P), where I = {a1,, ap} is the finite input alphabet O = {o1,, oq}is the finite output alpha-bet, S = {s1,, sn} is a finite set of states, T is the set of transitions and P is the probability of a transition. Each transition t∈Tis defined as a tuple, t = (s, q, a, o) where s is the current state, q is next state, a is the input symbol and o is the output symbol. For every state s and input symbol a, the sum of probabilities of all the transi-tions out of s on input a is equal to 1.
(
)
,
, , , 1 q o
P s q a o =
∑
A PFSM is represented as a transition graph with n nodes, where each node represents a state. Transitions are represented by directed edges between the states. A directed edge exists between two states s and q only if the associated probability of the transition P(s,q,a,o) > 0.
We now describe the operation of a PFSM. Consider the initial state of the machine to be si. When an input ak is received the machine makes a transition from si to sj with a probability P= (si, sj, ak, ol), and produces the output ol.
For modeling different benchmarks we use PFSM as follows. Each state in the PFSM represents a web-page of the benchmark. The directed edges between states represent the transitions between different pages. Each transition has an input, an output and a probability. In-puts in PFSM represent the operations of the application or the requests submitted by the user. Each opera-tion/request R is defined as a tuple R = (X, D) where X is the request-type and D is the data associated with the request which is represented as key-value pairs.
For representing the data associated with each request in the benchmark model, we use data substitution tags. The data substitution tags are used for generating the dynamic URLs during the synthetic workload generation. A data substitution tag can have two types of functions, 1) data generation, 2) data extraction. Consider the follow-ing URL generated from the benchmark model specifica-tion:
http://Server/App/registerUser.php?name= <generateUsername(5,10)>&password= <generatePwd()>&email=
<generateEmail(“@app.com”)>
The functions used in the data substitution tags such as generateUsername(5,10) are the data generation func-tions, which generate synthetic data. E.g. generateUser-name(5,10) generates a random user name of length be-tween 5 to 10 characters. Now consider another URL shown below:
[image:5.595.59.284.672.721.2]The function extractEventNameFromHTML() used in the data substitution tag is the data extraction function, that extracts the value for the request parameter event-name from the response of the previous HTML page.
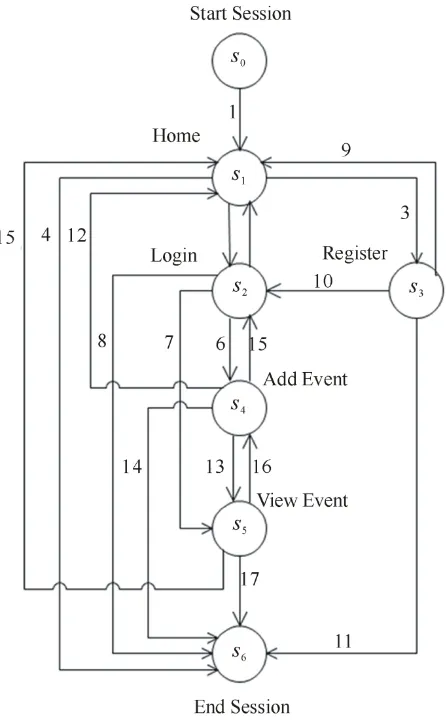
Figure 2, shows the PFSM model for a social event calendar application. Table 4 shows the details of the transitions in the PSFM model for the social event ca-lendar application. Outputs in the PFSM model for an application represent the return values of the opera-tions/requests.
Characterization of Benchmark Model Attributes: Cha- racterization of benchmark model attributes involves identification of different operations/request types in a benchmark application, proportions of different request types, i.e. the workload mix, the inter-request and data dependencies.
[image:6.595.63.286.334.695.2]Given a trace of a benchmark application as shown in Table 2, the benchmark model generator first identifies the unique pages in the application or the request types in the trace, which are the states in the PFSM model. Then
Figure 2. PFSM model for a social event calendar applica-tion.
the transitions between different pages of an application and the proportion in which the pages are visited are identified. These transitions represent the inter-request dependencies. The data associated with each request is also identified, which appears in the trace in the form of request parameters. Table 4 shows an example of a cha-racterization of benchmark model attributes for a social event calendar application.
Benchmark Model Specification: The benchmark mod-el specifications are formulated in as an XML document that is input to the GT-CSWL code generator. Table 5 shows the specifications of the benchmark model for a social event calendar application. The benchmark model specification contains details on various request types in the benchmark application, the request parameters and the transition probabilities for the PFSM model of the benchmark application.
5.4. Workload Model
The workload model includes attributes of the workload such as inter-session interval, think time and session length. The workload model describes the time behavior of the user requests. When multiple users submit requests to an application simultaneously the workload model attributes such as intersession interval, think time and session length are important to study the performance of the application. Think time and session length capture the client-side behavior in interacting with the application. Whereas the inter-session interval is a server-side aggre-gate, that captures the behavior of a group of users inte-racting with the application.
Characterization of Workload Model Attributes: For characterizing the workload model attributes, it is neces-sary to identify independent users/sessions in trace. The trace analyzer identifies unique users and sessions from the trace of a benchmark application. A statistical analy-sis of the user requests is then performed to identify the right distributions that can be used to model the workload model attributes such as inter-session interval, think time and session length. The steps involved in characterizing workload model attributes are as follows:
1) Select Candidate Distributions: We consider four candidate distributions for the workload model attributes, (1) Exponential distribution, (2) Hyper-exponential dis-tribution, (3) Weibull disdis-tribution, and (4) Pareto distri-bution.
Table 4. Transitions in the PFSM model for a social event calendar application.
Transition No. Transition Operation/Request Type Data Probability
1 Start-Home Start Session - 1
2 Home-Login Login <username, user1>, <password, pwd> 0.6
3 Home-Register Register User <username, user1>, <password, pwd>, <email,
0.3
4 Home-End End Session - 0.1
5 Login-Home Home - 0.1
6 Login-AddEvent Add Event <eventname, event1>, <date, 12072010>, <venue,
room1>, <description, meeting>
0.4
7 Login-ViewEvent View Event <eventname, event1> 0.4
8 Login-End End Session - 0.1
9 Register-Home Home - 0.1
10 Register-Login Login <username, user1>, <password, pwd> 0.8
11 Register-End End Session - 0.1
12 AddEvent-Home Home - 0.1
13 AddEvent-ViewEvent View Event <eventname, event3> 0.6
14 AddEvent-End End Session - 0.3
15 ViewEvent-Home Home - 0.1
16 ViewEvent-AddEvent Add Event <eventname, event3>, <date, 05062010>, <venue,
room3>, <description, meeting>
0.6
17 ViewEvent-End End Session - 0.3
per-exponential can be used for modeling think times and inter-session intervals. The difference between hyper- exponential and exponential distribution is that the hy-per-exponential distribution has a larger variance with respect to the mean, whereas an exponential distribution has variance equal to the mean. Pareto distribution is a “heavy-tailed” distribution in which very large values have non-negligible probability. Pareto distribution can be used to model session lengths, where long sessions have a non-negligible probability.
2) Parameter Estimation:Given a set of candidate dis-tributions for the workload model attributes, the parame-ter estimation process identifies parameparame-ters for the dis-tributions that best fit the data. We use the Maximum Likelihood Estimation (MLE) method for parameter es-timation. The MLE method produces the parameter val-ues that maximize the probability of sampling the given data values. Consider a distribution defined by a para-meter θ. The likelihood function to observe a set of samples {x1,, xn}is given by,
(
1)
(
)
1
,., ; ;
n
n i
i
L x x θ f x θ
=
=
∏
where f x
(
i;θ
)
is the distribution for parameter θ. Setting,( )
ln L 0 θ
∂
= ∂
We can find the value of the parameter θ that max-imizes the likelihood.
We use the MLE tool [16], which provides a language for building and estimating parameters of likelihood models. We use the PDF types EXPONENTIAL, HY-PER2EXP, WEIBULL and PARETO supported in MLE. 3) Checking the Goodness of fit: To verify the
good-ness of fit of the distributions with the estimated para-meter values, we perform statistical tests devised by Kolmogorov and Smirnov (KS test) [3]. KS test is based on calculating the maximum distance between cumula-tive distribution function of the candidate distribution and the empirical distribution. We use an online tool available at [17] for performing the KS tests for the ex-periments. The data sets obtained from the logged and estimated distributions for workload model attributes are the input to the online tool, which calculates the maxi-mum distance between the CDFs of the two input data sets.
Workload Model Specification: The workload model specifications are formulated in as an XML document that is input to the GT-CSWL code generator. Table 6 shows the specifications of the workload model for a social event calendar application. The workload model contains specifications for the distributions for the work-load model attributes such as think time, inter-session interval and session length. The GT-CWSL code genera-tor supports Negative-Exponential, Weibull, Hyper-Ex- ponential and Pareto distributions for the workload mod-el attributes.
5.5. Performance Policies
The performance policies specify the service expecta-tions from the benchmark. The performance requirement specifications include a series of service level objectives (SLO’s) that define the performance metrics such as the response time specification for each request in the appli-cation.
5.6. GT-CWSL
Table 5. Benchmark model specification for a social event calendar application.
<?xml version = ”1.0” encoding=”UTF-8”?> <benchmark name = ”SocialEventCalendar”> <requests> <request name=”Home”> <path>/home.html</path></request> <request name=”Login”> <path>/login.php</path> <param name=”username”> <data>getUsername()</data> </param> <param name=”password”> <data>getPassword()</data> </param> </request> <request name=”Register”> <path>/register.php</path> <param name=”username”> <data>generateUsername()</data> </param> <param name=”password”> <data>generatePassword()</data> </param> <param name=”email”> <data>generateEmail()</data> </param> </request> ... ... <request name=”ViewEvent”> <path>/viewEvent.php</path> <param name=”eventname”> <da-ta>extractStringFromHTML(”eventname”)</data> </param> </request> </requests> <workloadMix> <request> <name>Home</name> <r>0</r><r>60</r><r>40</r><r>0</r><r>0</r> </request> <request> <name>Login</name> <r>20</r><r>0</r><r>0</r><r>40</r><r>40</r> </request> <request> <name>Register</name> <r>20</r><r>10</r><r>0</r><r>60</r><r>10</r> </request> <request> <name>AddEvent</name> <r>40</r><r>0</r><r>0</r><r>0</r><r>60</r> </request> <request> <name>ViewEvent</name> <r>40</r><r>0</r><r>0</r><r>60</r><r>0</r> </request> </workloadMix> </benchmark>
chmark requests and workload model attributes such as think time, inter-session interval and session length dis-tribution, using Java annotations. The GTCWSL code generator uses the Faban driver framework [18]. Faban
Table 6. Workload model specification for a social event calendar application.
<?xml version=”1.0” encoding=”UTF-8”?> <workload name=“SocialEventCalendar”> <thinkTime> <distribution>NegativeExponential</distribution> <mean>4000</mean> <min>100</min> <max>20000</max> <deviation>2</deviation> </thinkTime> <interSessionInterval> <distribution>NegativeExponential</distribution> <mean>3000</mean> <min>100</min> <max>15000</max> <deviation>2</deviation> </interSessionInterval> <sessionLength> <distribution>NegativeExponential</distribution> <mean>10</mean> <min>5</min> <max>50</max> <deviation>2</deviation> </sessionLength> </workload>
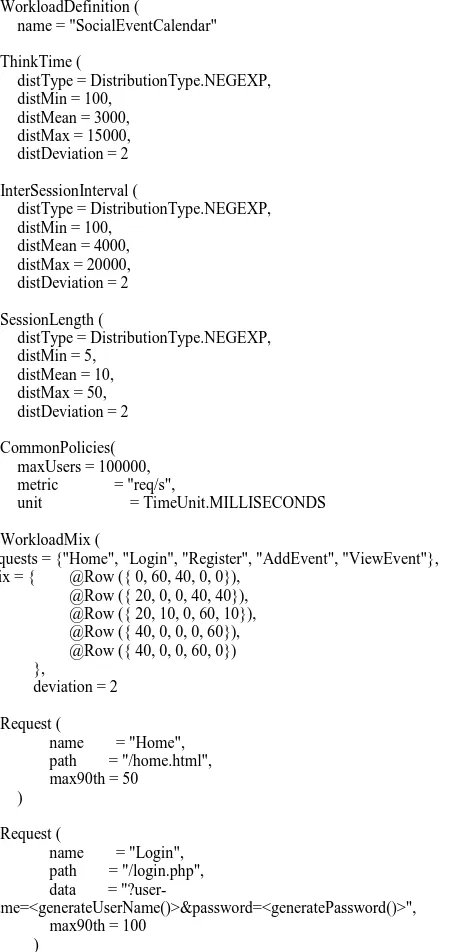
provides a framework for developing workloads (called the Driver Framework) and a mechanism for run execu-tion and management (called the Harness). The GT- CWSL code generator takes the benchmark model, workload model and performance policy specifications as input and generates the benchmark driver file that in-cludes GT-CWSL specifications as Java annotations. Table 7 shows a snippet of the generated GT-CWSL code which forms a part of the benchmark driver logic. The benchmark driver contains the logic defining how to interact with the system under test. The requests speci-fied in the driver are selected for execution in a manner such as to obtain the workload mix specified in the workload model. The benchmark requests which are an-notated as @Request define the logic that is used to gen-erate the load for the system under test. The benchmark requests contain implementations for generation of the requests for the system under test and the data associated with the request. The implementations for the data gen-eration and the extraction functions which are specified in the data substitution tags are provided in the bench-mark driver.
5.7. Run Configuration
[image:8.595.307.539.112.336.2] [image:8.595.56.293.119.655.2]Table 7. Sample GT-CWSL code.
5.8. Test Harness Code
To automate the running of benchmarks and queue mul-tiple benchmark runs we use the Faban Harness infra-structure [18]. The Faban Harness provides a web inter-face to launch and queue benchmark runs and visualize the results. In order to hook the benchmark driver to the Faban Harness a test harness code is required. Although the logic for driving the workload is specified in the benchmark driver file, a mechanism is needed to connect the driver logic to the Faban Harness. This mechanism is
provided using the test harness code. The test harness code defines the process of running the benchmark and the logic for customizing and controlling the behavior of the benchmark. The test harness code includes methods for starting and stopping a run, validation of configura-tion file, configuring the benchmark before a run, pre- processing and post-processing that may be required for a run.
5.9. Synthetic Workload Generation
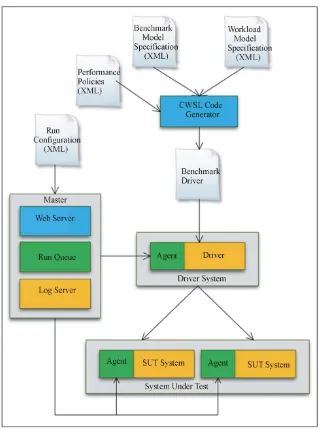
Figure 3 shows the block diagram for the synthetic workload generator used in our proposed methodology. This workload generator is built using the Faban run ex-ecution and management infrastructure [18], which is an open source facility for deploying and running bench-marks. We have extended the Faban Harness to accept GT-CWSL specifications that are generated by the GT-CWSL code generator using the benchmark and workload models. This synthetic workload generator allows generating workloads for multi-tier benchmark applications that are deployed across several nodes in a cloud.
Figure 3 shows the Faban Master agent that controls the Driver agents that run on one or more machines and the system under test (SUT) that can have one or more machines. The different components of Faban are as fol-lows:
1) Master: The Faban master contains a web-server that runs the Faban harness which provides a web inter-face to launch and queue benchmark runs and visualize the results. Multiple benchmark runs can be submitted to the system under test.
2) RunQueue: Run Queue manages the benchmark runs which are run in a first in first out (FIFO) manner.
3) LogServer: Log Server collects pseudo real time logs from the systems under test.
4) Agent: Agent is the mechanism that drives the load. Agents are deployed on both the driver systems and the systems under test. These agents control the benchmark runs and collect the system statistics and metrics which are used for performance evaluation.
5) Agent Thread: Multiple agent threads are created by an agent, where each thread simulates a single user.
6) Registry: Registry registers all the agents with the Master so that the master can submit the load driving tasks to the agents.
7) Driver: Driver is a class supplied by the developer that defines the logic for workload generation, workload characteristics, benchmark operations and the logic for generating requests and the associated data for each of the benchmark operations.
@WorkloadDefinition (
name = "SocialEventCalendar" )
@ThinkTime (
distType = DistributionType.NEGEXP, distMin = 100,
distMean = 3000, distMax = 15000, distDeviation = 2 )
@InterSessionInterval (
distType = DistributionType.NEGEXP, distMin = 100,
distMean = 4000, distMax = 20000, distDeviation = 2 )
@SessionLength (
distType = DistributionType.NEGEXP, distMin = 5,
distMean = 10, distMax = 50, distDeviation = 2 )
@CommonPolicies( maxUsers = 100000, metric = "req/s",
unit = TimeUnit.MILLISECONDS )
@WorkloadMix (
requests = {"Home", "Login", "Register", "AddEvent", "ViewEvent"}, mix = { @Row ({ 0, 60, 40, 0, 0}),
@Row ({ 20, 0, 0, 40, 40}), @Row ({ 20, 10, 0, 60, 10}), @Row ({ 40, 0, 0, 0, 60}), @Row ({ 40, 0, 0, 60, 0}) },
deviation = 2 )
@Request (
name = "Home", path = "/home.html", max90th = 50
) ... @Request (
name = "Login", path = "/login.php", data =
"?user-name=<generateUserName()>&password=<generatePassword()>", max90th = 100
Figure 3. Synthetic workload generation.
5.10. Master Controller
The Master Controller is responsible for controlling the benchmark runs on the system under test. The Master Controller starts and stops the benchmark runs based on the specifications in the run configuration file. In addi-tion to controlling the runs, the Master Controller also collects the runtime metrics from the system under test. Currently in our proposed framework, the Faban Master performs the tasks of the Master Controller.
5.11. Deployment Tools
Our proposed framework uses a number of deployment tools. For deploying the benchmark driver, a benchmark deploy image (jar file) is created from the benchmark
driver file. The Faban Harness provides a utility for dep-loying the benchmark deploy image on the systems under test.
Faban Harness also provides a utility for deplying ser-vices such as Apache2HttpdService, MySQLService, etc. The services which are configured in the run configura-tion are started by the Faban Harness before the bench-mark run starts and stopped after the run completes.
collect information from specific server software during the steady state.
For deploying the benchmark application on the sys-tem under test we developed a deployment utility that transfers the benchmark application files to the web server. The details of the web server on which the benchmark application is deployed (such as the hostname, host port, etc) are specified in a deployment configura-tion file.
6. Experiment Setup
To demonstrate the proposed workload characterization, modeling and generation approach we created benchmark and workload models for the Rice University Bidding System [5] benchmark. RUBiS is an auction site proto-type which has been modeled after the internet auction website eBay. To study the effect the different workload attributes on the response times, we performed a series of experiments by varying the workload attributes such as think time, inter-session interval, session length and number of users. The experiments were performed on a machine with Intel Core i5 3.2 GHz processor, 4 GB memory and 1TB disk space. We used a PHP implemen-tation of the RUBiS benchmark for all the experiments. The benchmark was executed on an Apache-2.2.14 web server and MySQL 5.1.41 database server. We used Sys-tat utility for measuring the system metrics. The perfor-mance metric used for comparison of different runs is the 90th percentile of the response time. To validate that the proposed approach works for a wide range of benchmarks we repeated the above experiments for the TPC-W benchmark [7] that models an online bookstore. We used a Java Servlets version of TPC-W benchmark that works with MySQL database.
7. Performance Evaluation
We instrumented the PHP implementation of the RUBiS benchmark and obtained the traces of the user requests, similar to the trace shown in Table 2. From the analysis of the logged traces the benchmark and workload models were generated. We considered a subset of the request types of RUBiS benchmark for the benchmark model. The distributions for the workload model attributes were estimated using the MLE approach described in Section V. Table 8 shows the KS test results for goodness of fit of the estimated distributions for the workload model attributes. The implementations of the data generation and data extraction functions are provided in the bench-mark driver. From the KS test results it is observed that exponential distributions best fit the logged think time and inter-session attributes, whereas a Weibull distribu-tion best fits the logged session length.
[image:11.595.308.537.103.349.2]Figures 4 - 6 show the comparisons of the cumulative
Table 8. KS test results for workload model attributes.
Attribute Exponential Hyper-
exponential Weibull Pareto
Think time 0.0561 0.132 0.1085 0.587
Inter-session interval 0.0704 0.19 0.0754 0.453
[image:11.595.314.532.387.554.2]Session length 0.405 0.178 0.055 0.679
Figure 4. Comparison of logged and estimated think time distributions for RUBiS benchmark application.
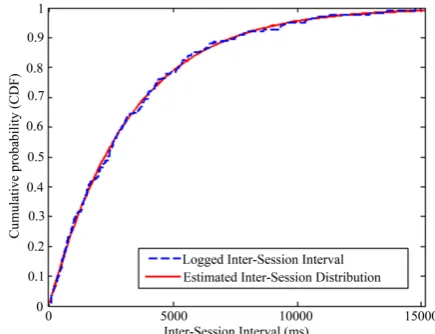
Figure 5. Comparison of logged and estimated inter-session interval distributions for RUBiS benchmark application.
Figure 6. Comparison of logged and estimated session length distributions for RUBiS benchmark application.
Figure 7. Comparison of logged and synthetic think time distributions for RUBiS benchmark application.
Figure 8. Comparison of logged and synthetic inter-session interval distributions for RUBiS benchmark application.
Figure 9. Comparison of logged and synthetic session length distributions for RUBiS benchmark application.
validates that the our proposed approach for workload modeling and generation closely simulates the real workloads.
Figure 10. Effect of think time for RUBiS benchmark ap-plication.
[image:13.595.309.537.494.690.2]Figure 11. Effect of inter-session interval for RUBiS benchmark application.
Figure 12. Effect of session length for RUBiS benchmark application.
Existing approaches such as SURGE [9] and SWAT [10] have used offline trace generation and request gen-eration approach where a trace is first generated that meets the desired workload characteristics and then a request generation engine is used to submit the requests
from the generated trace. The advantage of offline trace generation is that it separates the complex process of computing request parameters and workload attributes from the request submission step. In the request submis-sion process the requests are read from the trace and submitted to the system under test. However, for per-forming rapid sensitivity analysis where only one work-load attribute is changed at a time while keeping others constant, an online trace generation approach is preferred. In the online trace generation and request submission approach, the threads that emulate the users generate and submit the requests to the system under test. Our pro-posed approach differs from the existing approaches as it provides both offline and online traces generation capa-bility, and can be used to perform a rapid sensitivity ana- lysis as shown in Figures 10 - 12.
In order to validate that the proposed approach for workload characterization, modeling and generation works for a wide range of benchmarks we repeated the above experiments for the TPC-W benchmark applica-tion. Figures 13 - 15 show the comparisons of the cu-mulative distribution functions (CDFs) of the logged and estimated distributions for think time, inter-session in-terval and session length respectively for TPC-W benchmark application. Figures 16 - 18 show the com-parisons of the CDFs of the distributions of think time, inter-session interval and session length respectively, of the logged and the generated synthetic workloads for TPC-W benchmark application. From these plots it is observed that the distributions for the workload attributes for the logged and generated synthetic workloads for TPC-W benchmark are very close to each other, which validates that the our proposed approach for workload
Figure 14. Comparison of logged and estimated inter-session interval distributions for TPC-W benchmark application.
Figure 15. Comparison of logged and estimated session length distributions for TPC-W benchmark application.
[image:14.595.59.288.283.476.2]Figure 16. Comparison of logged and synthetic think time distributions for TPC-W benchmark application.
Figure 17. Comparison of logged and synthetic inter-session interval distributions for TPC-W benchmark application.
Figure 18. Comparison of logged and synthetic session length distributions for TPC-W benchmark application.
modeling and generation closely simulates the real wor- kloads.
8. Conclusions & Future Work
[image:14.595.310.540.306.489.2] [image:14.595.58.287.477.693.2]used an analytical modeling approach to represent the behavior of applications and their workload characteris-tics. A methodology for creation of benchmark and workload models was proposed that can be used for modeling different cloud application benchmarks. To specify the benchmark and workload models in a stan-dard way that can be used for synthetic workload genera-tion we briefly proposed the Georgia Tech Cloud Work-load Specification Language (GT-CWSL). A GTCWSL code generator was developed that generates the specifi-cations that are input to a synthetic workload generator. We demonstrated the effectiveness of the proposed me-thodology by modeling the RUBiS auction site and TPC-W online book store benchmarks. Results showed that the generated synthetic workloads closely match the real workloads. With a synthetic workload generator that accepts GT-CWSL specifications it is possible to per-form a sensitivity analysis of the perper-formance of the sys-tem under test to different workload attributes. Future work will focus on adding new attributes to the bench-mark and workload models such as temporal locality, file size, request size, file popularity, etc and performing stu-dies on the effects of these attributes on the performance of different multi-tier applications. Furthermore, we will incorporate a cost model for specifying the cost of the cloud computing services, and incorporate additional performance metrics such as cost per month, maximum number of users that can be served for a fixed cost, cost/request, etc.
REFERENCES
[1] G. Abdulla, “Analysis and Modeling of World Wide Web Traffic,” Ph.D. Thesis, Virginia Polytechnic Institute and State University, Blacksburg, 1998.
[2] M. Crovella and A. Bestavros, “Self-Similarity in World Wide Web Traffic: Evidence and Possible Causes,”
IEEE/ACM Transactions on Networking, Vol. 5, No. 6,
1997, pp. 835-84
[3] D. Mosberger and T. Jin, “Httperf: A Tool for Measuring Web Server Performance,” ACM Performance Evaluation
Review, Vol. 26, No. 3, 1998, pp. 31-37.
[4] D. Garcia and J. Garcia, “TPC-W E-Commerce Bench-mark Evaluation,” IEEE Computer, Vol. 36, No. 2, 2003, pp. 42-48.
[5] RUBiS, 2010. http://rubis.ow2.org
[6] SPECweb99, 2010. http://www.spec.org/osg/web99 [7] TPC-W, 2010. http://jmob.ow2.org/tpcw.html [8] WebBench, 2010.
http://www.zdnet.com/zdbop/webbench/webbench.html [9] P. Barford and M. E. Crovella, “Generating Representa-tive Web Workloads for Network and Server Perfor-mance Evaluation,” Proceedings of the 1998 ACM SIG-METRICS International Conference on Measurement and
Modeling of Computer Systems, Madison, 22-26 June
1998, pp. 151-160.
[10] D. Krishnamurthy, J. Rolia and S. Majumdar, “A Syn-thetic Workload Generation Technique for Stress Testing Session-Based Systems,” IEEE Transactions on Software
Engineering, Vol. 32, No. 11, 2006, pp. 868-882.
[11] A. Mahanti, C. Williamson and D. Eager, “Traffic Analy-sis of a Web Proxy Caching Hierarchy,” IEEE Network, Vol. 14, No. 3, 2000, pp. 16-23. [12] S. Manley, M. Seltzer and M. Courage, “A Self-Scaling
and Self-Configuring Benchmark for Web Servers,” Pro-ceedings of the ACM SIGMETRICS Joint International Conference on Measurement and Modeling of Computer
Systems, Madison, June 1998, pp. 270-271.
[13] Webjamma, 2010.
http://www.cs.vt.edu/chitra/webjamma.html
[14] K. Kant, V. Tewari and R. Iyer, “Geist: A Generator for E-Commerce & Internet Server Traffic,” IEEE Interna-tional Symposium on Performance Analysis of Systems
and Software, Tucson, 4-5 November 2001, pp. 49-56.
[15] E. Vidal, F. Thollard, C. Higuera, F. Casacuberta and R. C. Carrasco, “Probabilistic Finite-State Machines Part I,”
IEEE Transactions of Pattern Analysis and Machine
In-telligence, Vol. 27, No. 7, 2005, pp. 1013-1025.
[16] MLE Tool, 2010.
http://faculty.washington.edu/djholman/mle/index.html [17] Kolmogorov-Smirnov Test, 2010.