doi:10.4236/eng.2011.36069 Published Online June 2011 (http://www.SciRP.org/journal/eng)
Computation of Error in Estimation of Nonlinearity in
ADC Using Histogram Technique
Radhe Shyam Gamad
*, Deepak Kumar Mishra
Department of Electronics & Instrumentation Engineering, S. G. S. Institute of Technology and Science, Indore, India
E-mail: [email protected], [email protected]
Received December 22, 2010; revised May 25, 2011; accepted June 5, 2011
Abstract
Computation of error in estimation of nonlinearity in ADC using histogram test are reported in this paper.
Error determination in estimation of Differential Nonlinearity (DNL) and Integral Nonlinearity (INL) of an
ADC is done by taking deviation of estimated value from actual value. Error in estimated INL and DNL is
determined to check the usefulness of basic histogram test algorithm. Arbitrary error is introduced in ideal
simulated ADC transfer characteristics and full scale simulated sine wave is applied to ADC for computation
of error in estimation of transition levels and nonlinearity. Simulation results for 5 and 8 bit ADC are
pre-sented which show effectiveness of the proposed method.
Keywords:
Nonlinearity, Transfer Characteristics, Code Bin Width, Error Estimation, Transition Levels
1. Introduction
Real life signals are analog in nature and in order to in-terface them with digital processing systems it is neces-sary to convert them in digital using ADC. As ADC plays an important role in deciding accuracy of overall system, testing of an ADC is essential to find out its functional parameters. ADC test duration and its cost increase significantly with resolution of ADC. ADC is usually characterized by its figures of merits like Effec-tive Number of Bits (ENOB), Signal to Noise and Dis-tortion ratio (SINAD), DNL and INL [1,2]. Histogram technique is very popular for testing an ADC to deter-mine several parameters of interest namely, INL, DNL, ENOB, gain error and offset error. Recently work on determination of error in estimation of code transition levels and computation of variance in gain and offsets has been published [3,4].
Also performance of techniques to determine ADC parameters have been evaluated [5,6]. DNL, INL and ENOB are determined based on code transition levels of ADC transfer characteristics [7,8]. If estimation of code transition levels has errors then subsequently it will lead error in estimation of parameters based on code transi-tion levels. In this paper our contributransi-tion is in determina-tion of error in estimadetermina-tion of DNL and INL.
Section 2 presents brief review of earlier work using
histogram technique. Mathematical formulae developed for computing error in estimation of nonlinearity are presented in Section 3. Simulation results for 5 and 8 bit ADC are reported in Section 4. Conclusions are pre-sented in Section 5.
2. Earlier Work Done on Histogram
Technique
A sinusoidal stimulus signal with frequency (f), ampli-tude (A), and offset (O) is applied to the ADC under test and predefined number of samples, M, with sampling frequency (fs) are acquired. The expression used to esti-mate the transition levels, T[k], of an ADC with N bits is given as [3,9].
[
]
1ˆ 1 π, 1, 2,cos , 2Ck N
T k O A K
M
−
+ = − ⋅ =
(1)
where
[ ]
1
0
k
k i
C h i
−
=
=
∑
.[ ]
h i = The total number of samples received in code bin i.
as:
[ ]
T k[ ]
O U kA
−
= (2)
For any particular values of gain and the offset, the DNL and INL can be determined without additive noise and overdrive as follows [10,11].
[ ]
GW K Q DNL
Q
−
= (3)
[
K 1]
Q T[ ] [ ]
1 T K INLQ
− ⋅ + −
= (4)
where, G = gain, W[k] = Kth code bin width and Q = ideal code bin width.
3. Estimation of Nonlinearity
DNL is deviation of actual code bin width from ideal code bin width and INL is maximum deviation of actual transfer characteristics from ideal or best fit transfer characteristics. Estimate values of parameter are com-puted when additive noise and overdrive effects are con-sidered. Considering additive noise, estimate of DNL and INL can be expressed as follow. In all formulae this symbol ٨ on top of parameter indicates estimate value.
[ ]
ˆˆ ˆ ˆˆ
GW K Q DNL
Q
−
= (5)
where, estimated code bin width = ˆ ˆ 2N 2
V Q=
− ,
[ ]
ˆ 2N 1 1
V =T − − T or Vˆˆˆ= −L F
Similarly estimate of INL can be expressed as:
[ ]
{
ˆˆ ˆ}
ˆ
ˆ
ideal K
G T K O T INL
Q
⋅ + −
= (6)
where from [2,3,12]:
ˆ ˆˆ ideal ideal L F G L F − = −
where, L = Last transition level, F = First transition level.
Therefore,
ˆˆ ˆ
2N 2 L F Q= −
− (7)
[ ]
[
] [ ]
ˆˆˆ 1W K =T K+ −T K (8)
Error Estimation in DNL and INL
From Equations (3) and (5), estimation error of DNL can be written as:
ˆ est
DNL
e =DNL −DNL (9) Similarly from Equations (4) and (6), estimation error of INL can be given as:
ˆ est
INL
e =INL −INL (10)
4. Results and Discussion
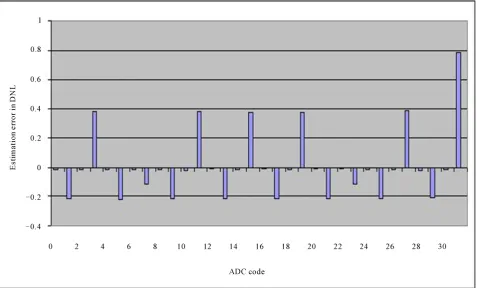
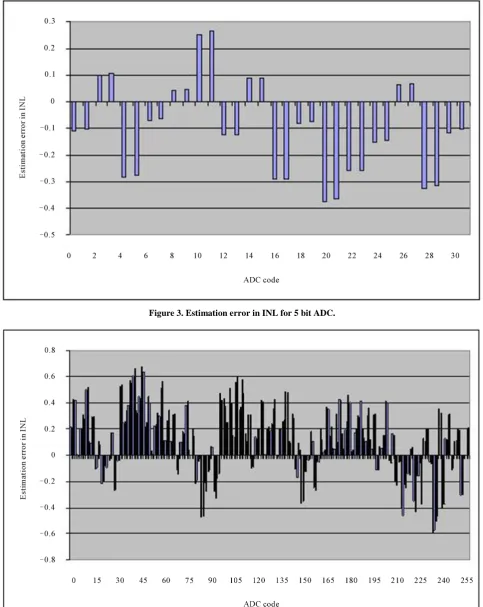
Ideal ADC transfer characteristics for 5 and 8 bit resolu-tion are simulated and arbitrary nonlinearity error is in-troduced in their transfer characteristics. Simulated full scale sine wave with 0.98 MHZ frequency with slight over derives is applied to the ADC and large number of samples at 5 MHZ sampling frequency are collected. In first case using standard histogram technique code tran-sition levels are computed after introducing DNL error in ADC transfer characteristics. Further error in code tran-sition level estimation is determined. Error determination in estimation of DNL is done and is shown in Figure 1 and Figure 2 for 5 and 8 bit ADC respectively with re-spect to ADC code. Error variation in DNL estimation is observed with maximum value of approximately of 0.4 LSB and minimum value of <−0.2 LSB as shown in Figure 1 for 5 bit ADC. Similarly for 8 bit ADC maxi-mum value of error is observed and is equal to 0.5 LSB and minimum value equal to −0.2 LSB as shown in Fig-ure 2. Also arbitrary INL error is introduced in 5 and 8 bit ADC transfer characteristics and computation of error in INL estimation is done and is shown in Figure 3 and Figure 4 for 5 and 8 bit ADC respectively. Though in this paper results for 5 and 8 bit ADC are presented but same test technique can be used for testing ADC with higher resolution.
5. Conclusion
This paper reports effects of additive noise and overdrive in computation of estimation error in DNL and INL of 5 and 8 bit ADC. Estimate value is taken when effects of additive noise and overdrive are considered. While actual value is considered without additive noise and overdrive. Estimation error is determined by taking difference of estimate value and actual value. Simulation of ideal ADC transfer characteristic is done and arbitrarily nonlinearity error is introduced in it. Simulation results for estimation error in DNL and INL are reported for 5 and 8 bit ADC.
6. Acknowledgements
[image:2.595.56.291.395.689.2]Figure 1. Estimation error in DNL for 5 bit ADC.
Figure 3. Estimation error in INL for 5 bit ADC.
Figure 4. Estimation error in INL for 8 bit ADC.
[image:4.595.55.539.79.687.2]by Ministry of Information and Communication Tech-nology, Government of India. Authors are thankful to the Ministry for the facilities provided under this project.
7. References
[1] P. D. Capofreddi and B. A. Wooley, “The Use of Linear Models in A/D Converter Testing,” IEEE Transactions on Circuits and Systems –I, Vol. 44, No. 12, 1997, pp. 1105-1113.
[2] IEEE std. “IEEE Standard for Digitizing Waveform Re-corders,” 1057-1994.
[3] F. C. Alegria and A. C. Serra, “Standared Histogram Test Precision of ADC Gain and Offset Error Estimation,”
IEEE Transactions on Instrumentation and Measurement, Vol. 56, No. 5, 2007, pp. 1527-1531.
[4] F. C. Alegria and A. C. Serra, “Error in the Estimation of Transition Voltages with the Standard Histogram Test ADCs,” ELSEVIER International Journal on Measure-ment, Vol. 35, 2004, pp. 389-397.
[5] H-W. Ting, Bin-Da Liu and S-Jyh. Chang, “A Histogram - Based Testing Method for Estimating A/D Converter Performance,” IEEE Transactions on Instrumentation and Measurement, Vol. 57, No 2, February 2008, pp.
420-427
[6] R. S. Gamad and D. K. Mishra, “Gain Error, Offset Error and ENOB Estimation of an A/D Converter Using Histo-gram Technique,” Measurement, Vol. 42, No. 4, May 2009, pp. 570-576.
[7] D. K. Mishra, “Dynamic Testing of High Speed A/D Converters Using Triangular Wave as Input Test Signal,”
IE (I) Journal-ET,Vol. 85, 2005, pp. 68-71.
[8] R. S. Gamad and D. K. Mishra, “Determination of Error in Nonlinearity Estimation in A/D Converter with Trian-gular Wave Input,” International Journal of Electronics, Taylor and Francis, Vol. 96, No. 12, 2009, pp. 1237-
124
[9] D. K. Mishra, N. S. Chaudhary and M. C. Shrivastava, “New Dynamic Test Methods for Determination of Non-linearity and Effective Resolution of A/D Converters,”
IETE Journal of Research (INDIA), Vol. 43, No. 6, 1997, pp. 403-409.
[10] IEEE std. “IEEE Standard for Terminology and Test Methods for Analog to Digital Converters,” 2000.
[11] J. Blair, “Histogram Measurement of ADC Nonlinearity Using Sine Waves,” IEEE Transactions on Instrumenta-tion and Measurement, Vol. 43, No. 3, 1994, pp. 378- 383.