1
Happy hosts?
International tourist arrivals and residents’ subjective well-being in Europe
Forthcoming in the
Journal of Travel Research
Artjoms Ivlevs
1Bristol Business School (UWE Bristol) and IZA
ABSTRACT
While there has been a growing interest in the relationship between perceived tourism impacts and residents’ quality of life, little is known about how residents’ well-being is affected by actual tourist arrivals. This paper studies the effect of international tourist arrivals on the subjective well-being – happiness and life satisfaction – of residents in European countries. Data come from the six waves of the European Social Survey, conducted in 32 countries in 2002-2013. The results of the OLS fixed-effects and instrumental-variable estimations suggest that tourist arrivals reduce residents’ life satisfaction. This negative relationship tends to be more pronounced in countries where tourism intensity is relatively high, as well as among people living in rural areas. In addition, tourist arrivals have a greater negative relationship with the evaluative component of subjective well-being (life satisfaction) than its affective component (happiness).
Keywords: life satisfaction; happiness; tourist arrivals; Europe; instrumental variable analysis
1Department of Accounting, Economics and Finance, Bristol Business School, University of West of England,
2
INTRODUCTION
Understanding the effects of tourism on host populations has long been a question of primary importance for both academics and policymakers. Tourism affects various aspects – economic, social, cultural, environmental – of life in host societies (Kim, Uysal, and Sirgy 2013), and the substantial literature studying these effects is far from unanimous as to whether tourists change hosts’ lives for better or for worse. One the one hand, residents benefit from tourism via
enhanced economic activity, upgrade of recreational facilities, organization of festivals, opening of restaurants, revitalization of local cultures and investments in environmental infrastructure; on the other hand, tourism may increase the cost of living, contribute to noise pollution, crowding, traffic, begging and crime problems, disrupt traditional cultures and ways of life, and lead to environmental degradation (see, for example, Andereck et al. (2005) andKim, Uysal, and Sirgy (2013) for extensive reviews of tourism impacts at the community level). The recent decision of the mayor of Barcelona to limit tourist numbers (Paris 2015) provides a vivid example of a negative net effect of mass tourism on the well-being of local residents. Similar voices of local dissatisfaction are being heard across many popular tourist destinations in Europe (BBC 2009; Pidd 2011; Ross 2015).
In an attempt to gauge the effects of tourism on the well-being of host populations from a more holistic perspective, recent literature has started addressing the impacts of tourism on residents’ quality of life and its various manifestations, such as subjective well-being (Andereck and Nyapuane 2011; Kim, Uysal, and Sirgy 2013; Nawijn and Mitas 2012; Nguyen, Rahtz, and Shultz, 2014; Woo et al. 2016; Woo, Kim, and Uysal 2015). Most of these contributions have focused on individual perceptions of tourism impacts in specific tourist-receiving communities, and have generally found a positive association between the perceived value of tourism and well-being: people who think that tourism is beneficial (either for them personally or for the
3
if so, how (positively or negatively)? Are the well-being effects of tourism more pronounced in countries with relatively high tourist inflows? Is the subjective well-being of particular socio-demographic groups, such the elderly, the low-skilled and rural residents, more likely to be affected by tourism? Does tourism affect the two main components of subjective well-being – life satisfaction and happiness – differently?
Finding answers to these questions is important from a policy perspective. First, in many countries across the world, governments and policymakers have recognized the potential of tourism for national and regional development and actively promoting tourism-enhancing policies (World Tourism Organization, 2015). As the numbers of tourists grow, policymakers may be interested in how tourism affects not only the economic outcomes but also the overall quality of life and subjective well-being of host populations. It is also of policy interest whether these well-being effects differ between countries with more and less intense tourist inflows, and whether tourism has a differential impact on the well-being of different socio-demographic groups. Answers to these questions would lead to a broader and deeper understanding of the well-being effects of tourism, which in turn could help inform and design more successful tourism development policies. Second, subjective well-being – a variable of primary interest in this study – is becoming an important policy measure in its own right. Governments across the world have been adopting different measures of subjective well-being to capture individual welfare and societal progress, and guide policymaking (O’Donnell et al. 2014; OECD, 2013; Office for National Statistics, 2013). Recent evidence suggests that subjective well-being has a number of objective benefits: more life-satisfied and happier people live longer, are healthier, more productive, more creative and more sociable (De Neve et al. 2013). Thus, tourism planners should be interested in designing and adopting tourism policies which enhance, or at least do not reduce, people’s subjective well-being.
4
subjective well-being of tourists themselves (Bimonte and Faralla 2012; Chen and Petrick 2013;
Chen, Huang, and Petrick 2016; Dolnicar, Yanamandram, and Cliff 2012; Gilbert and Abdullah
2004; Kroesen and Handy 2014; McCabe and Johnson 2013; Nawijn and Veenhoven 2011; Neal,
Uysal, and Sirgy 2007; Pagan 2015; Sirgy et al. 2011; Uysal et al. 2016). However, much less is
5
TOURISM AND SUBJECTIVE WELL-BEING OF RESIDENTS: RELATED LITERATURE, THEORETICAL CONSIDERATIONS AND HYPOTHESES
Defining subjective well-being
Life satisfaction and happiness are the most frequently used representations of subjective well-being in the academic literature, and both are well-being adopted as core measures of well-well-being in policy circles. The two measures are positively correlated and are often used interchangeably. However, important differences between the two variables exist. Life satisfaction is the
evaluative/cognitive component of subjective well-being and happiness is its hedonic/affective component. Life satisfaction draws on how people remember things and think about life, while happiness draws on how people experience life (Kahneman and Riis 2005). Some differences also arise in their relationships with other variables. For example, life satisfaction has been shown to generally increase with education whereas the relationship between education and hedonic measures of well-being is less clear-cut; similarly, happiness tends to saturate with income beyond a certain point and life satisfaction does not (Kahneman and Deaton 2010; O’Donnell et al. 2014). Recently, in their guidelines on measuring subjective well-being, the OECD have recommended using life satisfaction as a core measure of subjective well-being, and complementing it with measures of positive and negative affect (happiness, sadness, stress) whenever possible (OECD, 2013). This paper uses both life satisfaction and happiness measures
and, among other things, tests whether they respond differently to tourist inflows.
6
Perceptions of tourism impacts and subjective well-being: review of related literature
Recent literature suggests that the perceived value of tourism is an important positive
determinant of residents’ quality of life and subjective well-being. For example, Woo, Kim, and Uysal (2015), using a sample of 407 respondents across five tourism destinations in the US, found a positive association between the perceived value of tourism and the overall quality of life (of which overall life satisfaction was one component), as well as its non-material (health, emotional life, community life) and material (financial situation) domains. Moreover, the study revealed that the overall quality of life was positively associated with support for further tourism development. Kim, Uysal, and Sirgy (2013), using a survey of 321 respondents from Virginia, found that individual perceptions of the economic, social, cultural and environmental impacts of tourism significantly predicted, respectively, material, community, emotional, and health and safety satisfaction. The study also found that the strength of the relationship between various tourism impacts and well-being domains varied according to the stage of tourism development of the respondents’ community/place of residence: the relationship between the economic and social impacts of tourism and satisfaction with corresponding life domains was strongest in the maturity stage of the tourism development cycle, while the strength of the cultural and
environmental pairs peaked during the decline stage.
7
present life characteristics. Finally, Nguyen, Rahtz, and Shultz (2014), using data collected through an ethnographic approach in the La Hang community of Vietnam, found that local citizens, and especially older people (whose memories of past economic hardships were still fresh), felt that their quality of life had improved because of the implemented tourism development policies.
These studies have much in common: they concentrate on communities that have hosted tourists (which ensures that local residents are able to form an opinion about tourism impacts), and generally adopt a static perspective, i.e. particular communities are observed only at one point in time (and not repeatedly/over time). Importantly, the central variable in all these studies is the residents’ perceptions of tourism impacts, and these perceptions are generally found to be positively associated with various manifestations of subjective well-being. What remains less well understood is how the subjective well-being of residents responds to changes in actual tourist arrivals. This is the main question asked in this paper, and the remainder of this subsection will provide the intuition behind possible answers to this question, conceptualizing the channels through which tourist inflows might affect residents’ subjective well-being and outlining testable hypotheses.
Tourist inflows and subjective well-being of residents: possible channels and hypotheses to be tested
Tourist arrivals can affect residents' well-being through at least two channels. First, tourism affects various domains of residents’ lives (employment, health, social life etc.) and,
consequently, their subjective well-being; note that residents may or may not be aware that these effects come from tourism. Second, tourists affect residents’ well-being through actual
encounters. In addition, it can be argued that, within a particular country, tourist inflows can affect the well-being of residents who live in both tourist and non-tourist areas.
8
effects may differ across the tourism development cycle. During the early stages of the cycle, one might expect that an increase in tourist arrivals will result in relatively high benefits (e.g. new jobs are being created, new recreational facilities opened, locals like the diversity brought about by tourism) and relatively low costs (tourist inflows are still not high enough to drive the prices up, undermine community identity, or produce environmental damage). As the locality becomes more established as a tourist destination and tourist inflows grow, the scope for economic and social improvements for local residents reduces (e.g. most unemployed people have found jobs, and the numerous new cafés, visited mostly by tourists, do not thrill locals any more) and the scope for damage increases (e.g. prices increase, noise, traffic, pollution,
gambling, begging and crime problems arise, and locals may feel that their community loses its true identity). Taken together, the subjective well-being of residents living in tourist areas could increase with tourist arrivals during the incipient stage of the tourism development cycle and decrease during the rapid growth stage.
This reasoning links to the literature on the perceived effects of tourism on residents’ subjective well-being (Andereck and Nyapuane 2011; Kim, Uysal, and Sirgy 2013; Nawijn and Mitas 2012; Nguyen, Rahtz, and Shultz, 2014; Woo, Kim, and Uysal 2015). In addition, Kim, Uysal, and
Sirgy (2013) highlight the role of the tourism life cycle on explaining the relationship between
perceived tourist impact and well-being, and Vargas-Sanchez et al. (2011) document more negative attitudes towards additional tourism development in areas with higher tourist density. A crucial difference between the perceived impacts research and the current study is that we
assume that a resident may or may not associate tourism impacts with tourism. For example, crime or environmental problems caused by tourism may be perceived by locals as coming from other sources or locals may have no idea what contributes to them, yet such negative tourism externalities will still reduce residents’ well-being.
9
lives. People in non-tourist areas may even directly benefit from country-wide tourism, if the growing tourism industry generates extra demand for goods and services produced at non-tourist localities (Cai, Leung, and Mak 2006); note that here again residents may or may not be aware that these benefits are generated by the tourism industry expanding elsewhere in the country. On the other hand, as tourist numbers grow elsewhere in the country, people in non-tourist areas may realise that they live in a place which is not attractive enough for visiting. A feeling that life is getting better elsewhere (as evidenced by the increasing numbers of visitors) – even if it is not necessarily getting worse where one lives – may result in a sense of relative deprivation, which, in turn, can have a negative effect on subjective well-being (D’Ambrosio and Frick 2007; Luttmer 2005; Miles and Rossi 2007).
As tourist arrivals grow, tourist destinations are more likely to encounter social and
environmental problems. People in non-tourist areas might become aware about these problems through media: for example, noise, crime, environmental, and loss-of-identity issues brought about by large tourist inflows are likely to be covered by the national news channels. This may render residents less happy. Residents of non-tourist areas may also feel that they do not benefit from the economic, social and cultural opportunities generated by tourism, but are still affected by the industry’s environmental externalities; Bestard and Nadal (2007) use this conjecture to explain why the Balearic Islands’ residents living in municipalities with a lower density of tourism have more negative attitudes towards tourism. On the whole, it is reasonable to expect that people living outside tourist destinations can also be affected by tourism to their country. The net effect is likely to be neutral during the early stages of the tourism development cycle and become more negative as tourism in the community rapidly grows.
The second channel through which tourist inflows may affect the well-being of residents relates to actual encounters/contact with tourists. When tourist inflows are relatively low, people living in tourist destinations may enjoy interacting with guests, helping them to get around, practicing foreign language skills and feeling proud of the local community. However, too many encounters with tourists, which happens when tourist inflows are relatively high, can result in more
10
individuals’ subjective well-being, one might again expect tourism to have more of a negative effect on the well-being of residents when tourist intensity is high.
Note that people living in non-tourist areas can also have encounters with tourists. When visiting particular places (e.g. the capital, a regional center or a particular holiday resort) within one’s country of residence on a regular basis, people from non-tourist areas may notice, and find it striking, how tourist presence transforms the character of these places. A longstanding preferred seaside resort may, for example, have become a difficult-to-penetrate foreign visitor settlement, or a regional center where a resident studied many years ago may have become a prime tourist destination. So, observing increasing numbers of tourists in places to which people had been previously attached, residents may develop feelings of sadness and discontent, which, in turn, can reduce subjective well-being. Taken together, one can expect the well-being of residents living in both tourist and non-tourist areas to be affected by actual encounters with tourists. The higher the tourist inflow rate, the more negative the effect of additional tourist arrivals on resident well-being is likely to be.
One must also consider the relevance of the two channels – the net effect of tourism and actual encounters with tourists – for different manifestations of subjective well-being. Arguably, life satisfaction – the cognitive/evaluative component of well-being – will be more responsive to the effects of tourism, while happiness – the hedonic/emotional component – will be more
responsive to actual encounters with tourists. This is because life satisfaction draws on
reflection/thinking about life (and assumes a longer-term perspective) whereas happiness draws on experiencing life and the effects of spontaneous events (Kahneman and Riis 2005), such as unintentional encounters with tourists. On the whole, if one of the two channels dominates, tourist arrivals will not affect life satisfaction and happiness in the same manner.
Finally, it can be argued that not everyone’s well-being is affected by tourist encounters in the same manner. In particular, older and less educated people, as well as rural residents, are may be affected by tourism more negatively. Older people may attach particular importance to
11
not have good foreign language skills and, therefore, might experience frustration from not being able to communicate with foreign guests; in contrast, more educated residents would speak foreign languages well and feel happy at being able to establish cross-cultural dialogues. Finally, people living in rural areas might be accustomed to daily lives where people know each other, and thus find the presence of unfamiliar tourists disruptive; in contrast, life in urban areas implies frequent interaction with unfamiliar people, which may make urban dwellers more likely to accept diversity brought about by tourism. These conjectures echo the fact that the elderly, the less educated and people living in rural areas are more opposed to globalization and its various manifestations, such as immigration, free trade and imported products (Bell and Blanchflower 2011; Facchini and Mayda 2008; Fennelly and Federico 2008; Juric and Worsley 1998; Mayda and Rodrik 2005).
Drawing on this discussion, the following hypotheses are formulated:
H1: Tourist arrivals have a negative effect on the subjective well-being of residents.
H2: The effect of tourism arrivals on residents’ well-being is moderated by tourism density: the effect is more negative where tourism density is higher.
H3: Tourist arrivals have a differential effect on life satisfaction and the happiness of residents.
H4: The effect of tourism arrivals on residents’ well-being is moderated by the respondents’ age, education and area of residence: the effect is more negative for older, less educated and rural residents than for younger, more educated and urban respondents,
12
METHODS
Model specification
The general model explaining the effects of country-level tourist inflows on the subjective well-being of resident populations can be expressed as follows:
Subjective well-beingi,j,t = β0 + β1 tourist arrivalsj,t + β2 individual-level controlsi,j,t +
β3 country-level controlsj,t + β4 country fixed effectsj +
β5 year fixed effectst + error termi,j,t (1)
where the subjective well-being of individual i living in country j in year t is modelled as a function of the country-level tourist arrivals (which change yearly), typical individual-level determinants of subjective well-being (such as age, gender, education, income, and health), and country-level variables, such as GDP growth, unemployment and inflation rates (which change yearly). Given the repeated-cross-section structure of the data (interviews are conducted in several countries over several years), the model includes dummy variables for all countries (country fixed effects) and years (year fixed effects). Country fixed effects account for all time-invariant, country specific factors affecting both subjective well-being and tourist inflows. Year fixed effects account for the time trends in subjective well-being and tourist inflows which are common for all countries included in the analysis.
Data sources
The estimation of the model necessitates data at both the individual and country level.
13
In each ESS country-round respondents were selected using strict random sampling techniques, and the national samples are representative of the participating countries’ resident populations aged 15 and over (no upper age limit). Approximately one hour long face-to-face interviews were based on the ESS source questionnaire, which was designed in English and then translated into each language that is used as a first language by at least 5% of a participating country population. To ensure cross-country comparability, all methods and procedures related to data collection and processing were standardized across the participating countries. More information on the ESS design methodology is available on the ESS project website
(http://www.europeansocialsurvey.org/).
The country-level data are sourced from the World Development Indicators – a collection of country-level statistics compiled by the World Bank from officially-recognized national and international sources. The dataset contains statistics on annual country-level international tourist arrivals (sourced from the Yearbook of Tourism Statistics of the World Tourism Organization), as well as macroeconomic indicators such as GDP growth, inflation and unemployment.
Variables
Dependent variable(s): subjective well-being
The ESS contains two questions which are used to construct two measures of subjective well-being: life satisfaction and happiness.ii These questions are:
“All things considered, how satisfied are you with your life as a whole nowadays?”
“Taking all things together, how happy would you say you are?”
14
Main regressor: tourist inflows
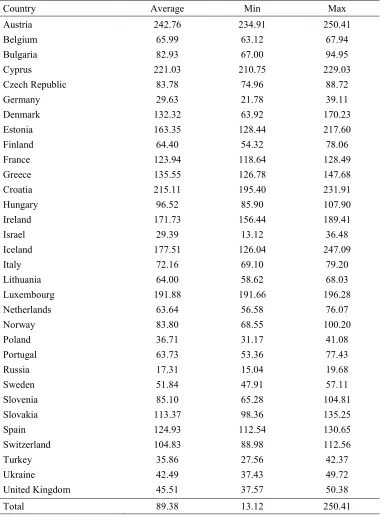
Tourist inflows are captured by the annual arrivals of international tourists, defined as people “who travel to a country other than that in which they usually reside, for a period not exceeding 12 months and whose main purpose in visiting is other than an activity remunerated from within the country visited.” To ensure these data are internationally comparable, tourist arrivals are expressed as a percentage of the host country population in the same year (annual population data sourced from the World Development Indicators). Table 1 reports the average tourist arrival rates and their range (maximum and minimum values) for 2002-2013 for the countries included in the analysis.
[INSERT TABLE 1 ABOUT HERE]
Individual-level controls
Following the empirical literature on the micro-determinants of subjective well-being, all
estimations include the following individual-level controls: age (in years) and its square, years of completed education, household size, dummy variables for gender, being married/living with a partner, four household income levels (low, medium and high – corresponding to the three within-country household income thirtiles – plus a dummy for non-reported income), four subjective evaluations of household income (living comfortably on present income, coping on present income, difficult on present income, and very difficult on present income), having children, unemployed and actively looking for a job, unemployed and not looking for a job, five levels of subjectively evaluated health (very good, good, fair, bad, very bad), five types of urbanization (a big city, suburbs or outskirts of big city, town or small city, country village, and farm or home in countryside), and a measure of religiousness, based on the question “How religious you are?” (with answers ranging from 1 (not at all religious) to 10 (very religious)).
15
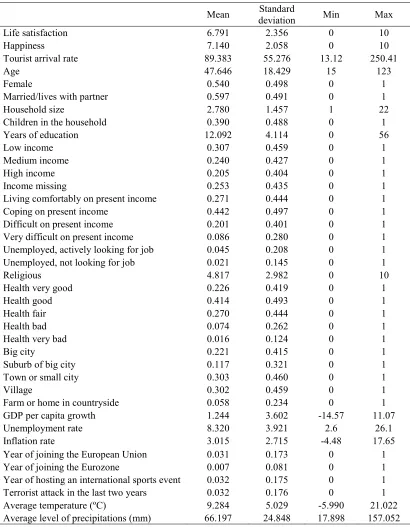
Controls are included for several country-level variables and major events that may have affected residents’ subjective well-being as well as tourist arrivals. These variables are: GDP growth rate, inflation rate, unemployment rate, joining the European Union in the year of the interview, joining the Eurozone in the year of the interview, hosting a major sports event (Olympic games, World or European Football Cup) in the year of the interview, terrorist attack in the year of the interview or the year before, average temperature in the year of the interview and its one-year lagged value, average level of precipitations in the year of the interview and its one-year lagged value. The summary statistics of all the variables included in the analysis are reported in Table 2.
[INSERT TABLE 2 ABOUT HERE]
Estimation strategy
Given the categorical and ordered nature of the dependent variable (happiness and life satisfaction), it would be appropriate to estimate Equation 1 with a non-linear model, such as ordered logit or probit. However, the empirical literature on subjective well-being has often employed Ordinary Least Squares (OLS), effectively assuming cardinality of the happiness and life satisfaction indices (Ferrer-i-Carbonell and Frijters 2004). The OLS and non-linear models produce qualitatively similar results (Ferrer-i-Carbonell and Frijters 2004; Ferrer-i-Carbonell and Ramos 2014), and a particular advantage of estimating subjective well-being models with OLS is the ease of result interpretation. This paper follows the literature and employs the (fixed effects) OLS as the main method of estimation. The corresponding ordered probit and logit models have also been estimated as a robustness check; the results were consistent with OLS and are available on request.
16
Subjective well-beingi,j,t = β0+ β1 tourist arrival rate2j,t + β2 country-level controlsj,t +
β3 individual-level controlsi,j,t + β4 country fixed effectsj +
β5 year fixed effectst + error termi,j,t (2)
Note that the tourist arrival rate and its squared term are not jointly included in the same model. This is because such a specification would assume an underlying U-shaped relationship between the tourist arrival rate and subjective well-being.
It is important to note that, when estimated with OLS, the coefficients of interest (β1in Models 1
and 2) should be interpreted as conditional correlations rather than causal effects. While a broad range of potential country-level confounding variables have been included as controls, there may still be some omitted variables driving both subjective well-being and tourist arrivals. To
mitigate this endogeneity issue and move closer to causal evidence, this study employs the instrumental variable method. This method relies on the availability of an instrument – a variable that is highly correlated with the endogenous regressor (tourist arrival rate) and that affects the outcome variable (residents’ well-being) only through this endogenous regressor. The average of the tourist arrival rates in years t-1 and t-2 will be used as an instrument for the current (year t) tourist arrival rate: it is expected that past tourist arrivals predict the current arrival rate well, and one can reasonably assume that they have limited direct influence on the current well-being of the residents. The estimation consists of two stages: 1) in the first stage, the tourist arrival rate is regressed on the instrument and all the control variables, and 2) in the second stage, the predicted values of the first stage dependent variable are used as a regressor, alongside all the control variables. The standard F test of the excluded instrument will be used to test its relevance.iii For more information on the instrumental variable technique and its application in tourism research, see e.g. Belenkiy and Riker (2012).
17
allows increasing the temporal variation of the data, which is why the empirical analysis relates the subjective well-being of residents to tourist arrivals in a particular year (rather than in a two year wave).
18
RESULTS
OLS results
Table 3 reports the results of the OLS fixed-effects models for the whole sample. In the linear specification (columns 1 and 2) the coefficient of the tourist arrival rate is negative and significant at 10% (p=0.07) in the life satisfaction model but statistically insignificant in the happiness model. In the quadratic specification (columns 3 and 4), the squared term of the tourist arrival rate is negative and highly significant (p<0.01) in the life satisfaction model, and negative but only marginally significant (p=0.09) in the happiness model. These results lend support for Hypotheses H2 and H3 and, to a more limited extent, Hypothesis H1.
[INSERT TABLE 3 ABOUT HERE]
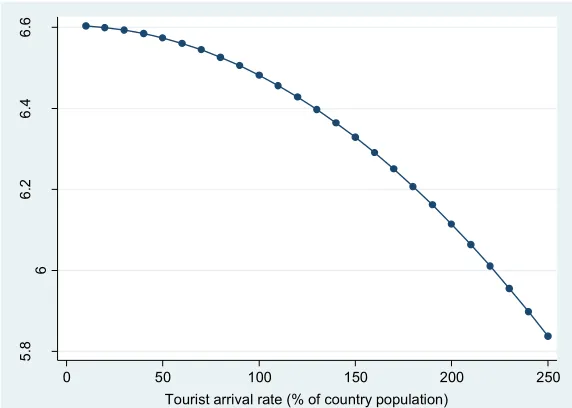
To get a better understanding of the size and nature of the estimated relationship between the variables of interest, Figure 1 plots the predicted values, based on the specification presented in column 3 of Table 3 (the most statistically significant result), of life satisfaction as a function of tourist arrival rate, which in our sample ranges between 13 and 250% of a country’s population. The graph shows that, while life satisfaction decreases with an increasing tourist arrival rate at all levels of tourism intensity, the association becomes stronger as tourism intensity increases. For example, a 50 percentage point increase in the tourist arrival rate would be associated with a reduction in residents’ life satisfaction of 0.04 units (from 6.60 to 6.56) in a country with a relatively low initial tourist arrival rate (10% of the population). The same percentage point increase in tourist arrivals would be associated with a reduction in residents’ life satisfaction of 0.15 units (from 6.48 to 6.33) in countries with an initial tourist arrival rate equal to 100% of the population, and by 0.28 units (from 6.11 to 5.83) in countries with an initial tourist arrival rate equal to 200% of the population.
19
The results of the socio-demographic and country-level controls comply with the empirical findings of the broader literature. Subjective well-being has a U-shaped relationship with age: life satisfaction decreases with age until the threshold age of 36 and increases thereafter (the threshold for happiness is 31 years). Women and respondents who are married or live with a partner have higher subjective well-being. Larger household size is associated with higher levels of happiness (but not life satisfaction), and having children tends to reduce both life satisfaction and happiness, other things equal. More educated respondents tend to feel happier but not necessarily more life satisfied. Income, and especially its subjective evaluation, is a strong positive predictor of subjective well-being, although its effect on happiness is smaller than on life satisfaction. The unemployed, less religious and less healthy people report lower levels of subjective well-being, while people living in rural areas are somewhat more likely to be happy and, especially, life satisfied. Concerning the country-level controls, higher GDP per capita growth and lower unemployment rates are, as expected, associated with higher levels of
subjective well-being. Interestingly, higher inflation is also associated with higher happiness and life satisfaction. This should not be surprising, as our sample consists mostly of high-income and upper middle-income European economies. Over the period 2002-13, higher inflation in these countries was associated with economic booms, while lower inflation was more typical to recessions. Joining the Eurozone, but not the European Union, provides a boost in subjective well-being, while hosting an international sports event is, somewhat unexpectedly, associated with a drop in both happiness and life satisfaction. A terrorist attack in the past two years reduces subjective well-being. Among the weather-related variables, only higher average temperatures in the previous year are associated with higher levels of life satisfaction.
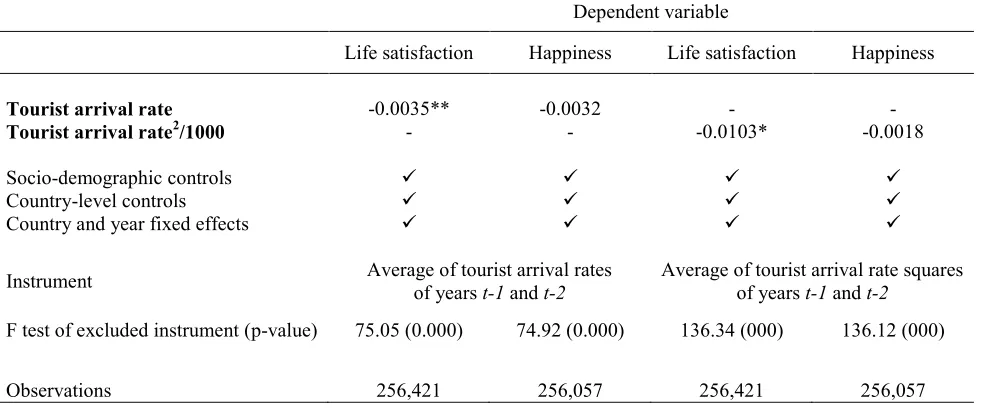
Instrumental variable regression results
20
residents’ satisfaction in both linear and quadratic models (the p-values of the estimated
coefficients are 0.04 and 0.08, respectively); the magnitude of the coefficients is in line with the corresponding OLS regressions reported in Table 3. The coefficients of the tourist arrival rate are statistically insignificant in the happiness models, implying that the tourist arrivals have no effect on the residents’ happiness levels. Overall, the results support hypotheses H1-H3: tourist arrivals reduce residents’ subjective well-being, this link gets stronger with tourism intensity, and tourist arrivals affect only life satisfaction (and not happiness).
[INSERT TABLE 4 ABOUT HERE]
Sub-group results
Table 5 reports the results of the models for younger and older people, those with relatively low and relatively high levels of education, and rural and urban residents. Similarly to the full-sample estimations, the model explaining life satisfaction with the squared tourist arrival term appears to be the most precise in the OLS estimations (Panel A), implying a negative association between life satisfaction and tourist arrivals across all sub-groups. Differences, however, exist in the size of the estimated coefficients: the negative association tends to be stronger among the older respondents, those with lower levels of education and people living in rural areas relative to their younger, more educated and urban counterparts. The results of the instrumental variable
estimations (Panel B of Table 5) support a causal negative effect of tourist arrivals on the life satisfaction for all sub-groups, except older people, where the coefficient is negative but insignificant. In terms of the effect magnitude, the greatest difference is obtained for rural
residents (the absolute value of the estimate is twice as high for rural than urban residents in both linear and quadratic life satisfaction specifications), while the difference is lower in the education samples. Overall, both the OLS and instrumental-variable results partly support hypothesis H4: tourist arrivals are more detrimental for the subjective well well-being of rural than urban residents. Meanwhile, the evidence for the age and education groups is less clear-cut.
21
DISCUSSION AND CONCLUSION
This study aimed at establishing the effect of tourist inflows on the subjective well-being of receiving country populations. The empirical analysis, based on data from the European Social Survey, conducted in 32 countries over 12 years, revealed that residents’ subjective well-being, and more specifically its evaluative component (life satisfaction), decreased with tourist arrivals at an increasing rate. The instrumental variable estimations, where the current tourist arrival rate was predicted with the tourist arrivals rates of previous years, supports the causal nature of the negative relationship between tourist inflows and residents’ life satisfaction.
The findings of this study indicate that the most affected by tourism are the residents in countries where tourist arrivals (as a percentage of country population) are large and rapidly growing. For example, recently the tourist arrival rate has increased from 206 to 257% (2010-2013) in Croatia, from 155 to 200% (2008-2010) in Estonia and from 210 to 247% (2012-2013) in Iceland. The model predicts that such increases in the arrival rate would be associated with a fall in life satisfaction of up to 0.20 units on a 0/10 scale – a non-negligible effect, comparable to a half of the positive effect on life satisfaction of being married/living with a partner. In contrast, residents of countries where tourist inflows are lower (relative to country population) and/or do not change much over time would not experience a significant fall in life satisfaction. The examples would be Germany, the UK, Russia, Poland, Ukraine (the tourist arrival rate in these countries generally has not exceeded 50%), and Spain, Belgium, Ireland, France and Italy (the average tourist arrival rates for 2002-13 were between 50 and 150%, and have changed little over the period of
observation).
22
The second finding of this study is that tourist inflows affect negatively life satisfaction, while their relationship with happiness tends to be insignificant. If one assumes that tourists affect the life satisfaction of residents through the evaluation of tourism effects (thinking/remembering), and happiness is affected by actual encounters with tourists (experiencing/spontaneity), the results would suggest that the evaluation of tourism impacts is a more important driver of subjective well-being than actual encounters with tourists. These findings and reasoning
corroborate the work of Nawijn and Mitas (2012), who find that the perceived impacts of tourism are associated with life satisfaction but not happiness.
Finally, the analysis showed that life satisfaction of rural residents tends to decrease with tourist arrivals to a greater extent than the subjective well-being of their urban counterparts. It is possible that for rural dwellers the net benefits from tourism are low and actual encounters with tourists result in more discomfort than joy. These findings are relevant for decision makers wishing to promote tourism in rural areas.
Limitations and directions for future research
23
Second, this study has used a repeated-cross-sectional survey to determine how residents’ subjective well-being changes with tourist arrivals over time. Given that all country-wave samples were randomly drawn from the underlying populations, this should not lead to issues of sample selection, which could otherwise bias the results. However, ideally one would want to use panel data, where the same respondents are observed over time. Large panel surveys have been recently used to determine the effects of holiday-taking on tourists’ wellbeing (Pagán, 2015; Kroesen and Handy, 2014), and such data may also provide valuable insights into the effects of tourist arrivals on the well-being of resident populations.
Third, while this study has conjectured that tourism may have an impact on the well-being of residents living in both tourist and non-tourist areas, a distinction between the two groups has not been made in the empirical analysis. Future research could use regional statistics to identify tourism intensity at a more local level (regions, cities, communities), and perform a longitudinal analysis of the relationship between tourist arrivals and residents’ well-being at a geographically more disaggregated level.
24
REFERENCES
Andereck, K.L., and G. Nyaupane. 2011. “Exploring the nature of tourism and quality of life perceptions among residents.” Journal of Travel Research 50(3): 248-260.
Andereck, K. L., K. M. Valentine, R. C. Knopf, and C. A. Vogt. 2005. “Residents’ perceptions of community tourism impacts.” Annals of Tourism Research 32(8): 1056-1076.
BBC. 2009. “Latvian warning for British stags.” http://news.bbc.co.uk/1/hi/uk/8185159.stm (accessed October 14, 2015)
Bell, D., and D. Blanchflower. 2011. “The crisis, policy reactions and attitudes to globalization and jobs.” IZA Discussion Paper No. 5680.
Belenkiy, M., and D. Riker. 2012. “Face-to-face exports: the role of business travel in trade promotion.” Journal of Travel Research 51(5): 632-639.
Bestard, B., and R. Nadal. 2007. “Attitudes toward tourism and tourism congestion.” Région et Développement 25: 193-207.
Bimonte, S., and V. Faralla, V. 2012. “Tourist types and happiness: a comparative study in Maremma, Italy.” Annals of Tourism Research 39(4): 1929-1950.
Boissevain, J., ed. 1996. Coping with tourists: European reactions to mass tourism. Oxford: Berghahn Books.
Cai, J., P. Leung, and J. Mak. 2006. “Tourism’s forward and backward linkages.” Journal of Travel Research 45: 36–52.
Cameron, C., J. Gelbach, and D. Miller. 2008. “Bootstrap-based improvements for inference
with clustered errors.” Review of Economics and Statistics 90: 414-427.
25
Chen, C. C., W-J. Huang, and J. F. Petrick. 2016. “Holiday recovery experiences, tourism
satisfaction and life satisfaction – Is there a relationship?” Tourism Management 53: 140-147.
D’Ambrosio, C., and J. R. Frick. 2007. “Income satisfaction and relative deprivation: An
empirical link.” Social Indicators Research81 (3): 497-519.
De Neve, J-E., E. Diener, L. Tay, and C. Xuereb. 2013. “The Objective benefits of subjective
well-being.” In World Happiness Report 2013, edited byJ.Helliwell, R. Layard and J.
Sachs, J. New York: UN Sustainable Development Solutions Network.
Deery, M., L. Jago, and L. Fredline, L. 2012. “Rethinking social impacts of tourism research: a new research agenda.” Tourism Management 33(1): 64-73.
Diener, E., R. Inglehart, and L. Tay. 2012. Theory and validity of life satisfaction scales. Social Indicators Research 112(3): 497-527.
Dolnicar, S., V. Yanamandram, and K. Cliff. (2012). “The contribution of vacations to quality of life.” Annals of Tourism Research 39 (1): 59-83.
Facchini, G., and A. M. Mayda, A. M. 2008. “From individual attitudes to immigration policy: theory and evidence.” Economic Policy 56: 651–713.
Fennelly, K., and C. Federico. 2008. “Rural residence as a determinant of attitudes toward U.S. immigration policy.” International Migration 46: 151-190.
Ferrer-i-Carbonell, A., and P. Frijters, P. 2004. “How important is methodology for the estimates
of the determinants of happiness?” The Economic Journal114(497): 641-659.
Ferrer-i-Carbonell, A., and X. Ramos. 2014. “Inequality and Happiness.” Journal of Economic Surveys 28(5): 1016-1027.
26
Juric, B., and A. Worsley. 1998. Consumers' attitudes towards imported food products. Food Quality and Preference 9: 431-441.
Kahneman, D., and A. Deaton. 2010. “High income improves evaluation of life but not emotional well-being.” Proceedings of the National Academy of Sciences 107(38): 16489-16493.
Kahneman, D., and J. Riis. 2005. Living and thinking about it: two perspectives on life. In The science of wellbeing: integrating neurobiology, psychology, and social science, edited by F. Huppert, N. Baylis and B. Kaverne. Oxford: Oxford University Press.
Kim, K., M. Uysal, and M. J. Sirgy. 2013. “How does tourism in a community impact the quality of life of community residents?” Tourism Management 36: 527-540.
Kroesen, M., and S. Handy. 2014. “The influence of holiday-taking on affect and
contentment.” Annals of Tourism Research, 45: 89-101.
Layard, R. 2011. Happiness: Lessons from a New Science. London: Penguin.
Luttmer, E. 2005. “Neighbors as negatives: relative earnings and well-being.” Quarterly Journal of Economics 120(3): 963-1002.
Mayda, A. M., and D. Rodrik. 2005. “Why are some people (and countries) more protectionist than others?” European Economic Review, 49(6): 1393-430.
McCabe, S., and S. Johnson. 2013. “The happiness factor in tourism: holidays, subjective wellbeing and social tourism.” Annals of Tourism Research 41 (1): 42-65.
Miles, D., and M. Rossi. 2007.” Learning about one’s relative position and subjective
well-being.” Applied Economics39(13): 1711-18.
Moulton, B. 1990. “An illustration of a pitfall in estimating the effects of aggregate variables on micro units.” Review of Economics and Statistics 72(2): 334-338.
27
Nawijn, J., and R. Veenhoven. 2011. “The effects of leisure activities on life satisfaction: the importance of holiday trips.” In The human pursuit of well-being: a cultural approach, edited by I. Brdar, 39-53. New York: Springer Science + Business Media.
Neal, J., M. Uysal, and M. Sirgy. 2007. “The effect of tourism services on travelers’ quality of life.” Journal of Travel Research 46 (2): 154-63.
Nguyen, T., T. M., D. Rahtz, and C. Shultz. 2014. “Tourism as catalyst for quality of life in transitioning subsistence marketplaces: perspectives from Ha Long, Vietnam.” Journal of Macromarketing 34 (1): 28-44.
Nunkoo, R., S. Smith, and M. Ramkissoon. (2013. Resident attitudes to tourism: a longitudinal study of 140 articles from 1984 to 2010. Journal of Sustainable Tourism 21(1): 5-25.
O’Donnell, G., A. Deaton, M. Durand, D. Halpern, and R. Layard. 2014. Wellbeing and policy. Report of the commission on wellbeing and policy. Legatum Institute.
OECD. 2013. Guidelines on measuring subjective well-being. Paris: OECD.
Office for National Statistics (2013). Personal Well-being in the UK, 2012/13. United Kingdom: Office for National Statistics.
Pagán, R. 2015. The impact of holiday trips on life satisfaction and domains of life satisfaction:
Evidence for German disabled individuals.Journal of Travel Research: 54 (3): 359-379.
Paris, N. 2015. “Barcelona limits tourist accommodation and seeks a 'sustainable' plan.” The Telegraph.http://www.telegraph.co.uk/travel/destinations/europe/spain/barcelona/117128 24/Barcelona-limits-tourist-accommodation-and-seeks-a-sustainable-plan.html (accessed October 14, 2015)
28
Ross, W. 2015. “The death of Venice: Corrupt officials, mass tourism and soaring property prices have stifled life in the city.” The Independent.
http://www.independent.co.uk/news/world/europe/the-death-of-venice-corrupt-officials-mass-tourism-and-soaring-property-prices-have-stifled-life-in-the-city-10251434.html (accessed October 14, 2015).
Sharpley, R. 2014. “Host perceptions of tourism: A review of the research.” Tourism Management 42: 37-49.
Sirgy, M., P. Kruger, D. Lee, and B. Grace. 2011. “How does a travel trip affect tourists’ life satisfaction?” Journal of Travel Research 50(3): 261-75.
Snaith, T., and A. Haley. 1999. “Residents’ opinions of tourism development in the historical city of York.” Tourism Management 20(5): 595-603.
Uysal, M., M. Sirgy, E. Woo, and H. Kim. 2016. “Quality of life (QOL) and well-being research in tourism.” Tourism Management 53: 244-261.
Vargas-Sánchez, A., N. Porras-Bueno, and M. Plaza-Mejía. 2011. “Explaining residents’ attitudes to tourism: is a universal model possible?” Annals of Tourism Research 38(2): 460-480.
Woo, E., H. Kim, and M. Uysal. 2015.“Life satisfaction and support for tourism development.”
Annals of Tourism Research 50: 84-97.
29
Table 1. Tourist arrival rate (tourist arrivals/country population, in %), by country, 2002-2013
Country Average Min Max
Austria 242.76 234.91 250.41
Belgium 65.99 63.12 67.94
Bulgaria 82.93 67.00 94.95
Cyprus 221.03 210.75 229.03
Czech Republic 83.78 74.96 88.72
Germany 29.63 21.78 39.11
Denmark 132.32 63.92 170.23
Estonia 163.35 128.44 217.60
Finland 64.40 54.32 78.06
France 123.94 118.64 128.49
Greece 135.55 126.78 147.68
Croatia 215.11 195.40 231.91
Hungary 96.52 85.90 107.90
Ireland 171.73 156.44 189.41
Israel 29.39 13.12 36.48
Iceland 177.51 126.04 247.09
Italy 72.16 69.10 79.20
Lithuania 64.00 58.62 68.03
Luxembourg 191.88 191.66 196.28
Netherlands 63.64 56.58 76.07
Norway 83.80 68.55 100.20
Poland 36.71 31.17 41.08
Portugal 63.73 53.36 77.43
Russia 17.31 15.04 19.68
Sweden 51.84 47.91 57.11
Slovenia 85.10 65.28 104.81
Slovakia 113.37 98.36 135.25
Spain 124.93 112.54 130.65
Switzerland 104.83 88.98 112.56
Turkey 35.86 27.56 42.37
Ukraine 42.49 37.43 49.72
United Kingdom 45.51 37.57 50.38
Total 89.38 13.12 250.41
30
Table 2. Summary statistics of the variables included in the analysis (based on a total sample of 263,888 respondents)
Mean deviation Standard Min Max
Life satisfaction 6.791 2.356 0 10
Happiness 7.140 2.058 0 10
Tourist arrival rate 89.383 55.276 13.12 250.41
Age 47.646 18.429 15 123
Female 0.540 0.498 0 1
Married/lives with partner 0.597 0.491 0 1
Household size 2.780 1.457 1 22
Children in the household 0.390 0.488 0 1
Years of education 12.092 4.114 0 56
Low income 0.307 0.459 0 1
Medium income 0.240 0.427 0 1
High income 0.205 0.404 0 1
Income missing 0.253 0.435 0 1
Living comfortably on present income 0.271 0.444 0 1
Coping on present income 0.442 0.497 0 1
Difficult on present income 0.201 0.401 0 1
Very difficult on present income 0.086 0.280 0 1
Unemployed, actively looking for job 0.045 0.208 0 1
Unemployed, not looking for job 0.021 0.145 0 1
Religious 4.817 2.982 0 10
Health very good 0.226 0.419 0 1
Health good 0.414 0.493 0 1
Health fair 0.270 0.444 0 1
Health bad 0.074 0.262 0 1
Health very bad 0.016 0.124 0 1
Big city 0.221 0.415 0 1
Suburb of big city 0.117 0.321 0 1
Town or small city 0.303 0.460 0 1
Village 0.302 0.459 0 1
Farm or home in countryside 0.058 0.234 0 1
GDP per capita growth 1.244 3.602 -14.57 11.07
Unemployment rate 8.320 3.921 2.6 26.1
Inflation rate 3.015 2.715 -4.48 17.65
Year of joining the European Union 0.031 0.173 0 1
Year of joining the Eurozone 0.007 0.081 0 1
Year of hosting an international sports event 0.032 0.175 0 1
Terrorist attack in the last two years 0.032 0.176 0 1
Average temperature (ºC) 9.284 5.029 -5.990 21.022
Average level of precipitations (mm) 66.197 24.848 17.898 157.052
31
Table 3. Tourist arrivals and subjective well-being, OLS fixed-effects regressions, whole sample
Dependent variable
Life satisfaction Happiness Life satisfaction Happiness
Tourist arrival rate -0.003* -0.005 - -
Tourist arrival rate2/1000 - - -0.012*** -0.015*
Socio-demographic controls
Age -0.072*** -0.061*** -0.072*** -0.061***
Age squared 0.001*** 0.001*** 0.001*** 0.001***
Female 0.088*** 0.100*** 0.088*** 0.100***
Married/lives with partner 0.414*** 0.643*** 0.414*** 0.643***
Household size 0.019 0.036*** 0.019 0.036***
Children in the household -0.047* -0.057** -0.046* -0.057**
Years of education 0.001 0.009* 0.001 0.009*
Household per capita income level
1st income thirtile (low income) Ref. Ref. Ref. Ref.
2nd income thirtile (medium income) 0.070** 0.019 0.070** 0.020
3rd income thirtile (high income) 0.159*** 0.061** 0.160*** 0.062**
Subjective income evaluation
Living comfortably Ref. Ref. Ref. Ref.
Coping -0.558*** -0.355*** -0.558*** -0.355***
Difficult -1.395*** -0.965*** -1.395*** -0.965***
Very difficult -2.214*** -1.590*** -2.214*** -1.590***
Unemployed, actively looking for job -0.668*** -0.378*** -0.668*** -0.378***
Unemployed, not looking for job -0.361*** -0.234*** -0.361*** -0.234***
Religious 0.074*** 0.063*** 0.074*** 0.063***
Subjective health evaluation
Very good 0.448*** 0.453*** 0.448*** 0.453***
Good Ref. Ref. Ref. Ref.
Fair -0.589*** -0.501*** -0.589*** -0.501***
Bad -1.309*** -1.188*** -1.309*** -1.188***
Very bad -2.296*** -2.066*** -2.296*** -2.066***
Type of settlement
Big city Ref. Ref. Ref. Ref.
Suburb of big city 0.024 -0.012 0.024 -0.011
Town or small city 0.038 0.032 0.038 0.033
Village 0.114*** 0.073** 0.114*** 0.074**
Farm or home in countryside 0.143*** 0.059 0.144*** 0.060
Country-level controls
GDP per capita growth 0.018*** 0.010* 0.018*** 0.010*
Unemployment rate -0.029*** -0.022*** -0.029*** -0.022**
Inflation rate 0.020*** 0.026*** 0.020*** 0.027**
Joining the European Union 0.016 0.067 0.003 0.038
Joining the Eurozone 0.358* 0.279*** 0.366* 0.309***
Hosting an intl. sports event -0.086** -0.202** -0.082** -0.191**
Terrorist attack in the last two years -0.113* -0.156*** -0.123** -0.178***
Average temperature 0.031 -0.017 0.030 -0.017
Average temperature, lagged 0.075** 0.063 0.073** 0.059
Average level of precipitations 0.002 0.002 0.002 0.002
32
Year dummies (12)
Country dummies (32)
Observations 263,888 263,522 263,888 263,522
R-squared 0.305 0.265 0.305 0.265
33
Table 4. Tourist arrivals and subjective well-being, instrumental variable regressions, whole sample
Dependent variable
Life satisfaction Happiness Life satisfaction Happiness
Tourist arrival rate -0.0035** -0.0032 - -
Tourist arrival rate2/1000 - - -0.0103* -0.0018
Socio-demographic controls
Country-level controls
Country and year fixed effects
Instrument Average of tourist arrival rates of years t-1 and t-2 Average of tourist arrival rate squares of years t-1 and t-2
F test of excluded instrument (p-value) 75.05 (0.000) 74.92 (0.000) 136.34 (000) 136.12 (000)
Observations 256,421 256,057 256,421 256,057
34
Table 5. Tourist arrivals and subjective well-being, OLS fixed-effects and instrumental-variable estimations, by age group, education and type of settlement
Estimation method → A. OLS fixed effects B. Instrumental variable
Dependent variable → Life satisfaction Happiness Life satisfaction Happiness
Sample Regressor of interest → arrival rate Tourist Tourist arrival rate2/1000
Tourist arrival rate
Tourist arrival rate2/1000
Tourist arrival rate
Tourist arrival rate2/1000
Tourist arrival rate
Tourist arrival rate2/1000
Younger people ( < 50 years) -0.003 -0.011** -0.005* -0.015* -0.004** -0.014** -0.003 -0.003
Older people (50 and older) -0.004* -0.014*** -0.006 -0.014 -0.003 -0.007 -0.005 -0.002
Less than 12 years of education -0.005** -0.017*** -0.010* -0.024* -0.005** -0.012* -0.006* -0.003
12 or more years of education -0.002 -0.009** -0.002 -0.008* -0.003** -0.011** -0.007 -0.003
Rural residents -0.004 -0.015* -0.006 -0.019* -0.006** -0.017* -0.004 -0.008
Urban residents -0.002* -0.011*** -0.005 -0.013 -0.003* -0.009* -0.003 -0.001
35
Figure 1. Predicted life satisfaction and tourist arrival rate
Source: Author’s calculations based on data from the European Social Survey
5
.8
6
6
.2
6
.4
6
.6
L
ife
sa
tisf
act
io
n,
p
re
d
ict
ed
va
lu
e
0 50 100 150 200 250
36
ENDNOTES
iHowever, older people may appreciate tourism more than younger people, especially if they
have experienced economic hardship in the relatively recent past (Nguyen, Rahtz, and Shultz,
2014). In the context of the current study, this could be the case for post-Socialist countries.
While sensitivity checks did not uncover substantive differences in the tourism-host wellbeing
relationship between Western and Eastern Europe, future research could consider whether
regional differences arise in particular age groups.
ii Unfortunately, the European Social Survey does not contain questions on satisfaction with
different life domains, which would allow for a more nuanced analysis.
iiiTo check instrument exogeneity, the Sargan-Hansen test of overidentifying restrictions was
also performed. As this test requires more than one instrument, tourist arrival rates of years t-1
and t-2 were included as separate instruments. The test confirmed that the instruments are
exogenous (uncorrelated with the error term). Note that it is not possible to run this test after
estimating sample-weighed regressions, which is why weights were not used in this case.
ivGiven that sample sizes for different countries are comparable while the actual country
populations differ significantly, the population weight accords greater importance to the
respondents from larger countries, such as Germany, France or Russia but suppresses the ‘voice’
of respondents from smaller countries, such as Estonia, Iceland or Cyprus. One might wonder
how the results would differ if small countries were accorded the same weight as large countries.
Estimating the model without the population weight produced qualitatively similar results to the
population-weighted case. This means that the effect of tourist inflows on subjective well-being