Road Safety Research Report No. 111
Understanding
Public
Attitudes
to
Road
User
Safety
Charles Musselwhite1, Erel Avineri1, Yusak Susilo1, Eamon Fulcher1,
Darren Bhattachary2, Andrew Hunter2and Richard Stockley2
1Centre for Transport & Society, University of the West of England, Bristol
2TNS-BMRB Limited
September 2010
ofanykindresultingfromrelianceontheinformationorguidancethisdocumentcontains.
DepartmentforTransport GreatMinsterHouse 76MarshamStreet LondonSW1P4DR Telephone03003303000
Websitewww.dft.gov.uk/pgr/roadsafety/research/rsrr
#Queen’sPrinterandControllerofHerMajesty’sStationeryOffice,2010,exceptwhereotherwisestated. CopyrightinthetypographicalarrangementrestswiththeCrown.
Thispublication,excludinglogos,maybereproducedfreeofchargeinanyformatormediumfornon commercialresearch,privatestudyorforinternalcirculationwithinanorganisation.Thisissubjecttoitbeing reproducedaccuratelyandnotusedinamisleadingcontext.Thecopyrightsourceofthematerialmustbe acknowledgedandthetitleofthepublicationspecified.
Foranyotheruseofthismaterial,applyforaClick-UseLicenceat
www.nationalarchives.gov.uk/information-management/our-services/click-use.htm Toorderfurthercopiescontact:
DfTPublications Tel:03001231102
Web:www.dft.gov.uk/orderingpublications ISBN9781848640511
IfyouwouldliketobeinformedinadvanceofforthcomingDepartmentforTransportpricedpublications,or wouldliketoarrangeastandingorder,call02079444673.
CONTENTS
ACKNOWLEDGEMENTS 7
EXECUTIVE SUMMARY 8
1 INTRODUCTION 16
1.1 Findings from pre-stage literature review 17
1.1.1 Self and others 17
1.1.2 Norms 17
1.1.3 Road user groups 18
2 METHODOLOGY 20
2.1 Sample 20
2.2 Recruitment 21
2.3 Experts in the process 22
2.4 Workshops 22
2.4.1 Workshop 1: Risk and road safety 23
2.4.2 Workshop 2: Place, identity and road safety 24
2.4.3 Workshop 3: Road safety interventions 24
2.5 Analysis and reporting 25
3 FINDINGS: PUBLIC CONCEPTUALISATION OF RISK 27
3.1 General views on road safety 27
3.1.1 Relative impression of risk on the roads 27
3.1.2 Perceptions of dangerous road user behaviour 31
3.1.2.1 Distraction 31
3.1.2.2 Failure to adjust to conditions 31
3.1.2.3 Poor road design and maintenance 31
3.1.2.4 Congestion 31
3.1.2.5 Unfamiliarity vs. complacency 31
3.1.2.9 Lack of skills 32
3.1.3 Stereotypes and road safety 33
3.2 Respondents’ own driving behaviour 33
3.2.1 Deliberate risks 34
3.2.2 Reasons for deliberate risks 35
3.2.3 Non-deliberate risks 37
3.2.4 Changes in risk taking over time 37
4 SPATIAL UNDERSTANDING OF RISK 38
4.1 Local examples of risky road user situations 38
4.1.1 Spatial areas of risk 38
4.1.2 Examples of dangerous road user behaviour 40
4.2 Local analysis of risk hotspots 40
4.2.1 Areas of high road user risk 40
4.2.2 Areas of low road user risk 41
4.3 Familiarity and risk taking 42
4.3.1 Familiar roads 42
4.3.2 Unfamiliar roads 44
4.4 Discussion on rural roads 44
4.4.1 Road user safety and rural roads 44
4.4.2 Improving road user safety and rural roads 46
4.4.2.1 Engineering 47
4.4.2.2 Enforcement 47
4.4.2.3 Education 48
5 SOCIAL INFLUENCES AND RISK 50
5.1 Direct impact on driving behaviour and risk from others 50
5.1.1 Peer pressure 50
6.1 Car drivers – the dominant perception of the road users 53
6.2 Cyclists 53
6.3 Motorcyclists 53
6.4 Pedestrians 53
6 DIFFERENT HATS 53
6.5 Younger drivers 56
7 INTERVENTIONS 58
7.1 Reducing deaths among young males 58
7.1.1 Campaigns 58
7.1.2 Enforcement 59
7.1.3 Training 61
7.2 Reducing motorcycle fatalities 61
7.2.1 Engineering 61
7.2.2 Education and enforcement 62
7.2.3 Risk mapping 63
7.3 Rural single carriageways 63
7.3.1 Improved visibility and highlighting hazards 64
7.3.2 Clearer speed limits and enforcement 64
7.3.3 Education, information provision and risk mapping 65
7.4 Drink and drug driving 66
7.5 Urban pedestrians 68
7.6 Inappropriate speed 72
7.7 Basic driving standards 74
7.8 Road safety overall 76
8 CONCLUSIONS 78
8.1 Identity and impression management and norms 80
8.2 Risk perceptions and the risk thermostat 81
8.3 Education, communication and social marketing opportunities 83
8.3.4 Training 87
8.4 Enforcement 87
8.5 Re-engineering space 88
9 REFERENCES 90
APPENDIX 1: How findings compare to the literature on road user safety 92
A1.1 References 96
APPENDIX 2: Sample details 99
ACKNOWLEDGEMENTS
We would like to thank the Department for Transport Road User Safety team who commissioned and steered this project, in particular Deirdre O’Reilly, Priti Khatri, Chris Watts and Louise Taylor.
This report provides the Department for Transport (DfT) with an in-depth understanding of how the public engage with the issue of road user safety.
The research used qualitative methods and brought together the views of a wide range of adult road users. Specifically, a deliberative approach was used to explore the public’s insights, perceptions and conceptualisation of road user safety and to go beyond their top of mind responses. A total of 240 participants were recruited in 4 areas across the UK (United Kingdom – Bradford, Glasgow, London, north-west Wales). In total, each area had six groups of ten participants. Group composition was based on a life-stage and attitude to road user risk. Each group was reconvened three times in the spring of 2009.
Conceptualisation of risk
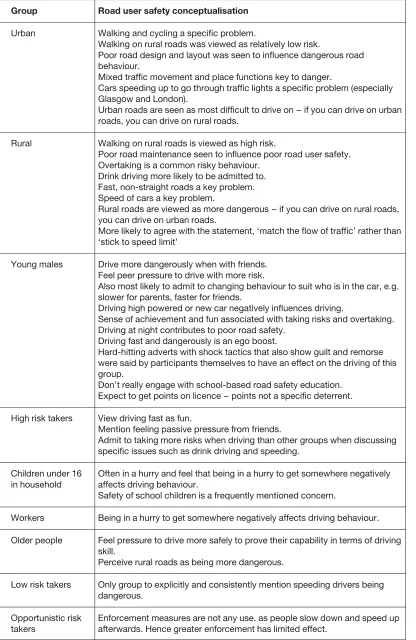
Findings suggest, on the whole, respondents felt that the UK’s roads are fairly safe to use for all modes of transport and are especially safe for cars. However, certain groups of road users were viewed as at greater risk – in particular younger drivers and teenage pedestrians. Motorcyclists were also perceived to be at great risk of an accident. Walking and cycling was largely felt to be less safe than driving, and this was especially true for cycling in city centres (particularly in Glasgow and London) and walking on rural roads.
Respondents conceptualised risk by a variety of strategies. For example,
than some other situations, unless volition is inhibited in some way, such as by drink or drugs.
The respondents described a number of different factors that they felt contributed to dangerous road user behaviour in general. These predominately related to factors affecting safe operation of the vehicle, including: being distracted, especially by mobile phones, failing to adjust to conditions, poor road design and maintenance, and facing peer and time pressure. A lack of driving skills was infrequently mentioned as an issue. In contrast, factors affecting safe pedestrian and cycling behaviour were largely attributed to the control of the road user, such as having poor road safety skills (not knowing where to cross the road safely), deliberately
displaying violations (weaving in and out of traffic) or not wearing safety gear (visible jackets).
Drivers admitted performing risky behaviours themselves. Speeding was frequently mentioned, as was driving through amber or red lights when it would have been appropriate to stop. In all cases participants justified their behaviour based on there not being much traffic around or being under a time pressure.
The majority of respondents felt their road user safety had increased with maturity, and this was especially true for driving behaviour. A variety of reasons were cited, including: having, seeing or knowing people in accidents; a reduction in negative peer pressure; having responsibilities such as children and a job that requires
driving; a growing sense of mortality; increased tolerance for others’ behaviour; and a realisation that driving faster does not actually match a reduction in time taken to travel.
Participants were asked to map safe and dangerous areas. Roads that had many major ‘place’ functions (such as school, residential, shopping) and had heavy traffic were noted as dangerous. In addition, speeding traffic in residential areas was noted as problematic. Participants took much longer to describe areas with high road safety. These largely centred on areas with many formal crossings for pedestrians, cycle lanes for cyclists and dual carriageways for fast traffic. Overall, participants’ perception of danger was linked with a lack of segregation between different road users and an increased interaction of individuals. Hence, separated traffic was seen as highly positive in terms of road user safety across all road user groups. Where this was not possible, for example in residential areas, then engineering
interventions such as traffic calming were favoured.
Rural roads
different type of road user skill, if you could drive in urban areas then you could drive in rural areas.
There was strong support for the use of speed humps on rural roads, especially for roads travelling through villages and towns. Other suggestions for improving road safety on rural roads included: straightening bends in the roads (although there was acknowledgement that this could increase the speeds of vehicles), improving signage preceding sharp corners, providing more passing places on narrow roads, providing extra street lighting at night, and cutting foliage more frequently. Specific campaigns targeting dangerous driving on rural roads were proposed.
Speeding was considered to be a major concern, and respondents felt that ambiguity over speed limits needs to be reduced. There was some support for adding more signage. It was perceived that rural areas had a low level of enforcement, and there was support for an increase in police presence. There was some support for average speed cameras on certain stretches of road and for reducing the national speed limit, as it was recognised that speed differential from the fastest speeds to the slowest on rural roads was a cause of danger. However, speed limits alone were felt to be ineffective for certain groups of drivers who were perceived to drive at fast speeds irrespective of the law.
There was support for education about safer driving on rural roads, especially campaigns that were reinforced in the road environment itself. For example, signs that noted how many people had died in road accidents in a certain time period or alerting drivers to dangerous stretches of road were felt to be effective in making people aware of the dangers of the road. Hence any television campaign needs to be backed up with prompts in the form of signs in the road environment itself. The recent THINK Bike campaign was noted as being successful in this format.
Social aspects of driving
It was common for participants to stress how they changed their driving depending upon the social situation and in particular whom they had in their vehicle as passengers. This was especially true for younger males, who stated they adopted a more dangerous driving style to impress friends but drove more safely with parents or younger children in the vehicle. However, peer pressure can also be positive: the older people got, the more they felt they should conform to a safe driving behaviour. This was especially true for older drivers, who felt the need to impress on others that they could drive safely despite their advancing years.
Different perspectives
Despite participants having multiple road user identities – from driver, to
pedestrian, to cyclist and so on – their view of the road was generally limited to one identity at a time. This detachment between identities also has broader implications for the acceptance of different policy interventions. The primary view of roads was from the perception of the car driver. Roads were seen as a space for cars and, importantly, this space was viewed as competitive, particularly in urban areas, where driving was often stressful and a ‘survival of the fittest’ mindset prevailed.
Cyclists
Cyclists, particularly in urban roads, were viewed by drivers as one of the most unsafe road users. There were three types of cyclists described by the participants: professionals, commuters and those who ride for fun. All exhibit different riding styles – the most aggressive and those most impacting on the car driver were the ‘professional’ cyclist, and those with least impact and being most safe were those riding for fun and pleasure. The urgency of the journey, together with the confidence and experience of cyclists, were key factors in shaping the participants’ view of the risk that cyclists pose.
Motorcyclists
Motorcycle riders were generally viewed by drivers as thrill-seekers who looked to perform dangerous behaviours for deliberate pleasure. This, coupled with the physical vulnerability and excessive speeds, meant that motorbike riding was considered by drivers one of the least safe forms of road use. Motorcyclists
themselves generally saw their riding as safe and, like some drivers, although they admitted to taking risks, saw these as justifiable and calculated, based on experience and conditions of the road.
With regard to interventions aimed at improving motorcycle safety, engineering solutions were seen by drivers to be important for this group. Three main types were identified: improving the road conditions (removing potholes, using high friction surfaces at key points); performance (limiting top speed of bikes); and creating a clearly demarcated space for bikes.
In addition, education and enforcement interventions were also deemed important by all respondents. Key issues included normalising safer driving behaviours for motorcyclists and increasing awareness of bikes for motorists – particularly in relation to reducing speed limits at urban junctions, building on the current THINK! campaign.
Generally, interventions aimed at education were more preferred by motorcyclists themselves, while those aimed at reducing the speed and manoeuvrability of bikes were preferred by other road users.
Pedestrians
Generally, the road was viewed as a space for cars. Pedestrians were seen to be encroaching on this space and, despite the fact that all participants were also pedestrians at one time or another, they were generally viewed in an antagonistic relationship with drivers.
There was little surprise at the high levels of urban pedestrian casualties, because of the vulnerable nature of being a pedestrian. Participants generally thought a
successful intervention involved segregating participants from other traffic, including more roadside barriers and bridges, which echoes the wider feeling that the road space is very much dominated by motor vehicles.
An increase in the number of 20 mph zones was considered. While at first
participants were concerned about the limit being too low and potentially leading to increased congestion, the likely impact on road deaths was compelling and the trade off in terms of safety, congestion and road user convenience was viewed as
acceptable. The intervention was particularly supported if targeted in locations such as schools and shopping areas, rather than blanket urban coverage. Similarly, there was majority support for the implementation of traffic calming measures in urban areas to reduce speed.
Younger drivers
Younger drivers were viewed as a particular high risk group by older people. The reasons for this fall into four categories: inexperience (lack of skills); social (peer pressure to drive fast and modifying or tweaking cars to appear and sound
dangerous); financial (the use of older cars that may not be in a roadworthy
condition or driven without an MOT test); and distraction (playing loud music, party atmosphere in vehicles).
There were a variety of other restrictions that were thought to be potentially effective for reducing deaths among young people, such as legislation to restrict: engine size, car modification, the number of passengers allowed, and permissions to drive at night.
Although this is a qualitative study, there was strong support by participants for the measures of car crushing for uninsured and unlicensed drivers. This was also seen as an effective punishment for persistently dangerous driving behaviour amongst younger drivers.
Drink driving
While at one level participants stated a very low tolerance to the acceptability of drink driving across groups, it was acknowledged that many people still drove under the influence, and participants were willing to discuss this in a group situation. Acceptability of drink driving is low, but there was bravado over having had one drink too many and managing to have driven home without accident or reprisal. This was coupled with the fact that such incidences were considered to have occurred by chance – no one set out to drink drive, but it could be the case that people got carried away and drank more than they intended. In addition, ambiguity over the exact level of alcohol that was acceptable before driving meant that individuals took their own subjective rating of ability to drink and drive.
Zero tolerance was advocated by a variety of different groups. In addition, a variety of interventions highlighted the social nature of drinking, including the idea of a ‘pub bus’ in rural areas that picked up at closing time and drove people back to nearby villages or with similar points made in relation to subsidised public transport in urban areas, safe places to park cars if they were to be left overnight, and a scheme where people could hand their keys to the barman, who would then pass them back if the driver passed a breathalyser test.
Shared space
Shared space is a technique where the aim is to remove any implied priority of vehicular traffic over pedestrians, often by minimising the use of signing and other traffic management measures. This concept was generally viewed negatively. Participants generally viewed the street as competitive space and favoured
segregating road users. The negativity shown by participants towards shared space is not surprising, given that many had not encountered shared space schemes and believed they were commenting on an abstract concept.
Conclusion
discussions tended to shift from interventions that impact on other more dangerous drivers to how such interventions may negatively impede their own road user behaviour.
Participants often described deliberately changing their own driving behaviour to display a deliberately managed performance of behaviour for others – a process known as identity and impression management. This was most notable amongst younger drivers, especially male drivers, being influenced through peer pressure to show more risk while driving. This was noticeable in other road users too, for example older drivers tried to show a more safe performance to impress others when driving. Sometimes the impact of others resulted in less deliberate manipulation of behaviour. Moreover, there was automatic or unconscious sticking to the norms of the road – for example, keeping up with traffic rather than keeping to speed limits tended to be a behaviour individuals displayed frequently.
As shown in previous research, individuals tended to view themselves as good drivers and others as poor drivers. They often viewed messages, through campaigns, as being for other drivers and not being intended for themselves, thus distancing themselves from the message and justifying their own belief that they were safe. It is therefore suggested that future interventions make individuals explicitly believe that: ‘Yes they mean me. And yes, I can do something about it.’
Overall, the strong sense of personal control over the vehicle, perceived high skill and externalisation of threats mean that drivers manage risk by adapting to immediate road conditions. There were numerous examples of this stated, from driving fast on roads where the limit was perceived to be too low for conditions, to drink driving in country roads at night with minimal traffic. Similar issues were also brought up in relation to familiar roads and the propensity to drive on autopilot.
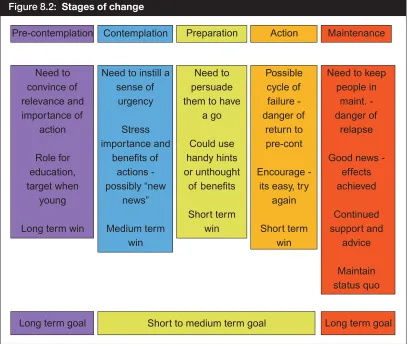
One of the most interesting findings from the workshops was the shift in views relating to speeding interventions: specifically, average speed cameras, 20 mph zones and traffic calming. The deliberative nature of the study illustrated that, although people were initially sceptical about these interventions, with reasoned debate in the group discussions, their views changed and acceptability increased dramatically. This strongly suggests the public are now at the ‘preparation stage’ in terms of change and will be willing to give these interventions a go if backed up with appropriate communications and enforcement campaigns.
The concept of shared space was the least supported intervention. Despite this, the research suggests that, because of the way in which people adjust their behaviour to minimise risks, shared space designs may enable people to be more aware of other road users and also help to re-establish norms that are guided by individual
Overall, the research highlights the importance of taking into account driving identity, road culture and risk-taking when designing interventions on the ground. As well as traditional approaches, social marketing, new technologies and the novel design of space should play a role in thinking through the 3Es (Education,
understanding of how the public engage with the issue of road user safety.
The DfT commissioned TNS-BMRB and the Centre for Transport and Society at the University of the West of England (CTS) to examine public attitudes to road safety in the context of other attitudes, identities, lifestyle and values. The research was qualitative in nature and brought together the views of a wide range of adult road users. The project aimed both to develop the evidence base on public attitudes to road safety and to support the development of policies aimed at improving road safety. The objectives for the research were as follows:
1. To review and synthesise existing research on public attitudes to road safety to inform subsequent research components.
2. To explore public understanding, attitudes, experiences towards road safety, getting beneath ‘top of mind’ responses, in the wider context of attitudes, identity, motivations, values, lifestyles, life-stages and behaviour to develop a framework to improve understanding.
3. To explore how attitudes change in response to the provision of information about road safety issues and policies.
4. To consider the relationship between attitudes and behaviour and to identify and explore the barriers and incentives to behavioural change that could result in improved road safety.
5. To inform post-2010 and wider road safety policy development.
6. To make recommendations for how the findings from this research could inform a future quantitative study.
The study used a deliberative approach to engage the public in discussions around road safety and risk. These in depth techniques are viewed as overcoming some of the limitations of top down consultative styles, providing a forum for reflective and informed discussion between people with a range of views and values. The
deliberative approach built on an initial literature review (Musselwhite et al., 2009)
1.1
Findings from the pre-stage literature review
1.1.1
Self
and
others
Overwhelmingly, in the critically reviewed literature there seems to be a consensus that drivers and pedestrians see themselves as competent and safe road users and that it is other people who are more risky and dangerous. Individuals see themselves as law abiding and, if they take any risks, they do so within their own judgment of safety. Hence, they freely admit to speeding safely and consider that it is other drivers who speed unsafely.
The concept of self as safe and others as dangerous may explain the reason why there are high levels of support for stricter enforcement of speed limits and harsher penalties for dealing with poor road user behaviour, because individuals view such interventions as being aimed at other road users rather than at themselves. In this regard, increasing support for speed limiters and ‘black box’ technology is also found.
In addition, the management of risk when driving is viewed as being in the hands of the individual, with people distancing themselves from other drivers and collisions. As noted by Flamingo International Strategic Research (2008), drivers emotionally detach themselves from collisions, even if they have been involved in them. In short, many drivers believe their own agency is high – they are in control and therefore any collision is out of their control.
More broadly, the literature highlighted that driving identity is formed through individual and group behaviour. Specifically, people on the road identify with a particular in-group, all of whom drive safely, and an out-group, all of whom drive dangerously. Such out-groups for the general public typically include white van drivers, company car drivers, young drivers, motorcyclists and school run mums.
The review recommended that the research examined how this ‘distant relationship’ between the self and others is formed, maintained and justified.
1.1.2
Norms
Normative pressures were described in two different ways in the review. First, social norms appear to influence road user safety behaviour through the exchanging of attitudes. Speeding, for instance, is often viewed as justifiable, because many other drivers speed. Additional heuristics or rules of thumb maintain such behaviour, with a belief that drivers will not be caught for speeding or that authorities turn a blind eye to speeding in certain areas.
behaviour, on adolescent pedestrian behaviours and on children’s cycle helmet use. However, less well researched are the effects of peer pressure at other ages and for other types of road user behaviour.
In addition, there are also gaps in research concerning who exactly the other influential groups are – is it all others, or significant groups like themselves? Related to this, it will be important to explore how car adverts, emphasising speed and aggressive driving, influence the norms of driving behaviour. How are such themes maintained by the press, television and other popular culture? How do these normative influences affect own norms and values, and what happens when
normative influence from others is not consistent or is at variance with the individual’s own views?
A study of the individual differences at a disaggregate level is required to understand attitudes and road user safety. Much of the work to date has ignored interesting outliers and tends to try to treat the road using community as an
homogeneous group. Where research has looked for differences between groups, it tends to have used background details, such as age, gender, driving experience and socioeconomic group to show differences between attitudes. Some studies have used
post-hoc categorisation (Blincoe et al., 2006; Fuller et al., 2008; Musselwhite,
2004a,b) based on clusters of similar attitudes or behaviours in order to explain differences. The review recommended that such a segmentation approach could have merit in targeting specific interventions and the research should examine different road user, life-stage and attitudinal groups.
1.1.3
Road
user
groups
The reviewed literature typically investigated the attitudes of one aspect of road user behaviour, for instance the attitudes of drivers or of pedestrians, with little regard for the concept that drivers are also pedestrians and may at other times be cyclists or motorcyclists. The research that found greater empathy towards motorcycles by car drivers who were themselves motorcyclists or had motorcyclists in their close family or friends, suggesting this theme could be taken further for other road user
behaviour (Crundall et al., 2008).
The review recommended that the research needed to understand road user attitudes from the perspective of an individual: specifically, how and under what contexts do individual attitudes towards road user safety vary?
More research is needed on a variety of road user attitudes that have not been well covered in the past. In particular, it is suggested that research is needed to examine the attitudes of pedestrians (especially adults), motorcyclists (of all ages) and cyclists (especially adults). In addition, public attitudes towards initiatives such as shared space concepts and psychological traffic calming would be useful. Links between attitudes for other concepts linked to transport and road user behaviour would similarly be of potential value to study, not least attitudes to the environment and attitudes to road user safety – do those who think green drive more safely, for example in order to save fuel? Finally, further research needs to ascertain the role of habit in maintaining some of the behaviours, in order to reveal preconscious and subconscious decisions in aberrant road user behaviour.
It was proposed that further stages to the research should aim to uncover more detail on the above areas of interest and contention. A deliberative approach was used, targeting specific individuals in workshop settings, in order to gain insight and depth of road user views in a social context.
A comparison of findings from this study relative to the literature is provided in Appendix 1.
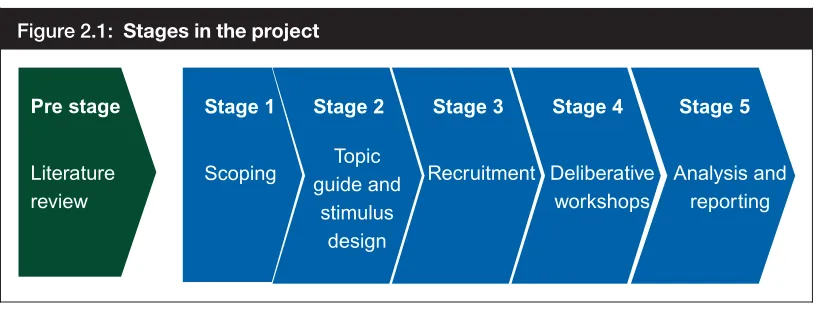
literature review, a five-stage research design was developed (see Figure 2.1).
Figure 2.1: Stagesintheproject
Stage 1 Scoped the issues to be addressed with the Department for Transport in response to a presentation and discussion of findings from the literature review.
Stage 2 Designed topic guides, stimulus materials and other exercises to help guide and inform discussion.
Stage 3 Involved the recruitment of members of the public to take part in the research.
Stage 4 Delivered three waves of workshops in four locations across the UK.
Stage 5 Comprised a depth analysis of the workshops and production of the final report.
A deliberative research approach was used to enable participants to discuss road safety issues in depth and engage in an informed discussion. Specifically, 240 participants were recruited in groups of ten. Participants were reconvened in three different workshops, each in turn exploring views on: risk, the relationships between different road users, and policy interventions to promote road safety.
2.1
Sample
The research engaged 240 members of the public across the following four locations in the UK:
•
London;•
Bradford; [image:20.595.135.544.155.310.2]The areas were chosen to reflect a range of socioeconomic variables as well as a mix of urban (London, Glasgow and Bradford) and rural (north-west Wales)
environments. Within each area, 60 participants were recruited into one of six groups, with ten participants in each group, selected in response to gaps identified in the literature review and including different road user groups, life-stages and
attitudes to risk. Specifically, in each area, the groups comprised:
Group 1: Young male drivers (YOUNG MALES)
Group 2: Those who drive for work aged 21–54. (DRIVE TO WORK)
Group 3: Those with children under the age of 16 (aged between 21 and 54) (CHILDREN IN HOUSEHOLD)
Group 4: Older people (both drivers and non-drivers aged 55+). (OVER 55s)
Group 5: Younger working people with no children yet (aged 21–34). (WORKING, NO CHILDREN)
Group 6: Individuals with different attitudes to risk. These were:
•
People who predominantly take risks (Bradford).
•
People who predominately do not take risks (north-west Wales).
•
People who take risks when under stress (late for work etc.) (London).
•
People who take risks when they think it is safe to do so (driving fast late at
night etc.) (Glasgow).
Within each group, participants were also recruited to comprise a mix of car drivers, motorcycle riders, cyclists and non drivers. Each of the six groups comprised 10 participants – with a total of 60 per area.
A full breakdown of the expected and achieved sample is provided in Appendix 2.
2.2
Recruitment
Recruitment was undertaken through ‘free find’ techniques, where members of the public were approached face to face and asked to undertake a screening
Two screening questionnaires were developed, the first to screen respondents based on demography (groups 1–5) and the second containing attitudinal questions for the risk groups (group 6).
Once recruited, respondents were sent a confirmation letter and phone call in the week leading up to each of the three workshops.
A staged incentive was used to minimise drop-out rates throughout the three waves of the research. £30 was given to respondents for wave 1, £50 for wave 2 and £100 for wave 3.
2.3
Experts in the process
In addition to members of the public, specialists from UWE’s Centre for Transport and Society were also involved in each of the workshops. The role of specialists was twofold:
1. Factual information was provided by the Department for Transport, and the experts presented and contextualised the factual information to respondents to inform their understanding of road safety issues.
2. To act as a group resource, by answering respondents’ questions and also assisting group deliberation.
All specialists were fully briefed on their role in the workshops and a moderator facilitated their involvement in discussions.
The Centre for Transport and Society team comprised:
•
Dr Charles Musselwhite, Senior Lecturer in Traffic and Transport Psychology.
•
Dr Erel Avineri, Reader in Travel Behaviour.
•
Dr Eamon Fulcher, Senior Lecturer in Behavioural Psychology.
•
Dr Yusak Susilo, Senior Lecturer in Transport and Spatial Planning.
2.4
Workshops
–
Table 2.1: Datesoftheworkshops
Area Workshop1 Workshop2 Workshop3
Glasgow Bradford London North-west Wales
15and16April2009 15and16April2009 22and23April2009 22and23April2009
6and7May2009 6and7May2009 13and14May2009 13and14May2009
30May2009 30May2009 6June2009 6June2009
Each workshop focused on a different road safety issue:
•
Workshop 1 explored risk taking on the road in the context of wider risk taking and norm guiding behaviours.
•
Workshop 2 explored the relationship between different road user groups, including car drivers, motorcyclists, cyclists and pedestrians.
•
Workshop 3 explored participants’ views on potential road safety interventions, in terms of perceived effectiveness and fairness.
For all three workshops, topic guides and stimulus material were developed to guide and inform the discussion. As noted above, experts in transport policy were also available for participants to consult with regard to specific queries that emerged from debate. Details of the workshops are given next. Full topic guides, as well as an overview of the stimulus materials and pre-tasks, are in Section 3.
2.4.1
Workshop
1:
Risk
and
road
safety
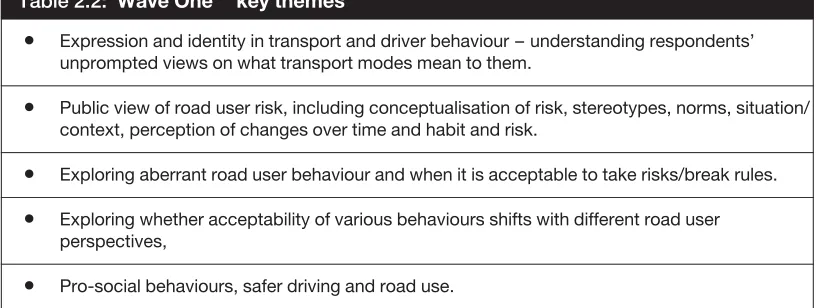
[image:23.595.92.500.586.740.2]The first workshop explored the relationship between identity and driver behaviour, within the context of wider risk taking. Specifically, it examined how these factors mediated attitudes to road safety – for instance views on whether and under what circumstances it is acceptable to break rules on the road. In this regard, the role of norms influencing road safety behaviour was also explored – both in terms of promoting good and poor driving. Key themes for workshop 1 are summarised in Table 2.2.
Table 2.2: WaveOne keythemes
• Expressionandidentityintransportanddriverbehaviour–understandingrespondents’ unpromptedviewsonwhattransportmodesmeantothem.
• Publicviewofroaduserrisk,includingconceptualisationofrisk,stereotypes,norms,situation/ context,perceptionofchangesovertimeandhabitandrisk.
• Exploringaberrantroaduserbehaviourandwhenitisacceptabletotakerisks/breakrules.
• Exploringwhetheracceptabilityofvariousbehavioursshiftswithdifferentroaduser perspectives,
–
Between workshops 1 and 2, participants were asked to undertake a pre-task to map local roads that they perceived to have significant road safety issues. This mapping exercise was used to inform the debate in the second workshop.
2.4.2
Workshop
2:
Place,
identity
and
road
safety
The second workshop built on the previous discussion by exploring the relationship between place, identity and road safety. Specifically, it explored how location and driver familiarity influenced perceived risks, attitudes and ultimately behaviours on roads. The role of wider norms in influencing behaviours was also highlighted. Finally, participants considered issues on the road from different road user
perspectives – this different hats session looked at the differences in perceived risks
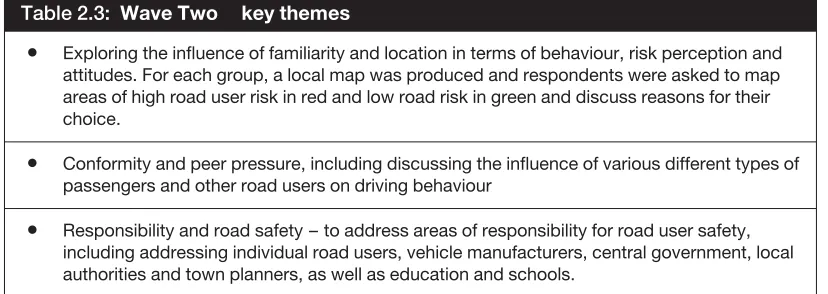
[image:24.595.133.547.315.462.2]on the road between car drivers, motorcyclists, cyclists and pedestrians. Finally, responsibilities for safety on the road were also explored. Key themes for workshop 2 are summarised in Table 2.3.
Table 2.3: WaveTwo keythemes
• Exploringtheinfluenceoffamiliarityandlocationintermsofbehaviour,riskperceptionand attitudes.Foreachgroup,alocalmapwasproducedandrespondentswereaskedtomap areasofhighroaduserriskinredandlowroadriskingreenanddiscussreasonsfortheir choice.
• Conformityandpeerpressure,includingdiscussingtheinfluenceofvariousdifferenttypesof passengersandotherroadusersondrivingbehaviour
• Responsibilityandroadsafety–toaddressareasofresponsibilityforroadusersafety, includingaddressingindividualroadusers,vehiclemanufacturers,centralgovernment,local authoritiesandtownplanners,aswellaseducationandschools.
Participants were asked to undertake a pre-task between workshops 2 and 3. For each of the six road safety groups outlined above, one participant was selected, provided with a video camera and asked to make a short video diary considering risks on the road. The video was then edited down and used as stimulus material in workshop 3.
2.4.3
Workshop
3:
Road
safety
interventions
The final workshop sought to test various specific policy options and began with a presentation supplied by the Department for Transport, on potential interventions in road user safety. This included:
•
Statistics highlighting key aspects of road user safety.
•
Aims and proposed approach in the consultation on the post-2010 Road Safety
Strategy.
–
•
Proposed new measures aligned with the consultation on the Post-2010 Road
User Safety Strategy.
From here, participants considered the evidence and debated on the effectiveness and fairness of each road safety intervention in depth. As well as discussing
information in the groups, they also completed an interactive voting session, which explored their views on interventions pre- and post-debate. Specifically, using audience engagement technology, participants were asked vote on whether they agreed or disagreed with specific road safety interventions. Questions were repeated at the end of the workshop to examine changes in views over time.
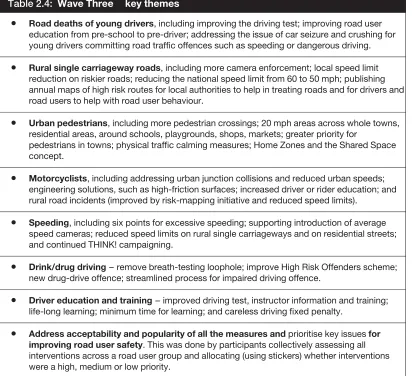
[image:25.595.93.505.274.650.2]Key themes for workshop 3 are summarised in Table 2.4.
Table 2.4: WaveThree keythemes
• Roaddeathsofyoungdrivers,includingimprovingthedrivingtest;improvingroaduser educationfrompre-schooltopre-driver;addressingtheissueofcarseizureandcrushingfor youngdriverscommittingroadtrafficoffencessuchasspeedingordangerousdriving.
• Ruralsinglecarriagewayroads,includingmorecameraenforcement;localspeedlimit reductiononriskierroads;reducingthenationalspeedlimitfrom60to50mph;publishing annualmapsofhighriskroutesforlocalauthoritiestohelpintreatingroadsandfordriversand roaduserstohelpwithroaduserbehaviour.
• Urbanpedestrians,includingmorepedestriancrossings;20mphareasacrosswholetowns, residentialareas,aroundschools,playgrounds,shops,markets;greaterpriorityfor
pedestriansintowns;physicaltrafficcalmingmeasures;HomeZonesandtheSharedSpace concept.
• Motorcyclists,includingaddressingurbanjunctioncollisionsandreducedurbanspeeds; engineeringsolutions,suchashigh-frictionsurfaces;increaseddriverorridereducation;and ruralroadincidents(improvedbyrisk-mappinginitiativeandreducedspeedlimits).
• Speeding,includingsixpointsforexcessivespeeding;supportingintroductionofaverage speedcameras;reducedspeedlimitsonruralsinglecarriagewaysandonresidentialstreets; andcontinuedTHINK!campaigning.
• Drink/drugdriving–removebreath-testingloophole;improveHighRiskOffendersscheme; newdrug-driveoffence;streamlinedprocessforimpaireddrivingoffence.
• Drivereducationandtraining–improveddrivingtest,instructorinformationandtraining; life-longlearning;minimumtimeforlearning;andcarelessdrivingfixedpenalty.
• Addressacceptabilityandpopularityofallthemeasuresandprioritisekeyissuesfor improvingroadusersafety.Thiswasdonebyparticipantscollectivelyassessingall interventionsacrossaroadusergroupandallocating(usingstickers)whetherinterventions wereahigh,mediumorlowpriority.
2.5
Analysis and reporting
review of the data a thematic framework was constructed. The analysis then proceeded by summarising and synthesising the data according to this thematic framework.
When all the data has been sifted, it was mapped to identify features: defining concepts such as road user identity, finding associations such as attitudes to risk and road user behaviour, and providing explanations as to why views on certain
interventions were likely to be held.
3
FINDINGS: PUBLIC CONCEPTUALISATION OF
RISK
3.1 General views on road safety
On the whole, respondents felt that the UK’s roads are fairly safe to use for all modes of transport, and this was especially the case for car drivers. However, certain groups of road users were viewed as a greater risk – in particular, younger drivers and teenage pedestrians, though younger people were more likely to state that older drivers were also a risk. Spontaneously discussed in two of the Bradford groups was that driving is getting more dangerous over time, with drivers showing worse habits and becoming more aggressive.
There was broad agreement that motorcycling was dangerous as a whole, but not all motorcyclists were necessarily risky riders. Rather, the vulnerable nature of the motorbike compared to a car was noted, together with car drivers not having the skills, especially perceptual skills, to deal with motorbikes.
Walking and cycling were largely felt to be less safe than driving – this was especially true for cycling in city centres (especially in Glasgow and London) and walking on rural roads. Largely this was due to the vulnerable nature of walking and cycling and the perception of danger from vehicles. Also discussed was a lack of understanding and respect between different road users, which resulted in car drivers not understanding when pedestrians or cyclists have priority. This was a cause of safety concern for the respondents.
Public transport was felt to be relatively safe to travel on, although there was a discussion in two groups about the dangers of buses pulling out in front of car drivers. Amongst the 55+ age-group, there was some discussion that no transport was safe from a personal safety point of view. Other groups noted that public transport did not feel safe to travel on late at night.
Walking was noted as being particularly unsafe from a personal safety point of view in north-west Wales and also in Bradford, where respondents emphasised feeling very unsafe at night.
3.1.1
Relative
impression
of
risk
on
the
roads
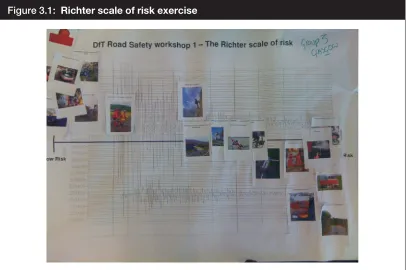
Figure 3.1: Richterscaleofriskexercise
Across all groups the following were usually observed:
Low risk and high likelihood to perform (in order from lowest risk):
•
Reading a book.
•
Getting a train from Glasgow to London.
•
Bus to work (although lack of seat belts was noted by some groups making it a
slightly higher risk).
•
Flying.
•
Car on holiday (usually low risk – though some noted higher due to
unfamiliarity of roads).
•
Cycle for recreation (usually low risk as assumed mostly off road and low
speed).
•
Pedestrian crossing (usually low risk amongst most respondents from urban
areas, less agreement on the relative nature of the risk for those in rural areas who felt vulnerable when crossing at formal and informal crossings).
High risk and low likelihood to perform (in order from medium to highest risk):
•
Motorcycling for leisure (generally high, as recreation associated with
motorbikes tended to be viewed as testing speeds and skills).
•
Cycling in rush hour (generally high risk, but depends on quality of route – off [image:28.595.136.542.73.343.2]
•
Motorcycle to work (high risk because of the nature of going to work, which may involve being in a hurry, and habitual behaviour and negotiating rush hour traffic).
•
Drink driving (on the whole agreement that it is high risk but does depend on
how much someone drinks and individual tolerance levels).
•
Drug driving (largely viewed as a higher risk than drink driving, especially as it
is believed more difficult to detect for the police):
‘I’ve crashed a vehicle when I was younger after a weekend of all sorts, you know [LAUGHS]. . .I was talking about it the other day. We were talking about the reaction of the police because they came the next day and I couldn’t even remember having the crash, my mum woke me up telling me the police were downstairs, you know. [Laughs]. . .And as I went downstairs it did sort of flood back. They took me up to the scene to assess the damage on the wall that I’d gone through and that was it. They never breathalysed me. They never questioned whether. . .I just said I fell asleep at the wheel’
(Male, north-west Wales, children in household)
•
Overtaking on blind bend (very high risk – viewed higher than drink driving, as
there is even less control of what might happen):
‘You’ve got a chance when you’re drinking and driving. You’ve got no chance on a blind bend.’
(Male, north-west Wales, working, no children in household)
•
Smoking (often placed as highest risk).
Less agreement was found amongst:
•
Climbing (very much depends on equipment and other less predictable factors,
such as wind and weather).
•
Working on an oil rig (mixed between a view as high risk, dangerous work
through to being heavily regulated, so not very dangerous).
•
Bungee jumping (very mixed response, from very safe because of being heavily
regulated, through to being very high risk).
•
Walking on a country lane (mixed response. from very high risk – noted
particularly by those in rural areas – to being very low risk from those in urban areas):
‘I just think rural lanes, you know, people are more likely to be hugging the sides of the road because of the width of the road so if they come around the corner and somebody’s there, you know, I wouldn’t like to do it.’
‘When did you last hear of somebody dying walking on a country road?’
(Male, Bradford, working, no children in household)
The exercise provided interesting insights into how respondents conceptualise risk and other aspects of road user behaviour. It highlighted that risk could differ between risk to self and risk to others. Hence, something could be viewed as high risk to an individual but low risk to others. These risks were generally tolerated.
When other individuals were affected – particularly innocent parties – this was felt to make the risk unacceptable, with respondents giving the example of passive smoking in this regard. However, dangers resulting from risky road user behaviour did not inherently get put into this category, except drink driving, drug driving and overtaking on a blind bend.
Certain participants made a further distinction whereby ‘other people’ could be subdivided into those directly impacted by the risk, and those indirectly impacted by the risk. Those directly impacted tend to be considered (such as the innocent party with whom the vehicle collides), whereas indirectly affected individuals (friends and family of the casualty) are less likely to be considered. Hence, participants who do not wear a seat belt believed this is OK, because it is viewed as a risk to them personally – with the wider impact on people they knew a limited influence on behaviour.
The discussion also showed how individuals considered risk in terms of both the likelihood of a negative incident occurring and the perceived consequences of the incident. Hence, they believed the likelihood of an accident on an aeroplane generally to be very low, but the severity of the consequence from such an incident would be extremely high. It has been demonstrated in other studies that people tend to be more risk averse to extreme events happening, because of this ‘dread factor’, but are more likely to tolerate more routine risks, such as driving (Slovic, 1997).
Overall, when participants made a decision on where the risks lay, context was key. For example, drink driving depended very much on an individual’s tolerance levels, and cycling to work in rush hour is dependent on quality of roads and cycle paths as well as behaviour, attitude and skills of other drivers. In very few cases did
respondents weigh up the costs of the risk against the benefits, suggesting that positive outcomes of taking the risk behaviour did not feature centrally when assessing the risk in this task.
the control of the individual and, as such, is lower risk than some other situations, unless control is compromised in some way, such as by drink or drugs.
3.1.2
Perceptions
of
dangerous
road
user
behaviour
The respondents described a number of different factors that they felt contributed to dangerous road user behaviour in general. These centred on the following aspects:
3.1.2.1 Distraction
Not focusing on the skills required to drive a vehicle as a result of being distracted, particularly by mobile phones, but also having children in the car, listening to loud music, reading billboards and road signs, looking for speed cameras, changing a CD, window shopping, putting make-up on and seeing the results of other road
collisions. In addition, other aspects that centred on distraction were mentioned by respondents, including having their mind elsewhere. Discussions in particular centred on being in a hurry because of being late (especially noted by those who drive for work and those with children in household).
3.1.2.2 Failure to adjust to conditions
A lack of adjustment of driving style in relation to the environment was also highlighted – especially in terms of not adapting to changing or adverse weather. Being impaired by alcohol and illegal drugs was noted in certain groups, with
tiredness and fatigue also discussed as a key issue. Eating while driving was noted to impair road user safety and was discussed in many of the groups. A minority of groups also noted that smoking and driving could be dangerous.
3.1.2.3 Poor road design and maintenance
External factors such as poor road design were discussed in an urban group, whereas the more general note on road maintenance and in particular potholes being an issue were noted by a variety of groups, especially those in rural areas.
3.1.2.4 Congestion
Congestion was noted as being a contributory issue in dangerous road user behaviour by only one group – the occasional risk takers in Glasgow.
3.1.2.5 Unfamiliarity vs. complacency
3.1.2.6 Attitudes, personality and emotion
Attitudinal or personality factors were rarely noted, although lack of patience was noted by an older group of respondents in rural north Wales.
Emotive issues such as being stressed, upset, angry or showing road rage were discussed by groups across the board in urban and rural areas.
3.1.2.7 Peer pressure
Influence of others, resulting in individuals inappropriately showing off and behaving in a risky manner on the road, was noted by all groups but was largely discussed in terms of being more prevalent amongst younger drivers. Younger drivers also noted the influence of driving with friends as a particular cause of dangerous driving. In addition, individuals were influenced by how other people behave on the roads through norms of behaviour, with younger groups again highlighted in this regard. Computer games and the influence of films on driver behaviour were also noted as contributing to poor road user safety of others.
Driving a high-powered or new car can negatively influence driving style, an issue especially noted by younger drivers themselves. Younger drivers also noted a sense of achievement and fun with regard to driving fast and overtaking. Younger groups also mentioned driving late at night as a contributing factor to dangerous driving.
3.1.2.8 Time pressure
Time pressure was highlighted by those who drive to work and those with children in the household, with this latter group also highlighting being distracted by children in the car. Drivers aged 55 years and above did not mention any of these issues being a factor. Therefore, despite the question being generic and not about themselves directly, respondents primarily thought about this issue from their own perspective or at least from that of people similar to themselves.
3.1.2.9 Lack of skills
Lack of skills in relation to driving behaviour was only noted by one rural group of 21–34-year-old workers. Driver violations were rarely noted as contributing to danger on the roads, and speeding was only noted by one group of low risk takers in Glasgow. Driving too slowly for the conditions was noted as dangerous by only one group – the younger male driving group in Glasgow.
driving in an unusual situation. Walking and cycling, on the other hand, involved a discussion of skill problems rather than factors affecting the skill, so discussion centred on inappropriate crossing of the road, not understanding other road users, and violations such as cycling through red traffic lights. In addition, discussion on cycling also involved issues of precautions not being taken – cycling off-road when this is available, safety helmets, not having a bell, lighting and visible clothing all being noted as contributing to road safety.
3.1.3 Stereotypes and road safety
On the whole, respondents described younger drivers as key risk takers on the road, as they drive far too fast, have less experience, are over confident, more likely to want to impress their friends and become distracted by the radio. They are also less courteous, more impatient and show more disrespect. There was mixed opinion about whether they are more likely to drink drive. However, such stereotypes largely came from older groups, with younger groups stating that labels such as ‘boy racer’ were unfair, as they are just as likely to be good drivers. On the whole, it was felt that it was largely males, not females, that were the problem, although certain groups noted a growing number of females who were deliberately fast or dangerous drivers.
It was also discussed in certain groups that this behaviour was not just confined to driving; similar aggressive and dangerous behaviour was perceived in younger pedestrians and cyclists.
Older drivers were largely viewed as being too slow and lacking relevant knowledge, skills and experience of current road conditions. In addition, they were viewed as being a danger because of reduced reaction times. Largely this was a view held by younger participants.
Professional drivers, including taxi, lorry and delivery drivers – the so called ‘white van man’ – are stereotypically viewed as very dangerous and erratic.
Cyclists were also seen negatively by other respondents – being aggressive, weaving in and out of cars, running red lights and often using pavements to get to where they wanted without a thought for pedestrians. Similarly, motorcyclists were viewed negatively too by other respondents – especially with regard to speed on rural roads and weaving in and out of traffic in urban areas. These specific road user groups are discussed in more depth in Section 6.
3.2
Respondents’ own driving behaviour
3.2.1
Deliberate
risks
In many groups, the discussion began around speeding behaviour. On the whole, respondents admitted to deliberately speeding on occasion, but in all cases defended their decision. It was common for respondents to state they drove at a speed of their own choice that they still felt was safe – reasons for this included: feeling speed limits were too stringent or were out of date with modern technology of cars and their ability to brake more quickly; speeding when roads were empty; and speeding on motorways, which was often perceived to be of very little risk.
Other risky manoeuvres were discussed by drivers, such as inching a vehicle out into the road when turning right onto a busy main road. This was justified by the view that otherwise it would take a long time to make the manoeuvre. Running through traffic lights was also noted from simply not braking on an amber light through to admitting to deliberately going through red lights. This again was justified as taking a calculated risk – for instance, that there was little other traffic around.
Overtaking was a common risky manoeuvre and was discussed widely in relation to motorways or dual carriageways – for instance when ‘other drivers were hogging a lane’. This was particularly noted by the north-west Wales groups, who often had to overtake on rural roads, particularly single carriageways, to pass slower moving traffic such as lorries or farm vehicles.
Being distracted while driving was also noted by the respondents, including
daydreaming, checking self and doing make-up in the mirror, answering or using a mobile phone, map or sign reading, and eating and drinking. All such behaviours were commonly performed while driving. Other than mobile phones, all of them were seen as being only a minor risk. This contrasted with views when considering risks for other drivers, when distraction was seen as more significant.
There was admission to drink driving amongst those in the rural and London groups in particular. Reasons for such behaviour varied from being at an unusual or one-off event, such as a birthday, to more frequent drink drivers arguing that they were able to know how much drink they had had before it impaired their driving. Such
behaviour generally met with disapproval from other group members.
Driving while tired was not uncommon, and a few individuals noted that they drove when they were dangerously tired. One individual stated he had crashed three times after falling asleep at the wheel. In all cases, being tired was legitimised through extenuating circumstances, including unusually long hours of work or having to drive a long distance.
vehicle use seat belts, especially children. Commonly, they stated they had never got into the habit, or felt that wearing a seat belt was simply too uncomfortable. Two individuals also noted that wearing a seat belt could be dangerous in certain crashes, as individuals could not get out of a vehicle or had been strangled with the belt – in both cases personal examples were cited.
Risky pedestrian behaviour predominantly involved dashing or running across the road, dodging vehicles or having to wait again in the middle of the road to cross. Not waiting for the green man at a pedestrian crossing was also cited as a typical
behaviour for those in urban areas. Crossing the road while drunk was also noted by the higher risk-taking groups.
Taking risks while using a motorbike typically involved overtaking and undertaking at inappropriate times.
Specific risks taken while cycling involved running red lights and going through junctions without stopping; typically this was amongst younger groups. Drink
cycling was also noted as a dangerous behaviour. Those in urban areas noted cyclists using a towpath or footpath to reduce the danger from other traffic.
3.2.2
Reasons
for
deliberate
risks
The most commonly cited reason for taking any risk on the road in any mode – walking, cycling, motorcycling or driving – centred on reducing journey time because of being late, whether being in a hurry or just wanting to get to work or home quickly:
‘I do manoeuvres that the Highway Code wouldn’t necessarily be happy with but if you don’t, you’re never going to get home.’
(Male, Bradford, children in household)
‘I’m an amber gambler, if I’m in a rush, mostly if I’m in a rush. I won’t do it, if I’m not in a rush, I’ll just sit at the lights.’
(Female, London, children in household)
The need for arriving on time to school and work was often considered a higher priority than driving with less risk.
It was also stated that the risky behaviour was only displayed when the individual believed they could manage the risk – for example if the road was empty or it was early in the morning. Such behaviour was argued as a calculated decision.
‘You get complacent. . .About what you do every day.. . .just came to mind, familiarisation breeds contempt, you know, that’s what we are saying really that the more use the same road, the less attention you pay on that road.’
(Male, north-west Wales, drive to work)
Norms of behaviour within certain contexts were said to fuel risk taking behaviour. This most cited norm was keeping up with the traffic flow. In addition, also noted by some respondents, was a need to behave in a manner that would be expected of them. The idea of ‘playing up to stereotypes’ was also used to legitimise risk:
‘I’ve got a white van, so it’s like that’s the rule, isn’t it? [laughs]’
(Male, Bradford, working, no children in household)
The influence of others often pressured drivers to take risks, particularly cars driving close behind:
‘I find those sorts of situations [stressful], when you’re being pressured from behind to make an erratic move which could end up causing something else, you know.’
(Male, north-west Wales, drive to work)
The influence of others was very much seen in pedestrian behaviour, where individuals stated that seeing other people take risks makes them do so. For
instance, several groups noted that seeing individuals cross the road on a red man or where it is dangerous influenced them to make the same choice. Previous research suggests such an influence is key amongst adolescents, but it was a variety of groups who admitted to performing such behaviours in this research, including the oldest group.
Groups were split as to whether more or less risk is shown during the rush hour. One group definitely stated they took more risks in order to speed up the process of movement; another stated that they never took risks during rush hour, as it is so congested and dangerous with a variety of road users.
3.2.3
Non-deliberate
risks
It was a common theme that respondents often found themselves unintentionally speeding, particularly when they had been keeping up with traffic. In addition, participants noted that not paying attention to speed can mean that it creeps up significantly over the speed limit, particular when driving on clear roads. Though, overall, speeding as a result of not knowing the limit of the road was not cited as a key issue, on unfamiliar roads and those with variable speed limits it was a greater concern.
3.2.4
Changes
in
risk-taking
over
time
The majority of respondents felt their own driving had become safer with increasing maturity, largely because of increased driving experience, including: having, seeing or knowing people in accidents and learning from these; a reduction in negative peer pressure; having responsibilities such as children and a job that requires driving; a growing sense of mortality; increased tolerance for others’ behaviour; and a realisation that driving faster does not actually match a reduction in time taken to travel. Younger drivers themselves also noted a change in their behaviour – stating that their driving behaviour generally became less risky as they got older. This was both as they mature, but also as the novelty and excitement wear off.
‘I think I am better. I have calmed down a lot. I’m more aware. I used to have a moped when I was sixteen. I was hyperactive when I first started. I was here, there and everywhere, driving all day long every day. It is a new thing. But once you get used to it, it is nothing. You always feel it when you first pass, forty seems fast on a moped when you go round corners, but after you have been on the motorway and country roads, it is boring.’
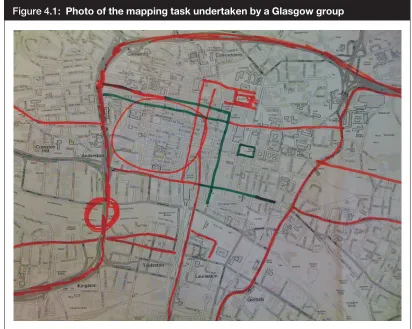
As noted earlier, respondents completed a pre-task between workshops 1 and 2. The pre-task consisted of a mapping task to describe any areas of road user risk they encountered (see Figure 4.1).
Figure 4.1: PhotoofthemappingtaskundertakenbyaGlasgowgroup
The findings broadly fit two main categories – specific spatial areas of risk, and recording of aberrant road user behaviour.
4.1.1
Spatial
areas
of
risk
Common examples of risky areas involved road user safety at junctions and roundabouts. This was a particular issue where different types of road user were interacting, such as areas of high car, cycle and pedestrian usage in city and town centres. This was compounded by larger vehicles such as delivery vehicles and buses. The location of schools, if near to a junction, was a significant issue across groups. Pedestrians were both concerned about trying to cross the road at
[image:38.595.131.543.199.528.2]The inability of traffic lights to manage traffic flow effectively, particularly at rush hour, was a concern in certain groups. Blind spots and having obscured vision at junctions were mentioned frequently as being key areas of concern for car drivers. Tight bends at junctions also meant larger vehicles mounted pavements and had to cut across cycle lanes, which impacted on both walking and cycling. Traffic going too fast at junctions and roundabouts was also a key concern for all groups of road users.
Danger was often perceived when a number of these factors came together at once. Most of the examples come from urban groups, especially those in Bradford and Glasgow.
Busy main roads were also cited as key areas of road safety concern for cyclists and pedestrians. Cyclists often lacked room to manoeuvre and had to deal with fast or confused drivers. Pedestrians find crossing such roads extremely dangerous, and a lack of formalised pedestrian crossings was noted in many groups, especially those in the Bradford area. Examples of concern for the safety of schoolchildren came from a variety of groups, though this had more focus from the groups who had children under the age of 16 in the household. Most comments again stemmed from urban areas, but rural concerns included winding lanes with mixed traffic being very dangerous to all road users.
Residential roads were also noted as being an issue, particularly those that were long, narrow and straight, which encouraged cars to drive fast. This was
compounded by problems of parking, where cars parked both sides of the road or in such a way that forced vehicles to have to use pavements in order to pass, made it dangerous for pedestrians to cross and use the street. Respondents also noted that residential roads with blind bends were dangerous:
‘Pedestrians don’t know when they can cross because there’s so many blind corners. They’ve got a view of one way of the road but haven’t got a clear view of the other way. So they can cross half way but then a car could suddenly come round the bend and they have to go back.’
(Female, Bradford, working, no children)
Of particular note in Bradford was a discussion on how dangerous residential areas are on main dual carriageways:
‘My friend’s house is off a dual carriageway and she’s wanted to come out of her driveway, there’s a bus stop right outside her house so the bus stops her view, the 40 mph road as well so she’s having to judge, and obviously she’s going across the pavement as well so that puts the pedestrians at risk as well.’
A number of examples showed how the road layout can cause confusion for motorists that impacts on other road users. Poor signage and poor road markings, especially around or leading up to junctions and roundabouts, were noted as being dangerous for all road users, causing confusion and lane swapping amongst drivers. Mini-roundabouts can be dangerous, as they cause confusion for motorists, and raised roundabouts can obscure the view ahead, adding confusion. Poor road conditions can be a key problem for cyclists, and this was discussed as a particular issue in the young male group in London.
Speeding itself was seen as a key issue for road user safety. Very fast traffic near schools, in residential areas and in villages was a key issue and impacted severely on pedestrians and cyclists in particular. Where narrow roads involved high speed and a variety of users, including examples of rat-runs, this was an especially dangerous area of concern.
4.1.2
Examples
of
dangerous
road
user
behaviour
Interestingly, examples of dangerous road user behaviour (rather than spatial
analysis per se) came largely from north-west Wales. They involved both (a) being
behind slow drivers, wanting to overtake and get home, and (b) individuals driving too fast for the weather or road conditions. A couple of examples cited poor use of signalling by another road user that could potentially have caused danger. Running red lights was observed by respondents in Glasgow and London, whereas eating while driving had been observed by respondents in north-nest Wales and London. One participant from the over-55 group in north-west Wales said they had observed youngsters playing ‘chicken’, egging each other on to run across a road at a busy roundabout.
4.2
Local analysis of risk hotspots
Each group was presented with a map of the local area and asked to identify key areas of safe and dangerous driving. On the whole, it was far easier for respondents to locate and cite dangerous areas than it was areas of safety.
4.2.1
Areas
of
high
road
user
risk
of other drivers, though no one was ab