Differential Responses to Woodland
Character and Landscape Context by Cryptic
Bats in Urban Environments
Paul R. Lintott1*, Nils Bunnefeld2, Jeroen Minderman3, Elisa Fuentes-Montemayor4,
Rebekah J. Mayhew5, Lena Olley6, Kirsty J. Park7
1Biological and Environmental Sciences, School of Natural Sciences, University of Stirling, Stirling, Scotland,2Biological and Environmental Sciences, School of Natural Sciences, University of Stirling, Stirling, Scotland,3School of Biology, University of St Andrews, St Andrews, Scotland,4Biological and Environmental Sciences, School of Natural Sciences, University of Stirling, Stirling, Scotland,5Biological and Environmental Sciences, School of Natural Sciences, University of Stirling, Stirling, Scotland, 6Biological and Environmental Sciences, School of Natural Sciences, University of Stirling, Stirling, Scotland,7Biological and Environmental Sciences, School of Natural Sciences, University of Stirling, Stirling, Scotland
*p.r.lintott@stir.ac.uk
Abstract
Urbanisation is one of the most dramatic forms of land use change which relatively few spe-cies can adapt to. Determining how and why spespe-cies respond differently to urban habitats is important in predicting future biodiversity loss as urban areas rapidly expand. Understand-ing how morphological or behavioural traits can influence species adaptability to the built environment may enable us to improve the effectiveness of conservation efforts. Although many bat species are able to exploit human resources, bat species richness generally de-clines with increasing urbanisation and there is considerable variation in the responses of different bat species to urbanisation. Here, we use acoustic recordings from two cryptic, and largely sympatric European bat species to assess differential responses in their use of fragmented urban woodland and the surrounding urban matrix. There was a high probability ofP.pygmaeusactivity relative toP.pipistrellusin woodlands with low clutter and understo-ry cover which were surrounded by low levels of built environment. Additionally, the proba-bility of recordingP.pygmaeusrelative toP.pipistrelluswas considerably higher in urban woodland interior or edge habitat in contrast to urban grey or non-wooded green space. These results show differential habitat use occurring between two morphologically similar species; whilst the underlying mechanism for this partitioning is unknown it may be driven by competition avoidance over foraging resources. Their differing response to urbanisation indicates the difficulties involved when attempting to assess how adaptable a species is to urbanisation for conservation purposes.
OPEN ACCESS
Citation:Lintott PR, Bunnefeld N, Minderman J, Fuentes-Montemayor E, Mayhew RJ, Olley L, et al. (2015) Differential Responses to Woodland Character and Landscape Context by Cryptic Bats in Urban Environments. PLoS ONE 10(5): e0126850. doi:10.1371/journal.pone.0126850
Academic Editor:Danilo Russo, Università degli Studi di Napoli Federico II, ITALY
Received:February 20, 2015
Accepted:April 8, 2015
Published:May 15, 2015
Copyright:© 2015 Lintott et al. This is an open access article distributed under the terms of the Creative Commons Attribution License, which permits unrestricted use, distribution, and reproduction in any medium, provided the original author and source are credited.
Data Availability Statement:All relevant data are available within the paper and on Figshare through http://dx.doi.org/10.6084/m9.figshare.1378695.
Funding:This research was funded by the University of Stirling (www.stir.ac.uk) and the British Ecological Society (Grant number: 3266 / 4045;http://www. britishecologicalsociety.org). The funders had no role in study design, data collection and analysis, decision to publish, or preparation of the manuscript.
Introduction
Urbanisation is one of the most dramatic forms of land use change. By 2050 it is expected that 70% of the world’s population will live in urban areas, this expansion will require rapid urban growth which can fragment, destroy or degrade existing natural ecosystems [1]. This can lead to reductions in species richness, diversity, and changes in community composition within the urban landscape (e.g. [2], [3]). We know relatively little about the underlying mechanisms that make certain species adept at adapting to urbanisation which makes the development of man-agement plans to conserve native biodiversity difficult to formulate [4]. Morphological or beha-vioural factors influence how species respond to the urban landscape, and these traits have been used to classify species as‘urban avoiders’,‘urban utilizers’or‘urban dwellers’[5], although in reality there is likely to be a continuous spectrum of adaptability. Understanding where along this spectrum a species lies will help determine the extent of conservation action required.
The prevalence of many species within the urban environment depends on their ability to survive and adapt to heavily modified landscapes and anthropogenic disturbances. In this re-gard, Chiroptera are one of the few orders of animals in which many species have formed strong associations with human-modified habitats. Human habitations provide roosts, while adaptations of the environment provide food sources, such as‘light-attracted’bat species ex-ploiting insect congregations that form at artificial light sources [6]. However, whilst many spe-cies have adapted to exploit the urban landscape, the general pattern is of lower bat activity and species richness with increasing levels of urbanisation (e.g. [7], [8], but see [9]). Adaptation to the built environment is highly species-specific, for example species with high mobility (e.g. those with fast, high flight) are often able to utilise habitat patches of high foraging potential in an otherwise unsuitable landscape as their movement is relatively independent from structural features. In contrast, slow flying bats may respond more strongly to small-scale features (e.g. road networks) and therefore their ranging ecology and habitat selection may be more heavily impacted [10]. For example, in the Eastern pipistrelle (Pipistrellus subflavus), the location of foraging sites is influenced more strongly by the distance to hibernacula than the level of ur-banisation or degree of woodland fragmentation [11].
Woodland is widely regarded as primary foraging habitat for a range of bat species [12], however urban woodland is of variable quality, subject to invasive species encroachment and often consists of small, fragmented patches [13]. Although management strategies for the conservation of urban woodland are being developed in many countries due to the benefits for human health [14] and biodiversity conservation [15] [16], their effectiveness for the latter is unknown as basic ecological data is lacking for many taxa in urban landscapes. Grouping the conservation requirements of morphologically similar species together would increase the efficiency and effectiveness of management strategies as a greater number of species would benefit from any single conservation action. However, this is problematic if morphologically similar species differ substantially and unpredictably in their response to changes or pressures associated with urbanisation.
In this paper we examine whether closely related species can respond differently to urbani-sation. We use two, often sympatric, cryptic species of pipistrelle batP.pygmaeusandP.
inferred [20]. Consequently, the morphological similarities betweenP.pipistrellusandP.
pyg-maeussuggest that both species will respond similarly to the urban matrix. Specifically, we ad-dress the following three questions:
1. DoP.pipistrellusandP.pygmaeusrespond similarly to urban woodland vegetation charac-ter (e.g. tree density) and patch configuration (woodland size and shape)?
2. DoP.pipistrellusandP.pygmaeusrespond similarly to the composition, spatial configura-tion, and heterogeneity of the surrounding landscape and, if so, at what spatial extent?
3. DoP.pipistrellusandP.pygmaeusexhibit similar habitat selection within the urban matrix?
4. What are the conservation implications of these findings?
Materials and Methods
Ethics Statement
The landowners gave permission for access to all survey sites. All UK bat species are protected and licenses are required if they are to be handled or trapped, however as this study passively monitored their foraging activity there were no licensing issues. The surveying methodology was approved by the Biological and Environmental Sciences ethics committee at the University of Stirling.
Site selection
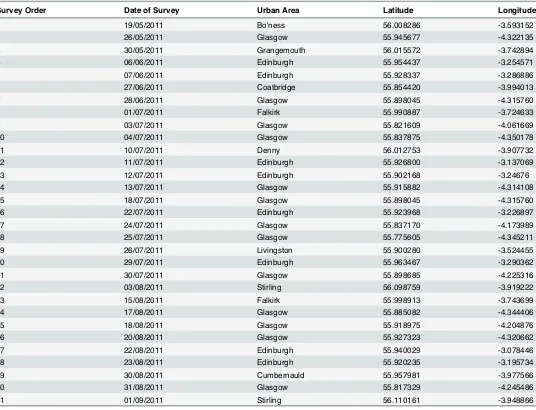
[image:3.612.36.568.461.675.2]A total of 31 urban woodlands in central Scotland, UK (Fig 1;Table 1) were identified using Ordnance Survey digital maps [21] and surveyed between May 19th and September 1st 2011. Urban areas were designated as those where urban cover was the dominant land use within a 1 km grid square as categorised by the Centre for Ecology and Hydrology Land Cover Map 2000. Sites were selected by size, longitude, and degree of urbanisation in the surrounding 1 km using a stratified random sampling method. Selected woodlands were a minimum of 50 years old,
Fig 1. Map of central Scotland showing approximate locations of woodland sites (dark green dots) surveyed in 2011.Map produced using EDINA Digimap Ordnance Survey Service.
and were either broadleaved or consisted of a mixture of conifer and broadleaved trees. Sites were surveyed in random order through the field season to avoid any spatial or temporal bias.
Vegetation surveys
[image:4.612.40.576.87.497.2]Daytime vegetation surveys were conducted within a week of the bat survey to ensure that ap-propriate vegetative conditions were recorded. Four circular plots with radii of 20m were ran-domly located within each woodland patch. At each of the four plots, all trees were counted, identified to at least genus level, and tree basal area measured. Vegetation clutter was measured from 0–4 metres in height at 18 evenly spaced points within each plot to determine vertical for-est structure; adopting a similar approach to Smith & Gehrt [22], a four metre pole with sixteen 0.25 subsections marked upon it was placed at each point within the plot. Any foliage, branches, or stems touching a subsection was counted and summed to provide a measure of clutter (100% clutter occurred when foliage touched all points on the pole in each of the 18 points within the plot). Within each plot canopy cover (%) was assessed at 18 points in each plot using a sighting Table 1. The latitude and longitude of the 31 urban woodlands surveyed throughout central Scotland in 2011.
Survey Order Date of Survey Urban Area Latitude Longitude
1 19/05/2011 Bo'ness 56.008286 -3.593152
2 26/05/2011 Glasgow 55.945677 -4.322135
3 30/05/2011 Grangemouth 56.015572 -3.742894
4 06/06/2011 Edinburgh 55.954437 -3.254571
5 07/06/2011 Edinburgh 55.928337 -3.286886
6 27/06/2011 Coatbridge 55.854420 -3.994013
7 28/06/2011 Glasgow 55.898045 -4.315760
8 01/07/2011 Falkirk 55.990887 -3.724633
9 03/07/2011 Glasgow 55.821609 -4.061669
10 04/07/2011 Glasgow 55.837875 -4.350178
11 10/07/2011 Denny 56.012753 -3.907732
12 11/07/2011 Edinburgh 55.926800 -3.137069
13 12/07/2011 Edinburgh 55.902168 -3.24676
14 13/07/2011 Glasgow 55.915882 -4.314108
15 18/07/2011 Glasgow 55.898045 -4.315760
16 22/07/2011 Edinburgh 55.923968 -3.226897
17 24/07/2011 Glasgow 55.837170 -4.173989
18 25/07/2011 Glasgow 55.775605 -4.345211
19 26/07/2011 Livingston 55.900280 -3.524455
20 29/07/2011 Edinburgh 55.963467 -3.290362
21 30/07/2011 Glasgow 55.898685 -4.225316
22 03/08/2011 Stirling 56.098759 -3.919222
23 15/08/2011 Falkirk 55.998913 -3.743699
24 17/08/2011 Glasgow 55.885082 -4.344406
25 18/08/2011 Glasgow 55.918975 -4.204876
26 20/08/2011 Glasgow 55.927323 -4.320662
27 22/08/2011 Edinburgh 55.940029 -3.078446
28 23/08/2011 Edinburgh 55.920235 -3.195734
29 30/08/2011 Cumbernauld 55.957981 -3.977566
30 31/08/2011 Glasgow 55.817329 -4.245486
31 01/09/2011 Stirling 56.110161 -3.948866
tube with an internal crosshair; if the crosshair intersected canopy vegetation, presence of cano-py was recorded. Data for the four vegetation plots were combined to provide a description of each woodland patch. Additionally, the remaining woodland was visually assessed to ensure that the vegetation surveys were representative of the entire woodland patch.
Bat surveys
Woodland stand survey. Acoustic surveys were used to determine species presence and a measure of relative activity within each woodland patch. Acoustic surveys were undertaken to quantify foraging activity of bats; these are widely used in studies to determine species presence and habitat use for bats (e.g. [23,24]), and there is evidence that pipistrelle spp. activity corre-lates positively with density estimates within woodland [25]. Bat activity was quantified using a frequency division bat detector (Anabat SD1, Titley Electronics) fixed on a 1 m high pole with the microphone pointing upwards. The bat detector was placed within the centre of one of the four plots (see section‘Vegetation surveys’) and rotated between plots every 30 minutes for four hours in total (the length of the shortest night in the study area). Plot locations were20 m from the woodland edge, and40 m from each other and positioned to avoid paths. All bat recordings were analysed using Analook W [26]. One bat pass was defined as at least two echo-location calls within one second of each other [27,28]. BothP.pipistrellusandP.pygmaeuscan be determined by the characteristic frequency (Fc = the frequency at the right hand end of the flattest portion of a call; [26]) of their search-phase echolocation calls. Bat passes with a Fc of between 49 and 51 kHz were classed as unknownPipistrellusspecies.
Urban matrix survey. Point counts (8 minute duration) were conducted at different loca-tions within and around each woodland patch using a frequency division bat detector (Anabat SD2, Titley Electronics) to compare differences inP.pipistrellusandP.pygmaeusactivity at the woodland interior, edge, surrounding green space, and grey space. Grey space was categorised as land that is sealed, impermeable‘hard’surfaces such as tarmac or concrete (e.g. car parks, urban housing), whilst unsealed, permeable‘soft’surfaces such as soil and grass were classed as non-wooded green space (e.g. parkland, amenity grassland; following [29]). Three point counts were conducted within each habitat (a total of 12 point counts per night). These were conducted si-multaneously to the woodland stand survey and recordings were analysed in the same manner.
Landscape analysis
Data analysis
Statistical analyses were undertaken using R version 2.14 [34] using the lme4 [35] and effects package [36].
Woodland stand survey
We performed a Generalised Linear Mixed-Effects model (GLMMs; [37]) with binomial error distribution and a logit link to quantify the influence of woodland characteristics and landscape metrics onP.pipistrellusandP.pygmaeusactivity. In order to assess the relative effects of these variables onP.pygmaeusin comparison toP.pipistrellus, the model was run with the propor-tion ofP.pygmaeustoP.pipistrelluspasses per plot (n = 124) as the response variable, with
‘site’(woodland) included as a random (grouping) factor (n = 31) to account for pseudoreplica-tion of multiple recordings per site [37,38]. Based upon the scientific literature on the ecology of woodland bats (e.g. [24]) the following predictor variables were included in the model: (i) woodland vegetation characteristics: tree species richness, average tree basal area, woodland clutter and woodland canopy cover (covariates) and woodland type as a fixed factor; (ii) patch configuration: woodland size, woodland shape (covariates), and the interaction between size and shape. Woodland shape is the perimeter divided by the minimum perimeter possible for a maximally compact patch of the same area. This equals 1 when the patch is maximally compact and increases as shape becomes irregular [33]; (iii) landscape metrics (covariates). Temperature and date were also included in all models as covariates. Given the high collinearity found be-tween landscape metrics (i.e. bebe-tween the proportions of different biotope types or the same biotope type at a variety of spatial scales) preliminary analyses were conducted to determine which landscape metrics should be included in the model. We used GLMMs for the proportion ofP.pygmaeustoP.pipistrelluspasses per plot with single landscape parameters (at each spa-tial scale) as a preliminary assessment of which key landscape predictors should be included in the final model (i.e. highest R2value). If several landscape parameters were of equal importance (i.e.<5% difference between the highest R2value) they were all selected, providing they were not strongly correlated.
We present the result of the full model including standardised parameters and confidence intervals for all explanatory variables. Inferences on the effect of each parameter were made by (i) comparing its standardized estimate with other predictor variables to determine relative im-portance, (ii) the upper and lower 95% quantiles of each parameter distribution obtained from N = 2000 simulated draws from the estimated distribution [39], and (iii) a comparison of mod-els excluding each parameter in turn using Likelihood Ratio Tests (LRTs) [40]. LRTs of main effect parameters also involved in interactions were performed by comparing a model exclud-ing the main effect term to a model includexclud-ing all main effects (but not interactions) only. Pre-diction plots were constructed by undertaking simulated draws (n = 2000) from the estimated distribution of one explanatory variable whilst maintaining all other parameters in the model at their median observed values.
Urban matrix survey
Results
Woodland stand survey
We recorded a total of 2,364 bat passes during a total of 124 hours of surveys. Bats were re-corded within all but one of the 31 woodlands surveyed. We rere-corded a total of 1,584P.
pyg-maeuspasses (67% of all bat passes) in 28 of the woodlands, and 642 (27%)P.pipistrellus passes in 23 woodlands. A further 68 pipistrelle passes were recorded however these could not be classified to species level. Additionally, we recorded 69Myotisspp. bat passes within seven woodlands and oneP.nathusiipass. Both of these taxa were found in an insufficient number of sites for robust statistical analysis and were therefore excluded from further analysis.
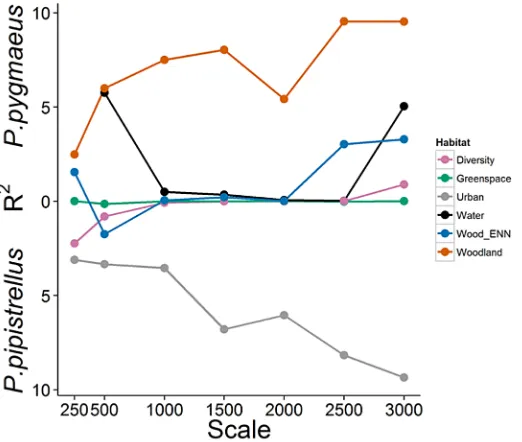
In the results described below it should be noted that significant variables derived from the bat GLMMs indicate a differential response between the species to site or landscape character-istics; variables which are similarly influential for both species will not therefore be statistically significant in these models. Preliminary landscape analysis identified the proportion of grey space in the surrounding 3 km as the key landscape predictor (i.e. highest R2value;Fig 2) which was then incorporated into the final model.
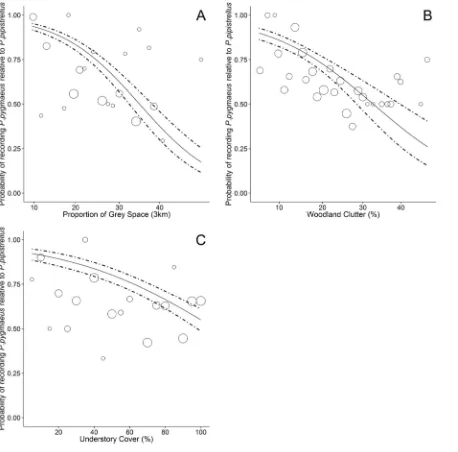
[image:7.612.203.464.399.620.2]The importance of woodland vegetation characteristics and the surrounding landscape dif-fered betweenP.pygmaeusandP.pipistrellus(Table 2). The proportion of grey space in the surrounding 3 km had the largest effect size and a negative influence on the probability of re-cordingP.pygmaeusrelative toP.pipistrellus. Based on the estimated coefficients inTable 2, the predicted probability of recordingP.pygmaeuswas 0.93 (0.91–0.95) in woodlands sur-rounded by only a low proportion (10%) of grey space, whilst there was an equal probability of recording eitherP.pygmaeusorP.pipistrellusin woodlands surrounded by moderate levels of grey space (30%;Fig 3A). In woodlands surrounded by high levels of grey space (45%), the
Fig 2. Differential responses to the urban landscape at a variety of spatial scales by cryptic bat species.R2values obtained from GLMM models with binomial error distribution comparing the percentage of
landscape covered by each biotype type at a variety of spatial scales to the probability of recordingP.
pygmaeusrelative toP.pipistrellusin fragmented urban woodland. The position of the R2values along the y-axis reflect the direction of the parameter estimates; hence R2values in the upper half of the graph refer to a
landscape metric that is associated with an increased probability of detectingP.pygmaeus, whilst R2values
in the lower half of the graph refer to a landscape metric that is associated with an increased probability of detectingP.pipistrellus.
predicted probability of recordingP.pygmaeusrelative toP.pipistrelluswas 0.17 (0.12–0.25). Woodland clutter had the largest effect size of the vegetation characteristics we assessed. There was a high probability of recordingP.pygmaeusin woodlands with low (10%) clutter (0.86; 0.82–0.89), whilst in densely cluttered woodlands (40%) the probability of recordingP.
pyg-maeusrelative to recordingP.pipistrellusfell to 0.37 (0.26–0.50;Fig 3B). Similarly, the proba-bility of recordingP.pygmaeusin woodlands with low understory cover (20%) was 0.89 (0.85– 0.92), whilst in woodlands with continuous understory cover (100%) there was a similar proba-bility of recording eitherP.pygmaeus(0.55; 0.49–0.61) orP.pipistrellus(0.45; 0.39–0.51;Fig 3C). Additionally the probability ofP.pygmaeusdecreased in woodlands with a high average tree basal area, however the effect size was relatively small (Table 2).
Urban matrix survey
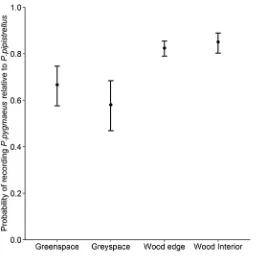
We recorded a total of 260P.pipistrelluspasses and 701P.pygmaeuspasses within the four habitat types. The probability of recordingP.pygmaeusrelative to recordingP.pipistrelluswas significantly associated with habitat type (χ2 = 20.57, df = 3, p<0.001), and was substantially higher in woodland (interior and edge) than the surrounding urban matrix (Fig 4). There was no substantial difference in the probability of recordingP.pygmaeus(relative toP.pipistrellus) between urban green space and non-wooded grey space (Fig 4).
Discussion
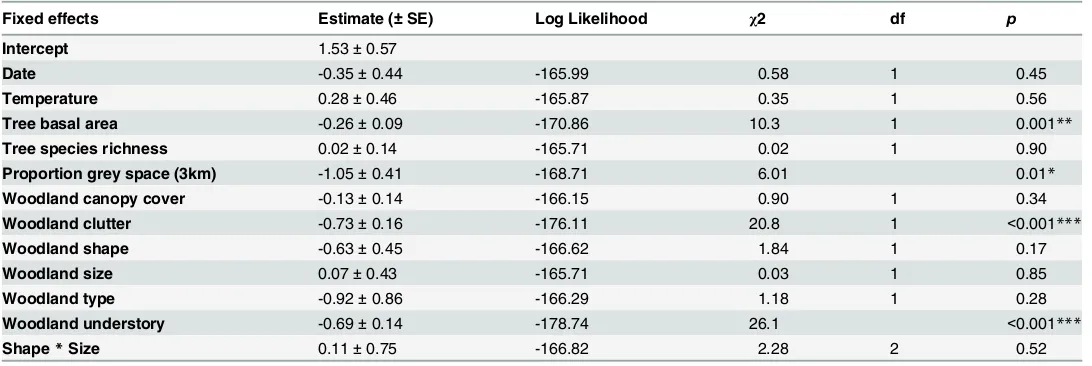
[image:8.612.35.581.97.280.2]Determining the ecological and behavioural mechanisms driving habitat use within the urban matrix is the key to understanding the adaptability of species to urbanisation. In this study we Table 2. Parameter estimates and likelihood ratio tests of the GLMM for the relative proportion ofP.pygmaeuspasses toP.pipistrelluspasses in urban woodland.
Fixed effects Estimate (±SE) Log Likelihood χ2 df p
Intercept 1.53±0.57
Date -0.35±0.44 -165.99 0.58 1 0.45
Temperature 0.28±0.46 -165.87 0.35 1 0.56
Tree basal area -0.26±0.09 -170.86 10.3 1 0.001**
Tree species richness 0.02±0.14 -165.71 0.02 1 0.90
Proportion grey space (3km) -1.05±0.41 -168.71 6.01 0.01*
Woodland canopy cover -0.13±0.14 -166.15 0.90 1 0.34
Woodland clutter -0.73±0.16 -176.11 20.8 1 <0.001***
Woodland shape -0.63±0.45 -166.62 1.84 1 0.17
Woodland size 0.07±0.43 -165.71 0.03 1 0.85
Woodland type -0.92±0.86 -166.29 1.18 1 0.28
Woodland understory -0.69±0.14 -178.74 26.1 <0.001***
Shape*Size 0.11±0.75 -166.82 2.28 2 0.52
The model was run to calculate the probability of recording aP.pygmaeuspass relative toP.pipistrellus; hence positive estimates indicate an increased probability of detectingP.pygmaeusand negative estimates indicate an increased probability of detectingP.pipistrelluswith a given explanatory variable. Test statistics were derived from the deletion of each term from the full model (for the 2-way interaction) and from the model with main effects only (main effect terms).
Significance codes: ‘***’p<0.001, ‘**’p<0.01, ‘*’p0.05.
show that even two morphologically similar species can have widely differing responses to frag-mented urban woodland and the surrounding urban matrix.
The response of
P
.
pipistrellus
and
P
.
pygmaeus
to urban woodland
vegetation character and patch configuration
[image:9.612.39.497.77.529.2]Although habitat partitioning betweenP.pipistrellusandP.pygmaeusis known from radio tracking studies (e.g. [41]), these studies have involved relatively small sample sizes and were conducted in non-urban habitats. Whilst previous studies have indicated that habitat partition-ing between the two species occurs between habitat types (e.g. [42]), here we show that similar behaviour occurs within habitat types, at a fine spatial scale.
Fig 3. Differential responses to urban woodland and the surrounding landscape by cryptic bat species.Estimated probability of recordingP.
pygmaeusrelative toP.pipistrellusin fragmented urban woodland. Dashed lines indicate 95% confidence intervals. Original data on the proportion ofP.
Our results indicate thatP.pygmaeusappear to be using woodlands with low clutter and un-derstory growth relatively more intensely thanP.pipistrellus, despite both species having similar wing shapes and echolocation calls which make them well adapted to foraging along woodland edges and relatively open habitats [43]. These findings support Davidson-Watts & Jones [42] who found thatP.pygmaeusspend less time flying, make fewer foraging bouts but travel greater distances, suggesting that this species has more selective foraging habitats. Conversely,P.
pipis-trellusis commonly regarded as a generalist forager [42,44], and therefore would be expected to be found in a wider range of habitat types. Although it is surprising thatP.pipistrellusare not also using less cluttered habitats, Nicholls and Racey [41] suggested thatP.pipistrellusactively avoidP.pygmaeusforaging sites (but see [45]). Coexisting species must differ in at least one niche dimension to avoid excessive competition such as using different foraging locations [46]. It is therefore possible that the use of woodlands with high clutter and understory byP.pipistrellus may reflect the wider, non-selective, use of woodland habitats within the urban matrix to avoid competition. In contrast,P.pygmaeusmay be preferentially selecting those woodlands which offer optimal foraging locations.Pipistrellusspecies are known to also forage above the canopy of closed mature woodland stands [47] which although not recorded in this study, may provide ad-ditional or alternative foraging resources for either or bothPipistrellusspecies. Differences in habitat use may also reflect that the diets of the two species differ [48]. Assessing which woodland characteristics determine prey availability may also help explain differential habitat use.
The response of
P
.
pipistrellus
and
P
.
pygmaeus
to the composition,
[image:10.612.201.463.75.331.2]spatial configuration, and heterogeneity of the surrounding landscape
Regardless of the spatial scale surrounding the woodland (250 m to 3 km) we found that the probability of recordingP.pygmaeusrelative toP.pipistrelluswas greater when the landscape Fig 4. Differential habitat use in the urban matrix by cryptic bat species.Boxplot showing the estimated probability of recordingP.pygmaeusrelative to recordingP.pipistrellusin the urban matrix. The upper and lower whiskers show 95% confidence limits. Fitted values by GLMMs are used.contained a high proportion of woodland and a low proportion of urban grey space. This sup-ports previous studies identifyingP.pipistrellusas a generalist species [32,49] which can toler-ate modertoler-ate levels of urbanisation [19]. Similarly, the proportion of grey space in the
surrounding 3 km was the strongest predictor of which of the two species would be recorded. The underlying cause as to whyP.pipistrellusis better able to adapt to the urban landscape is unknown although the lower frequency of its echolocation call may aid adaptability to cities as species with lower calls are better able to use open habitats and access a wider spectrum of hab-itats [50]. Alternatively,P.pipistrellusmay have the greater behavioural capacity to adapt to ex-ploit the urban landscape, for example using buildings and planted tree lines as paths for courtship flights and territory boundaries [51]. It is surprising given the strong association be-tweenP.pygmaeushabitat preferences and waterbodies [44] that the composition of water in the landscape was not a significant predictor of differences in habitat use between the two spe-cies. However, urban waterways are frequently used by both species (Lintott et al. unpublished data) and it is likely that the continuous nature of urban waterways is facilitating the movement of both species through the urban matrix. Additionally, in contrast to alternative biotope types (e.g. green space or grey space) there was relatively little variability between sites in the compo-sition of freshwater in the surrounding landscape (S1 Table), which may have masked any dif-fering habitat use as consequence of freshwater.
Differences between
P
.
pipistrellus
and
P
.
pygmaeus
in habitat selection
within the urban matrix
The higher adaptability to the built landscape byP.pipistrellusrelative toP.pygmaeusis further supported by the extent to which this species was recorded in a variety of habitat types con-tained within the urban matrix. In contrast,P.pygmaeus, relative toP.pipistrellus, predomi-nantly used woodland edge and interior habitats; foraging locations that both species are well adapted for. This strengthens Nicholls and Racey’s [41] findings thatP.pipistrellusappear to actively avoidP.pygmaeusforaging sites resulting in differential habitat use. Within the urban matrix, this may transpire asP.pipistrellusappearing to using a wider range of habitats, thereby giving the impression that it is a generalist. SimilarlyP.pipistrellusmay be commuting further to use those woodlands which offer suitable foraging resources but are surrounded by sufficient grey space to deterP.pygmaeus.
Conservation implications
Understanding how species respond to urbanisation is critical in identifying priority species which may require conservation effort. Categorising species as either‘urban avoiders’,‘urban utilizers’or‘urban dwellers’appears a convenient way of achieving this [5]. Bats are often cate-gorised in this manner based upon their morphological traits (e.g. [50,52]), however our re-sults show that habitat use differs between species which are morphologically very similar [53,
54] suggesting that such differences may be a weak indication of ecological differences between taxa [41,55]. Similarly, using species presence as an indication of adaptability to the built land-scape should be treated cautiously prior to assessing if adaptability to urbanisation is sex de-pendent [56], or if species in urban landscapes largely consist of sink populations. IfP.
pipistrellusare using the urban ecosystem as a means of avoiding competition withP.pygmaeus it may be that they are not so much exploiting the urban landscape but using it out of necessity.
Conclusions
morphological traits as a means of categorising species into the likelihood of them adapting to urban locations are problematic, as even two sympatric and cryptic species can respond differ-ently.P.pygmaeusappear to be using less cluttered woodlands whilstP.pipistrellusappear to be adapting a generalist foraging behaviour using, often cluttered, woodlands surrounded by relatively high levels of urban grey space; this may be a result of differential habitat use to avoid competition.
Supporting Information
S1 Table. The composition of the landscape surrounding the 31 urban woodlands surveyed throughout central Scotland in 2011.
(DOCX)
Acknowledgments
This project was funded by the University of Stirling and British Ecological Society. We would like to thank Catherine Gibson-Poole, Lorna Blackmore and the numerous volunteers who helped with the data collection. We also thank the two anonymous reviewers for their valuable comments on the manuscript.
Author Contributions
Conceived and designed the experiments: PRL KJP EFM. Performed the experiments: PRL RJM LO. Analyzed the data: PRL NB JM. Wrote the paper: PRL KJP NB JM EFM.
References
1. Zipperer WC, Pickett STA. Urban Ecology: patterns of population growth and ecological effects. John Wiley & Sons Ltd; 2012.
2. McKinney ML. Effects of urbanization on species richness: a review of plants and animals. Urban Eco-syst. 2008; 11: 161–176.
3. Grimm NB, Faeth SH, Golubiewski NE, Redman CL, Wu J, Bai X, et al. Global change and the ecology of cities. Science. 2008; 319: 756–760. doi:10.1126/science.1150195PMID:18258902
4. Magle SB, Hunt VM, Vernon M, Crooks KR. Urban wildlife research: past, present, and future. Biol Cons. 2012; 155: 23–32.
5. Fischer JD, Schneider SC, Ahlers AA, Miller JR. Categorizing wildlife responses to urbanization and conservation implications of terminology. Conserv. Biol. 2015; doi:10.1111/cobi.12451
6. Mathews F, Roche N, Aughney T, Jones N, Day J, Baker J, et al. Barriers and benefits: implications of artificial night-lighting for the distribution of common bats in Britain and Ireland. Proc. R. Soc. B. 2015; 370: 20140124.
7. Gaisler J, Zukal J, Rehak Z, Homolka M. Habitat preference and flight activity of bats in a city. J. Zool. 1998; 244: 439–445.
8. Lane DJ, Kingston T, Lee BPH. Dramatic decline in bat species richness in Singapore, with implications for Southeast Asia. Biol Cons. 2006; 131: 584–593.
9. Gehrt SD, Chelsvig JE. Bat activity in an urban landscape: patterns at the landscape and microhabitat scale. Ecol Appl. 2003; 13: 939–950.
10. Russo D, Ancillotto L. Sensitivity of bats to urbanization: A review. Z Saugetierkd. 2014;“In press”. 11. Johnson JB, Gates JE, Ford WM. Distribution and activity of bats at local and landscape scales within a
rural—urban gradient. Urban Ecosyst. 2008; 11: 227–242.
12. Lacki MJ, Hayes JP, Kurta A. (Eds.) Bats in Forests: Conservation and Management. The Johns Hop-kins University Press, Baltimore; 2007.
13. Alvey AA. Promoting and preserving biodiversity in the urban forest. Urban For. Urban Greening. 2006; 5: 195–201.
15. Cornelis J, Hermy M. Biodiversity relationships in urban and suburban parks in Flanders. Landsc. Urban Plan. 2004; 69: 385–401.
16. Croci S, Butet A, Georges A, Aguejdad R, Clergeau P. Small urban woodlands as biodiversity conser-vation hot-spot: a multi-taxon approach. Landscape Ecol. 2008; 23: 1171–1186.
17. Jones G, Van Parijs SM. Bimodal echolocation in pipistrelle bats: are cryptic species present? Proc. R. Soc. B. 1993; 251: 119–125. PMID:8096079
18. Barlow KE, Jones G. Roosts, echolocation calls and wing morphology of two phonic types of
Pipistrel-lus pipistrelPipistrel-lus. Z Saugetierkd. 1999; 64: 257–268.
19. Hale JD, Fairbrass AJ, Matthews TJ, Sadler JP. Habitat composition and connectivity predicts bat pres-ence and activity at foraging sites in a large UK conurbation. PloS one. 2012; 7: e33300. doi:10.1371/ journal.pone.0033300PMID:22428015
20. Safi K, Kerth G. A comparative analysis of specialization and extinction risk in temperate—zone bats. Conserv. Biol. 2004; 18: 1293–1303.
21. EDINA Digimap Ordnance Survey Service, OS MasterMap Topography Layer. 2014. Available:http:// edina.ac.uk/digimap.
22. Smith DA, Gehrt SD. Bat response to woodland restoration within urban forest fragments. Restoration Ecol. 2010; 18: 914–923.
23. Roche N, Langton S, Aughney T, Russ JM, Marnell F, Lynn D, et al. A car-based monitoring method re-veals new information on bat populations and distributions in Ireland. Anim. Conserv. 2011; 14: 642– 651.
24. Fuentes-Montemayor E, Goulson D, Cavin L, Wallace JM, Park K. Fragmented woodlands in agricultur-al landscapes: The influence of woodland character and landscape context on bats and their insect prey, Agric. Ecosyst. Environ. 2013; 172: 6–15.
25. Lintott PR, Fuentes-Montemayor E, Goulson D, Park KJ. Testing the effectiveness of surveying tech-niques in determining bat community composition within woodland. Wildlife Res. 2014; 40: 675–684 26. Corben C. AnalookW for bat call analysis using ZCA version 3.3f. 2006. Available:http://www.hoarybat.
com.
27. Fenton MB. A technique for monitoring bat activity with results obtained from different environments in southern Ontario. Can J Zool. 1970; 48: 847–851.
28. Walsh AL, Harris S. Foraging habitat preferences of vespertilionid bats in Britain. J Appl Ecol. 1996; 33: 508–518.
29. James P, Tzoulas K, Adams MD, Barber A, Box J, Breuste J, et al. Towards an integrated understand-ing of green space in the European built environment. Urban For. Urban Greenunderstand-ing. 2009; 8: 65–75. 30. ESRI Inc. ArcGIS 10. 2014. Available:http://www.esri.com.
31. Fuentes-Montemayor E, Goulson D, Park KJ. Pipistrelle bats and their prey do not benefit from four widely applied agri-environment management prescriptions. Biol Cons. 2011; 144: 2233–2246. 32. Nicholls B, Racey PA. Contrasting home-range size and spatial partitioning in cryptic and sympatric
pip-istrelle bats. Behav. Ecol. Sociobiol. 2006; 61: 131–142.
33. McGarigal K, Cushman SA, Neel MC, Ene E. FRAGSTATS: Spatial PatternAnalysis Program for Cate-gorical Maps. University of Massachusetts, Amherst; 2002.
34. R Core Team. R: A Language and Environment for Statistical Computing. R Foundation for Statistical Computing, Vienna, Austria. 2012. ISBN 3-900051-07-0. doi:10.1002/jcc.22917PMID:22278855
35. Bates D, Maechler M, Bolker B. lme4: Linear mixed-effects models using S4 classes. R package ver-sion 0.999999–2; 2013.
36. Fox J. Effect displays in R for generalised linear models. J Stat Softw. 2003; 8: 1–27.
37. Zuur A, Ieno EN, Walker N, Saveliev AA, Smith GM. Mixed effects models and extensions in ecology with R. Springer Science & Business Media; 2009.
38. Pinheiro JC, Bates DM. Mixed effects models in S and S-PLUS. Springer Science & Business Media; 2000.
39. Gelman A, Hill J. Data analysis using regression and multilevel/hierarchical models. Cambridge: Cam-bridge University Press; 2007.
40. Faraway JJ. Extending the linear model with R: generalized linear, mixed effects and nonparametric re-gression models. New York: CRC press; 2005.
42. Davidson-Watts I, Jones G. Differences in foraging behaviour betweenPipistrellus pipistrellus (Schre-ber, 1774) andPipistrellus pygmaeus(Leach, 1825). J. Zool. 2006; 268: 55–62.
43. Kalko EK, Schnitzler HU. Plasticity in echolocation signals of European pipistrelle bats in search flight: implications for habitat use and prey detection. Behav. Ecol. Sociobiol. 1993; 33: 415–428.
44. Russ JM, Montgomery WI. Habitat associations of bats in Northern Ireland: implications for conserva-tion. Biol Cons. 2002; 108: 48–58.
45. Barlow KE, Jones G. Function of pipistrelle social calls: field data and a playback experiment. Anim. Behav. 1997; 53: 991–999.
46. Li Y, Wang J, Metzner W, Luo B, Jiang T, Yang S, et al. Behavioral responses to echolocation calls from sympatric heterospecific bats: implications for interspecific competition. Behav. Ecol. Sociobiol. 2014; 68: 657–667.
47. Müller J, Brandl R, Buchner J, Pretzsch H, Seifert S, Strätz C, et al. From ground to above canopy—Bat activity in mature forests is driven by vegetation density and height. For. Ecol. Manage. 2013; 306: 179–184.
48. Barlow KE. The diets of two phonic types of the bat Pipistrellus pipistrellus in Britain. J. Zool. 1997; 243: 597–609.
49. Vaughan N, Jones G, Harris S. Habitat use by bats (Chiroptera) assessed by means of a broad-band acoustic method. J Appl Ecol. 1997; 34: 716–730.
50. Threlfall CG, Law B, Banks PB. Sensitivity of insectivorous bats to urbanization: implications for subur-ban conservation planning. Biol Cons. 2012; 146: 41–52.
51. Sachteleben J, von Helversen O. Songflight behaviour and mating system of the pipistrelle bat (Pipis-trellus pipis(Pipis-trellus) in an urban habitat. Acta Chiropterologica. 2006; 8: 391–401.
52. Jung K, Kalko EK. Adaptability and vulnerability of high flying Neotropical aerial insectivorous bats to ur-banization. Divers. Distrib. 2011; 17: 262–274.
53. Barlow KE, Jones G, Barratt EM. Can skull morphology be used to predict ecological relationships be-tween bat species? A test using two cryptic species of pipistrelle. Proc. R. Soc. B. 1997; 264: 1695– 1700. PMID:9404031
54. Häussler U, Nagel A, Braun M, Arnold A. External characters discriminating sibling species of Europe-an pipistrelles,Pipistrellus pipistrellus(Schreber, 1774) andP.pygmaeus(Leach, 1825). Myotis. 1999; 37: 27–40.
55. Davidson-Watts I, Walls S, Jones G. Differential habitat selection byPipistrellus pipistrellusand
Pipis-trellus pygmaeusidentifies distinct conservation needs for cryptic species of echolocating bats. Biol Cons. 2006; 133: 118–127.