A Bioluminescent Microbial Biosensor for In Vitro
Pretreatment Assessment of Cytarabine Efficacy
in Leukemia
Habib M. Alloush,1,2Elizabeth Anderson1, Ashley D. Martin,3Mark W. Ruddock,3Johanna E. Angell,1
Phil J. Hill,4Priyanka Mehta,5M. Ann Smith,6J. Graham Smith,7and Vyv C. Salisbury1*
BACKGROUND: The nucleoside analog cytarabine (Ara-C [cytosine arabinoside]) is the key agent for treating acute myeloid leukemia (AML); however, up to 30% of patients fail to respond to treatment. Screen-ing of patient blood samples to determine drug re-sponse before commencement of treatment is needed. This project aimed to construct and evaluate a self-bioluminescent reporter strain of Escherichia colifor use as an Ara-C biosensor and to design an in vitro assay to predict Ara-C response in clinical samples.
METHODS: We used transposition mutagenesis to create a cytidine deaminase (cdd)-deficient mutant ofE. coli MG1655 that responded to Ara-C. The strain was transformed with theluxCDABEoperon and used as a whole-cell biosensor for development an 8-h assay to determine Ara-C uptake and phosphorylation by leu-kemic cells.
RESULTS: Intracellular concentrations of 0.025mol/L phosphorylated Ara-C were detected by significantly increased light output (P ⬍ 0.05) from the bacterial biosensor. Results using AML cell lines with known response to Ara-C showed close correlation between the 8-h assay and a 3-day cytotoxicity test for Ara-C cell killing. In retrospective tests with 24 clinical samples of bone marrow or peripheral blood, the biosensor-based assay predicted leukemic cell response to Ara-C within 8 h.
CONCLUSIONS: The biosensor-based assay may offer a predictor for evaluating the sensitivity of leukemic cells to Ara-C before patients undergo chemotherapy and allow customized treatment of drug-sensitive patients with reduced Ara-C dose levels. The 8-h assay monitors
intracellular Ara-CTP (cytosine arabinoside triphos-phate) levels and, if fully validated, may be suitable for use in clinical settings.
© 2010 American Association for Clinical Chemistry
Although cytotoxic chemotherapy is widely used for treatment of many forms of cancer, failure to respond to anticancer drugs and resistance to treatment are ma-jor obstacles to satisfactory clinical outcome. Over 30% of acute myeloid leukemia (AML)8patients fail to re-spond to the nucleoside analog cytarabine (Ara-C [cy-tosine arabinoside]), the main drug used for AML treatment, and a substantial proportion fail to achieve long-term remission, whereas others respond to re-duced levels of the drug(1 ). Currently, patients un-dergo no prescreening for any of the courses of cyto-toxic therapy to determine potential response(1 ). For nonresponding patients, this lack of screening can re-sult in a delay in commencement of effective treatment and unnecessary exposure to cytotoxic drugs with as-sociated morbidity and mortality due to side effects and potential drug-induced secondary malignancies (2 ). There is a need for rapid screening of patient sam-ples to determine level of drug response before com-mencement of treatment that not only will give in-creased patient benefits, but also reduce healthcare costs(1 ). It is anticipated that such a test could be anal-ogous to the existing antibiotic sensitivity tests rou-tinely used in clinical settings before antibiotic treat-ment for infection.
The nucleoside analog Ara-C is one of the most active single anticancer agents and is the main drug of chemotherapy for AML(3, 4 ). In vivo, Ara-C is
trans-1Faculty of Health and Life Sciences, University of the West of England, Bristol,
UK;2Faculty of Sciences, Division of Natural Sciences, Haigazian University,
Beirut, Lebanon;3Randox Laboratories, Antrim, UK;4Division of Food Sciences,
Nottingham University, Nottingham, UK;5Bristol Haematology and Oncology
Centre, University Hospitals Bristol NHS Foundation Trust, Bristol, UK;6Stem
Cell Transplant Laboratory, Royal Marsden NHS Foundation Trust, Sutton, Surrey, UK;7Department of Haematology, Frimley Park Hospital NHS
Founda-tion Trust, Camberley, Surrey, UK.
* Address correspondence to this author at: Faculty of Health and Life Sciences,
University of the West of England, Bristol BS16 1QY, UK. Fax⫹ 44-117-328-2904; e-mail vyv.salisbury@uwe.ac.uk.
Received March 12, 2010; accepted September 3, 2010. Previously published online at DOI: 10.1373/clinchem.2010.145581
8Nonstandard abbreviations: AML, acute myeloid leukemia; Ara-C, cytarabine
(cytosine arabinoside); dCK, deoxycytidine kinase; Ara-CMP, cytosine arabino-side monophosphate; Ara-CTP, cytosine arabinoarabino-side triphosphate; FMNH2,
ported into the cell via the human equilibrium nucleoside transporter (hENT1) and is rapidly phos-phorylated by deoxycytidine kinase (dCK) to its mono-phosphate form, cytosine arabinoside monomono-phosphate (Ara-CMP), which is further phosphorylated by nucle-oside kinases and finally to the triphosphorylated and active form, cytosine arabinoside triphosphate (Ara-CTP). Drug inactivation can result from Ara-CMP conversion into Ara-uracil by cytidine deaminase (cdd), or from dephosphorylation of Ara-CMP by cy-toplasmic nucleotidase(3 ). The antiproliferative and cytotoxic effects of Ara-CTP are largely due to its ability to interfere with DNA polymerase and its incorpora-tion into DNA strands leading to chain terminaincorpora-tion and DNA synthesis arrest(4 ).
Chemoresistance to Ara-C can arise from a number of factors influencing the rate of Ara-CTP formation and incorporation into DNA(5 ), including low drug uptake, conversion into Ara-uracil by cytidine deaminase, or de-phosphorylation of active metabolite by cytoplasmic nu-cleotidase(6 ). Intracellular concentrations of Ara-CTP are reported to correlate with response to Ara-C therapy (4 ). In vitro assessment of Ara-C efficacy has previously involved measurement of cell death, assessed by colony forming units– blast clonogenic assays(7 ). This method-ology involves primary cell culture overⱖ3 days(7 )and is not suitable for routine screening. In clinical practice, patients are treated with regimens including Ara-C re-gardless of their possible nonresponse to the drug and, as a result, suffer from debilitating side effects(2, 8 ). Patients are given induction therapy over a period of weeks, before sensitivity or resistance is determined by leukemic cell count(4 ).
Recombinant cell-based bioluminescence tech-nology is an approach that has received increasing attention for biomedical applications (9 ) and has previously been used for determination of androgen bioactivity in clinical samples (10 ). This technology has the potential to detect anticancer drug activity in malignant cells from clinical samples, within a period of hours. Light emission from bioluminescent bacteria is due to the activity of bacterial luciferase, which cata-lyzes the oxidation of reduced flavin mononucleotide (FMNH2) and a long-chain aliphatic aldehyde in the presence of O2 to produce FMN and acid with the emission of blue-green light. The genes coding for the luciferase [alkanal monooxygenase subunit alpha (luxA)9 and alkanal monooxygenase subunit beta
(luxB)] are linked to those coding for the fatty acid reductase complex [fatty acid reductase (luxC); acyl transferase (luxD); and acyl-protein synthetase (long-chain-fatty-acid-luciferin-component ligase) (luxE)], which catalyzes the production of luciferin from the fatty acid pool(11 ). Because the production of FMNH2 directly depends on a functional electron transport sys-tem, only metabolically active cells emit light. Hence, any alteration of cellular metabolism is reflected by a change in light emission. Bioluminescent bacterial bio-sensors have been used to assess the effect of various chemical, biological, and physical signals, providing an accurate, nondestructive, and real-time assay technol-ogy(9 ). Bioluminescence phenotype can be conferred upon most bacteria by introducing and expressing the luxCDABEoperon, isolated fromPhotorhabdus lumi-nescens, under the control of constitutive promoters. These whole-cell bacterial biosensors do not require exogenous substrate and give out light as a direct indi-cator of the physiological status of the bacteria in real time (12 ). The high metabolic rate of bacterial cells, compared with mammalian cells, means that these re-porters are ideal for fast, accurate, real-time in situ tox-icity testing. Light output from these biosensors can be accurately measured, with no background interfer-ence, by using either luminometers or low-light cam-eras.Luxgene– based reporter technology in bacterial biosensors has been successfully used to monitor phar-macodynamics of antimicrobial agents in real time (13, 14 ).
Ara-C has no effect onEscherichia coli, since the bacteria lack dCK that phosphorylates Ara-C into its active form and they actively deaminate Ara-C into Ara-uracil through the activity of cytidine/deoxycyti-dine deaminase (cdd). Wang et al.(15 )constructed a cdd-deficientE. colistrain (SØ5218) that, upon the ex-pression of the human deoxycytidine kinase (DCK) gene, exhibited reduced relative growth in the presence of Ara-C in minimal growth medium. Therefore, this indicates that expression of human dCK in SØ5218 leads to the incorporation of Ara-CTP into bacterial DNA. However, the growth inhibitory effect of Ara-C was completely abolished when assayed in rich growth medium due to incorporation of cytosine triphosphate instead of the toxic analog Ara-CTP into bacterial DNA (15 ).
The main aim of this study was the construction of a pyrimidine-requiring, cdd-deficient mutant of E. coli MG1655 strain with enhanced sensitivity toward Ara-C in rich medium and its use as a bioluminescent biosensor in an 8-h assay to determine Ara-C uptake as well as its phos-phorylation by human leukemic cells. The assay provides information on the phenotype of leukemic cells in clinical samples of peripheral blood or bone marrow.
9Genes:luxA, alkanal monooxygenase subunit alpha; luxB, alkanal
monooxy-genase subunit beta;luxC, fatty acid reductase; luxD, acyl transferase; luxE, acyl-protein synthetase (long-chain-fatty-acid-luciferin-component ligase);cdd, cytidine/deoxycytidine deaminase; pyrE, orotate phosphoribosyltransferase; DCK, deoxycytidine kinase.
E. coliSØ5218 (a gift from S. Eriksson, University of Copenhagen) is a cdd-deficient strain expressing the human DCK cDNA on the isopropyl -D
-1-thiogalactopyranoside (IPTG)-inducible pTrc99-A plasmid(14 ).E. coliMG1655 (a gift from K.J. Jensen, University of Copenhagen, Denmark) is a derivative of the wild-typeE. coliK-12 that requires pyrimidine in minimal growth medium, due to suboptimal expres-sion of the enzyme orotate phospho-ribosyltransferase coded for by the orotate phosphoribosyltransferase (pyrE) gene (16 ). Both strains were made self-bioluminescent by transformation, using standard methods previously described(9 ), with the broad-host vector pBBR1MCS-2(17 )carrying theluxCDABE cas-sette from Photorhabdus luminescensas an EcoRI PCR fragment. All chemicals and growth media were sup-plied by Sigma-Aldrich (www.sigmaaldrich. com) un-less otherwise stated. Luria-Bertani growth medium was used for routine culturing of bacteria. The antibi-otics tetracycline, ampicillin, and kanamycin were added at a final concentration of 10, 100, and 10 mg/L, respectively. Growth inhibition experiments were per-formed in Luria-Bertani growth medium, RPMI 1640 (Invitrogen, www.invitrogen.com), or AB minimal medium(16 )plus 2.0 g/L glucose and 2.0 g/L vitamin-free casamino acids and supplemented with thiamine and leucine at final concentrations of 1 and 20 mg/L, respectively.
CELL LINES, BONE MARROW, AND BLOOD SAMPLES
The monocytic AML cell lines KG-1a and THP-1 (DSMZ, www.dsmz.de) were grown and maintained as a cell suspension in RPMI 1640 medium supplemented with 2 mmol/L glutamine (Invitrogen) and 10% fetal calf serum (Biosera, www.biosera.com) at 37 °C and 5% CO2. Cultures were maintained at a density of 1– 4⫻106cells/mL and were monitored by vital stain-ing usstain-ing trypan blue. Cryopreserved bone marrow samples, previously separated by density gradient cen-trifugation to yield the mononuclear cell fraction, were thawed and resuspended in RPMI 1640 medium before incubation with Ara-C. Mononuclear cells from fresh AML peripheral blood samples (collected from pa-tients at Frimley Park Hospital, Surrey, UK, and Bristol Haematology and Oncology Centre, Bristol, UK, after obtaining informed consent) were also isolated by den-sity gradient centrifugation and resuspended in RPMI 1640 medium. In all cases, samples were obtained from patients at diagnosis, before the start of treatment, and with blood blast burdens ⬎80% and were analyzed blind to avoid bias. Subsequent clinical outcome after induction chemotherapy with Ara-C– containing
200 mg䡠m 䡠day (based on an 80-kg individual (see Table 1 in the Data Supplement that accompanies the online version of this article at http://www.clinche-m.org/content/vol56/issue12)(18 ).
CONSTRUCTION OF Acdd-DEFICIENT MUTANT OFE. coliMG1655
A library ofE. coliMG1655 mutants was constructed by using random transposition mutagenesis with P1 phage carrying Tn10 transposon, which can transpose from the phage into theE. colichromosome, according to Miller(19 )with slight modification. Briefly,E. coli MG1655 mutants were grown in Luria-Bertani broth until the midexponential phase and were infected with P1 phage at a multiplicity of infection of approximately 5. The infected cells were plated on Luria-Bertani agar plates containing tetracycline to select for mutants car-rying the transposon. Thecddmutants were selected by growth after 24-h incubation at 37 °C on plates contain-ing 10 mg/L of the analog 5-fluoro-2⬘deoxycytidine, which is toxic toE. coli–containingcddactivity. The phe-notype of thecddmutant (E. coliHA1) was confirmed by the absence of cytidine deaminase activity.
WESTERN BLOT ANALYSIS FORDCKEXPRESSION
detection system (Roche, www.roche.com) and stan-dard x-ray film (Kodak, www.kodak.co.uk).
BIOSENSOR DOSE RESPONSE ANALYSIS
An overnight culture ofE. coliHA1 was diluted to an ab-sorbance (A) at 600 nm (600A) of 0.1 in RPMI 1640
medium and incubated for 30 min at 37 °C with shaking at 220 rpm. Samples of 200L with either Ara-C or flu-darabine (F-ara-A) concentrations of 0 –100mol/L and 1 mmol/L IPTG were loaded into a black-walled microti-ter plate (Invitrogen). Bioluminescence and growth (600 A) were monitored every 15 min for 15 h in a multimode microplate reader (Tecan, www. tecan.com).
CELL LYSIS ASSAY
[image:4.585.73.305.78.540.2]Cell lines were harvested by centrifuging at 300gfor 5 min at room temperature and resuspended in
Fig. 1. Biosensor response.
The effect of Ara-C concentrations (0.1, 1, 25, and 100
[image:4.585.300.517.79.446.2]mol/L) on luminescence (A) and growth (B) ofE. coli HA1 in the presence of IPTG; the effect of IPTG induction of dCK in the presence of Ara-C (C) is also shown. Growth was moni-tored by measuring 600A; luminescence is shown as relative light units (RLU); n⫽10 and error bars represent SD.
Fig. 2. The effect of Ara-CTP on the biosensor.
Peak light emission, measured as relative light units (RLU), fromE. coli HA1 in RPMI at 37 °C treated with Ara-CTP at 12.5, 25, 50, 75, and 100 nmol/L (A) and 0, 25, 50, and 100
mol/L (B) in the absence and presence of AP (mean of n⫽3 and error bars show range). (C), correlation between Ara-CTP and light emission ⫹/⫺ AP (significance with 1-way ANOVA and Bonferroni adjusted post hoc tests, shown in Table 3 in the online Data Supplement; ***P⬍ 0.001). NS, not significant.
RPMI 1640 with no additives at a concentration of 2 ⫻ 106cells/mL. Cell lines, peripheral blood, and bone marrow blasts were treated with 25 mol/L Ara-C for 30 min at 37 °C and 5% CO2. After expo-sure to Ara-C, cultures were centrifuged as previ-ously described and the supernatant was removed. Harvested cells were washed and resuspended in fresh RPMI 1640 medium. EDTA and saponin were added to cell suspensions at final concentrations of 1.5 mmol/L and 1.0 g/L, respectively. Samples were vortex-mixed for 30 s, and cell debris was removed by centrifugation at 2800gfor 5 min at room temperature. Lysate samples were each mixed with an overnight culture of the reporter bacteria, freshly diluted to a 600Aof 0.1 in a black microtiter plate (Invitrogen).
A total of 1 mmol/L IPTG and 10 U alkaline phos-phatase (AP) was added to the relevant samples. Biolumi-nescence and growth (600A) were monitored in a Tecan multimode microplate reader. Ara-C toxicity was also as-sayed with a 3-day cytotoxicity assay using the Cell
Titer-Glo® Luminescent Cell Viability Assay kit (Promega, www.promega. com). Cells were treated as above with 25 mol/L Ara-C for 72 h at 37 °C and 5% CO2, to allow cells to enter the S phase and hence be sensitized to Ara-CTP, before measuring intracellular levels of ATP according to the manufacturer’s instructions (Promega G7570 Cell Titer-Glo Luminescent Cell Viability Assay).
STATISTICAL ANALYSIS
Statistical significance was determined by using one-way ANOVA with Bonferroni corrected post hoc tests (GraphPad Prism 4). Number of repeat treatments was 3 or more throughout; standard deviation was calcu-lated for n⫽10 repeats, and mean and range is shown for n⫽3 repeats.
Results
E. coliSØ5218, thecdd-deficient strain constructed by Wang et al.(15 ), expressing the humandCKgene,
[image:5.585.69.519.83.412.2]hibited reduced relative growth in the presence of Ara-C in minimal medium but not in a rich growth medium, due to incorporation of cytosine triphos-phate instead of the toxic analog Ara-CTP into bacte-rial DNA.
To measure Ara-C response in a nutrient-rich intracellular environment, an alternativecdd-deficient mutant of a bioluminescent E. coli MG1655 strain, requiring exogenous pyrimidine due to subopti-mal expression of the enzyme orotate phospho-ribosyltransferase coded for by thepyrEgene(16 ), was constructed by using transposon mutagenesis. This mutant was further transformed with pTrcHUMdCK (15 )to give IPTG-inducible expression of dCK. The newly constructed bacterial biosensor, E. coli HA1, showed reduced growth in the presence of Ara-C, even when assayed in nutrient-rich medium (Fig. 1B). Ara-C caused significantly (P⬍0.001; see Table 2 in the online Data Supplement) increased light output from the biosensor (Fig. 1A) with concentrations as low as 0.1 mol/L. This significantly increased light output was only observed during treatment with the pyrimidine analog Ara-C and only in the presence of
IPTG-activated dCK (Fig. 1C). The specificity of the biosensor to Ara-C was indicated by a lack of biosensor response in a control assay with the purine analog flu-darabine (Fig. 1 in the online Data Supplement shows that IPTG activation of dCK had no effect on E. coli HA1 treated with fludarabine).
[image:6.585.69.520.80.336.2]To increase the specificity of the assay, direct ef-fects of the active intracellular drug derivative, Ara-CTP, on the bacterial biosensor were monitored (Fig. 2). The results indicate that Ara-CTP does not enter the reporter bacteria, showing no increase in light output compared with the untreated control, unless AP is added at the start of the assay. The increase in peak light output in the AP-treated samples (Fig. 2, A and B) is similar to that observed with Ara-C (Fig. 1A) and sup-ports our reasoning. By measuring peak biolumines-cence increase in the presence and absence of AP (⫹/⫺), it is possible to quantify the intracellular conver-sion of Ara-C to Ara-CTP, within leukemic cells. Fig. 2, A and C, show that there is good correlation between light output⫹/⫺AP and nanomolar concentrations of Ara-CTP and also that concentrations as low as 25 nmol/L
Fig. 4. Schematic of the cell lysis assay usingE. coli HA1 to show intracellular response to Ara-C.
(A), Mononuclear cells from patients with AML incubated with Ara-C were washed and lysed in the presence of EDTA (1.5 mmol/L) and saponin (1.0 g/L). (B), Subsequent cell lysate (containing both Ara-C and Ara-CTP) was exposed to the bacterial biosensor in the presence or absence of AP. (C), In the presence of AP, Ara-CTP is converted to Ara-C, which on entering the bacterium allows the generation of bioluminescence. (D), In the absence of AP, Ara-CTP remains intact and cannot enter the bacterium. (E), The ratio between⫹/⫺AP is directly proportional to the concentration of Ara-CTP in the patient blasts, which is representative of the patient’s ability to convert Ara-C to Ara-CTP.
can be detected by a significant increase in light output (P⬍0.05; see Table 3 in the online Data Supplement).
A Western blot for IPTG-induced expression of dCK in the biosensor showed a high level of expression after 3 h (Fig. 3A), leading to the increase in biolumi-nescence (Fig. 3B) only in Ara-C–treated cells plus IPTG.
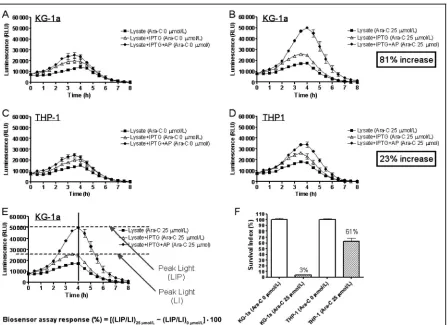
AML cell lines and leukemic cell samples from AML patients with known clinical outcome to Ara-C treatment were used to evaluate the assay outlined by the schematic in Fig. 4. A 3-day cytotoxicity test con-firmed that KG-1a cells were sensitive to Ara-C, whereas the THP-1 cell line was partially resistant (Fig. 5F). Running the assay with and without AP in parallel enabled the determination of the relative proportion of Ara-C that had been converted within AML cells into Ara-CTP. THP-1 cells that had not converted Ara-C to Ara-CTP generated similar output whether or not AP was present in the assay (Fig. 5, C and D). KG1-a
cells generated the greatest difference (P⬍0.001) in light output, in the presence of AP, due to conversion of Ara-C to Ara-CTP, indicating high drug response (Fig. 5, A and B). The diagnostic discriminator, assum-ing that generation of Ara-CTP in AML cells is the ma-jor cause of cell death(4, 5 ), is the maximal difference in light output between the IPTG (LI) and IPTG⫹AP (LIP) curves that are shown in Fig. 5E.
Data were analyzed by single point measurement at peak light output, comparing treated and untreated samples⫹/⫺AP, as shown in Fig. 5E. The calculation of the percentage response uses a simple formula:
Biosensor assay response (%)
⫽[(LIP/LI)25mol/L⫺(LIP/LI)0mol/L]⫻100 Preliminary assay of stored blood and bone marrow samples taken at presentation from 12 known respond-ing and 12 known nonrespondrespond-ing Ara-C–treated
[image:7.585.72.519.84.409.2]tients gave biosensor assay responses between 21 and 128% (median 55%) for responding patients and be-tween ⫺7 and 6% (median 0%) for nonresponding patients (see Table 4 in the online Supplemental Data). A typical example of each type is shown in Fig. 6; pa-tient sample CR (with clinical outcome of complete remission) showed a significant difference in the peak light output (P⬍0.001) in the presence and absence of AP, indicating response to a drug (Fig. 6A), whereas sample NR (nonresponsive clinical outcome) exhib-ited no significant difference (P⬎0.05) in light output
between the (⫹/⫺) curves, indicating a low concentra-tion of Ara-CTP in the cells (Fig. 6B). The 3-day cyto-toxicity test also showed that cells from patient sample CR were significantly more sensitive to Ara-C compared with cells from patient sample NR (Fig. 6C).
Discussion
The cell lysis assay, using the bioluminescent bacterial biosensor as a reporter of Ara-C activity, relies on the response of bacteria to Ara-C. Because of the increased metabolic rate and shorter cell cycle time of bacteria, results can be achieved within a period of hours. In contrast, mammalian cells undergo slower cell divi-sion, which is the reason for the incubation times of 3 days or more needed to measure Ara-C cytotoxicity. The increase in light output from the biosensor, which closely correlates with the concentration of an active drug under assay conditions in clinical samples, gives a measure of mononuclear cell phenotype with regard to intracellular Ara-CTP production during the time in-terval that the cells are exposed to Ara-C.
The bioluminescence increase brought about by Ara-C in the biosensor is similar to previous reports of enhanced light emission in luciferase-based biosensors brought about by impairment of the bacterial intracel-lular equilibrium, leading to NADPH accumulation (20 ), or by DNA damage(21 ). It is reported that biolu-minescence stimulates DNA repair in bacteria, possibly by providing photons for bacterial photolyase activity (22 )and thatluxgenes are regulated by the bacterial SOS stress response(23 ), which may explain the in-crease in bioluminescence in the presence of Ara-C.
The biosensor assay demonstrates Ara-C uptake and activity in mononuclear cells isolated from AML patient bone marrow and peripheral blood samples within 8 h. The assay is the first of its kind, showing phenotypic drug response within 8 h and here has been used in a retrospective study of 24 clinical samples. This is a preliminary validation study, and further work will include prospective, controlled randomized trials to establish the usefulness of the assay for AML and acute lymphoblastic leukemia, which account for 2% of can-cers in the UK(24 ). The assay has the potential to de-tect response to Ara-C of myeloid blasts, irrespective of whether they are obtained at diagnosis or at relapse/ nonresponse. This will be fully evaluated in prospective clinical trials. The assay demonstrates that Ara-C sen-sitivity of AML cells can be simply and accurately de-termined within 8 h, by using the bioluminescent bac-terial reporter construct. Currently, we are extending our studies to include samples from a larger cohort of AML patients to investigate correlation with clinical outcome. If full clinical trials demonstrate that the
as-Fig. 6. Effect of 30 min treatment with Ara-C (25
mol/L) on clinical samples from 2 patients by use of the bioluminescent bacterial reporterE. coli HA1.
Results from a clinically sensitive patient (A) and a clinically resistant patient (B) are shown. Equivalent results using the Cell Titer-Glo Luminescent Cell Viability assay kit (survival index) are shown (C); significance was determined with 1-way ANOVA and Bonferroni adjusted post hoc tests. ***P⬍0.001. Mean of n⫽3 and error bars show range.
[image:8.585.69.285.83.449.2]tion of the degree of response before patients undergo chemotherapy.
Author Contributions:All authors confirmed they have contributed to the intellectual content of this paper and have met the following 3 re-quirements: (a) significant contributions to the conception and design, acquisition of data, or analysis and interpretation of data; (b) drafting or revising the article for intellectual contentl; and (c) final approval of the published article.
Authors’ Disclosures or Potential Conflicts of Interest: Upon manuscript submission, all authors completed the Disclosures of Poten-tial Conflict of Interest form. PotenPoten-tial conflicts of interest:
Employment or Leadership:A. Martin, Randox Laboratories; M. Ruddock, Randox Laboratories.
Consultant or Advisory Role:None declared. Stock Ownership:None declared.
nology and Biological Sciences Research Council, UK (330/E19334); P.J. Hill, Biotechnology and Biological Sciences Research Council, UK (330/E19334); V.C. Salisbury, Biotechnology and Biological Sci-ences Research Council, UK (330/E19334) and Technology Strategy Board, UK (TP/7/SAI/6/S/M1507H).
Expert Testimony:None declared.
Role of Sponsor:The funding organizations played no role in the design of study, choice of enrolled patients, review and interpretation of data, or preparation or approval of manuscript.
Acknowledgments: We thank Staffan Eriksson (University of Copenhagen) for providing the pTrc99-A plasmid, K.J. Jensen (Uni-versity of Copenhagen) for theE. coliMG1655 strain, and Olena Doran (University of the West of England) for advice on manuscript preparation. The work was supported by a grant from the Biotech-nology and Biological Sciences Research Council UK (330/E19334) and in part by a grant from the UK Technology Strategy Board (TP/ 7/SAI/6/S/M1507H).
References
1. Hiddemann W, Buchner T. Current status and perspectives of therapies for acute myeloid leu-kaemia. Semin Hematol 2001;38:3–9.
2. Hudson MM, Strickland DK, Phipps S, Srivastava DK, Ribeiro RC, Rubnitz JE, et al. Late effects of treatment in survivors of childhood acute myeloid leukemia. J Clin Oncol 2000;18:3273–9.
3. Daher GC, Harris BE, Diasio RB. Metabolism of pyrimidine analogues and their nucleosides. Phar-macol Ther 1990;48:189 –222.
4. Yamauchi T, Negoro E, Kishi S, Takagi K, Yoshida A, Urasaki Y, et al. Intracellular cytarabine triphosphate production correlates to deoxycyti-dine kinase/cytosolic 5⬘-nucleotidase II expres-sion ratio in primary acute myeloid leukemia cells. Biochem Pharmacol 2009;77:1780 – 6.
5. Cai J, Damaraju VL, Groulx N, Mowles D, Peng Y, Robins MJ, Cass CE, Gros P. Two distinct molec-ular mechanisms underlying cytarabine resistance in human leukemic cells. Cancer Res 2008 68: 2349 –57.
6. Jordheim L, Galmarini CM, Dumontet C. Drug resistance to cytotoxic nucleoside analogues. Curr Drug Targets 2003;4:443– 60.
7. Smith MA, Smith JG, Pallister CJ, Singer CR. Haematopoietic growth, the cell cycle and sensi-tivity of AML cells to Ara-C. Leuk Lymphoma 1999;23:467–72.
8. Ferrara F. Unanswered questions in acute myeloid leukaemia. Lancet Oncol 2004;5:443–50.
9. Billard P, DuBow MS. Bioluminescence-based as-says for detection and characterization of
bacte-ria and chemicals in clinical laboratories. Clin Biochem 1998;31:1–14.
10.Michelini E, Magliulo M, Leskinen P, Virta M, Karp M, Roda A. Recombinant cell-based biolu-minescence assay for androgen bioactivity deter-mination in clinical samples. Clin Chem 2005;51: 1995– 8.
11.Meighen EA. Bacterial bioluminescence: organi-zation, regulation, and application of the lux genes. FASEB J 1993;7:1016 –22.
12.Alloush HM, Lewis RJ, Salisbury VC. Bacterial bioluminescent biosensors for food and environ-mental monitoring: an overview. Anal Lett 2006; 39:1517–26.
13.Alloush HM, Salisbury VC, Lewis RJ, MacGowan AP. The pharmacodynamics of linezolid in a clin-ical strain ofStreptococcus pneumoniae geneti-cally modified to express lux genes. J Antimicrob Chemother 2002;52:511–3.
14.Beard SJ, Salisbury VC, Lewis RJ, Sharpe JA, MacGowan AP. Expression of lux genes in a clinical isolate ofStreptococcus pneumoniae: us-ing bioluminescence to monitor gemifloxacin ac-tivity. Antimicrob Agents Chemother 2002;46: 538 – 42.
15.Wang J, Neuhard J, Eriksson S. AnEscherichia coli system expressing human deoxyribonucleoside salvage enzymes for evaluation of potential an-tiproliferative nucleoside analogs. Antimicrob Agents Chemother 1998;42:2620 –5.
16.Jensen KF. The Escherichia coli K-12 “wild types” W3110 and MG1655 have an rph frameshift
mu-tation that leads to pyrimidine starvation due to low pyrE expression levels. J Bact 1993;175: 3401–7.
17.Kovach ME, Elzer PH, Hill DS, Robertson GT, Farris MA, Roop RM, Peterson KM. Four new derivatives of broad-host-range cloning vec-tor pBBR1MCS, carrying different antibiotic-resistance cassettes. Gene 1994;166:800 –2.
18.Rowe JM. What is the best induction regimen for acute myelogenous leukemia? Leukemia 1998; 12:S16 –9.
19.Miller JH. Experiments in molecular genetics. New York: Cold Spring Harbor Laboratory; 1972.
20.Galluzzi L, Karp M. Intracellular redox equilibrium and growth phase affect the performance of luciferase-based biosensors. J Biotech 2007;127: 188 –98.
21.Cutter KL, Alloush HM, Salisbury VC. Stimulation of DNA repair and increased light output in re-sponse to UV irradiation inEscherichia coli ex-pressing lux genes. Luminescence 2006;22:177– 81.
22.Kozakiewicz J, Gajewska M, Lyzen´ R, Czyz A, Wegrzyn G. Bioluminescence-mediated stimula-tion of photoreactivastimula-tion in bacteria. FEMS Mi-crobiol Lett 2005;250:105–10.
23.Czyz A, Plata K, Wegrzyn G. Induction of light emission by luminescent bacteria treated with UV light and chemical mutagens. J Appl Genet 2002; 43:377– 89.