Supported by the Czech Science Foundation, Grant No. GACR 526/08/0434 and by the Ministry of Education, Youth and Sports of the Czech Republic, Project No. MSM 6046070901.
Influence of Terrain Attributes and Soil Properties
on Soil Aggregate Stability
Tereza ZÁDOROVÁ, Ondřej JAKŠÍK, Radka KODEŠOVÁ and Vít PENÍŽEK
Department of Soil Science and Soil Protection, Faculty of Agrobiology, Food and Natural Resources, Czech University of Life Sciences Prague, Prague, Czech Republic
Abstract: The study on the relationship between the soil aggregates stability assessed using water stable aggregate (WSA) index and the selected terrain and soil properties was performed on a morphologically diverse study site in Chernozem soil region of Southern Moravia. Soil analyses and detailed digital elevation model processing were the main methods adopted in the study. The soil structure stability is negatively influenced by the soil material removal from the steep parts of the back-slope and re-deposition of the mineral loess material at the base of the slope. The highest aggregates stability was identified in the upper flat parts of the study plot, undisturbed by erosion processes, and at the concave parts of the back-slope with intensive accumulation of organic matter. Statistical analysis showed a significant dependence of aggregates stability on organic carbon content and plan curvature index.
Keywords: loess; soil erosion; soil structure; topography; water stable aggregates
Soil aggregate stability represents an important characteristic of the soil structure, which is closely connected with the soil water regime, soil erodibility, and soil nutrient availability. An enhanced aggre-gate stability decreases the losses of soil, carbon, nitrogen, and phosphorus (Kasper et al. 2009), and increases the amount of macro-aggregates and the total and effective porosity (Shaver et al. 2007). The aggregate (structure) stability influences water flow and contaminants transport in soils Kodešová et al. (2009b). The soil aggregation is affected by different mechanisms in particular soil types. Floc-culated clay particles or their complexes with hu-mus (organo-mineral complexes) and soil organic matter act as the main cementing agents in the soil aggregates development (Six et al. 2002). The level of aggregation and stability of aggregates increase along with the increasing organic matter content, surface area of clay minerals, and cation exchange capacity (Bronick & Lal 2005).
The reciprocal relationship between organic matter and soil aggregation was shown in numer-ous studies. Organic carbon acts as an important binding agent and reversely, the soil aggregation influences organic matter accumulation by provid-ing physical protection to soil organic carbon by its incorporation into aggregates (Wu et al. 1990; Fox & Le Bissonnais 1998; Six et al. 2004). Close linear relationships between organic carbon content and water-stable aggregate variables (mean weight diameter or wet-sieve index) for various soils were found by Angers (1992) and Carter (1992).
al. 2008). The soil aggregates stability decreases in soils under annual crops (Angers et al. 1999), continuous tillage, and arable crop production (Eynard et al. 2006).
The soil aggregate stability may be assessed us-ing various methods, which reflect also different aggregate breakdown mechanisms. A comparison of various methods was presented by Rohošková and Valla (2004) and Kodešová et al. (2009a).
Topography is the key factor forming the soil cover in climatically and geologically homogenous areas. It has a significant influence on a great range of soil physical and chemical properties (Gerrard 1981). A loess region with Chernozem as a dominant soil unit is an example of such an area. Quantitative topographic data are widely applied in studies on how topography influences the soil properties. The slope, curvature, and topographic index (TWI) are the most frequent variables (Pennock 2003). The properties investigated are various: the soil depth (Odeh et al. 1995; Penížek & Borůvka 2006), par-ticle size distribution (Odeh et al. 1995; Zádorová et al. 2009), organic carbon content (McKenzie & Ryan 1999), hydromorphic features (Mummery et al. 1999), soil units delineation (Zádorová et al. 2008, 2011) or, less frequently, the soil structure variability (Cantón et al. 2009).
Numerous studies describe the relationships between the aggregate stability indexes and soil erosion (Le Bissonnais 1996; Cantón et al. 2009). Aggregate stability is a critical component of soil erodibility since it controls the soil dispersion and surface seal development. Aggregate stability and soil erodibility are inversely related.
The spatial heterogeneity of aggregate stability is closely related to the terrain attributes (such as the slope, curvature, aspect) through their impact on various soil properties (Rhoton & Duiker 2008). Most of the studies emphasise the relation between organic carbon, soil erosion, and, the role of the soil aggregation in organic carbon protection in depression areas (Six et al. 2004; Berhe et al. 2007; Yadav & Malanson 2007). Nevertheless, the studies on the soil aggregate stability spatial distribution and its relationship with topography are rather rare and focused more on the assess-ment of soil aggregate stability in different parts of the slope system (Rhoton et al. 2006; Tang et al. 2010) than on their direct relationship with topographic derivatives (Cantón et al. 2009).
The study presented here was performed to assess the soil aggregate stability with respect to
other soil physical and chemical properties and terrain attributes on a cultivated study site intensely changed by soil erosion and soil mass redistribu-tion. The study serves as a preliminary work for a complex research on the spatial heterogeneity of soil structure stability and its relationship with the selected variables.
MATERIAL AND METHODS
Study site
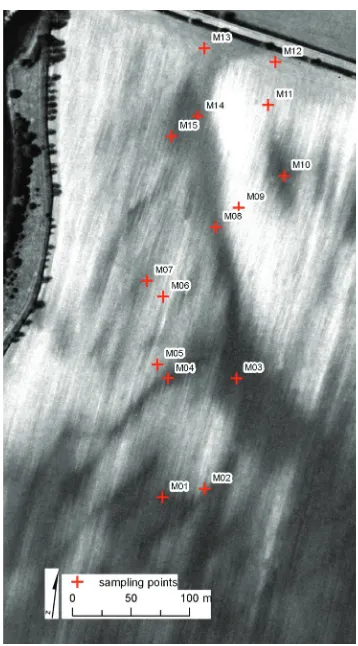
[image:2.595.328.507.387.710.2]The study was situated in a loess region in Southern Moravia in the Czech Republic, i.e. in the Haraska river watershed. The wider area is underlain by upper Eocene molasse facies and Oligocene sandstones covered by a Pleistocene loess layer (Chlupáč et al. 2002). Haplic Cher-nozem is the original dominant soil unit in the wider area. An extremely diversified soil cover resulted from erosion. A detailed research was
carried out on one study plot (strip part of an agricultural parcel, area of 6 ha) in Brumovice cadastre (Figure 1). The site is characterised by a flat upper part (slope 0–0.5°) covered mostly by Haplic Chernozem. The middle part, formed by a substantive tributary valley, is steeper (up to 15°) with eroded phases of Chernozem and Regosol in the most exposed parts. The base slope and the tributary valley soil cover is represented mostly by colluvial Chernozem and Colluvial soil. Mean slope of the plot is 12.7°. The side valley represents a major line of concentrated runoff emptying into a colluvial fan. Winter barley was planted at the study plot when the soil samples were taken from the surface horizon in November 2009.
Methods
The samples for analysis were taken from 15 points in the representative terrain and soil cover positions (Figure 1).
Particle size distribution, organic carbon con-tent, texture, pHH2O,pHKCl, CaCO3 content and particle densitywere measured using the standard
laboratory techniques. The particle size distribu-tion (fracdistribu-tions of clay, silt and sand) was obtained by the hydrometer method (Gee & Or 2002). The total soil carbon content was measured using the dichromate redox titration method (Skjemstad & Baldock 2008). The wet oxidation (K2Cr2O7) was followed by the potentiometric titration with fer-rous ammonium sulfate. The soil pH was measured using a 1:5 (w/v) ratio of soil and water (pHH2O) and 1 M KCl (pHKCl) solution (ISO 10390 1994) using an inoLab Level 1 pH-meter. CaCO3 content was measured using the volumetric calcimeter method described by Looppert and Suarez (1996). The carbonates reacted with HCl (in a sealed system) to form CO2. The pressure increase was measured, which is, under the constant temperature, linearly related to the soil sample carbonate quantity.The pycnometer method (Flint & Flint 2002) was used to measure the particle density.
The aggregate stability was studied using the procedure presented by Nimmo and Perkins (2002). Four grams of air-dry soil aggregates of the size of 2–5 mm were sieved for 3 min in distilled water (sieve 0.25 mm). The aggregates remaining on the sieve were next sieved in sodium
[image:3.595.91.497.436.734.2]aphoshate until only sand particles remained on the sieve. The index of water stable aggregates, WSA (–), was then determined as:
(1)
where:
WDS – weight of aggregates dispersed in the dispersing solution (M)
WDW – weight of aggregates dispersed in distilled water (M)
The topographic derivatives were obtained from the digital elevation model (DEM) derived from the ground laser scanning procedure (Zádorová et al. 2011). The topographic derivatives were calculated using integrated algorithms imple-mented in ILWIS 3.3 (Figure 2) from the DEM: slope, plan (planC) (Figure 2), profile (profC) and mean curvature (meanC), topographic wetness index (TWI), sediment transport index (STI) and stream power index (SPI).
The multiple linear regressions were used to evaluate the relationships between the WSA in-dex and the measured physical and chemical soil properties and terrain attributes. The simple cor-relation between the variables was assessed using Pearson correlation coefficient.
RESULTS AND DISCUSSION
The resulting WSA indexes, the soil properties measured and terrain attributes in each sample,
are shown in Table 1. The soil aggregate stability increased with the increasing WSA index. The highest WSA was determined in undisturbed Cher-nozem in the flat upper part of the plot. The base of the slope covered by Colluvial soil shows a lower aggregate stability, even though the organic carbon content is relatively high due to the soil mass accumulation. The lower WSA index can be caused by partial accumulation of loess material in the low-laying parts of the slope and its mixing with organic matter. Another factor decreasing the structure stability can be the frequent traversing of heavy machinery in this part of the study plot. On the contrary, the concave parts of the back-slope (the tributary valley) showed a high aggre-gate stability, given by the accumulation of pure organic matter. A decrease of aggregates stability is evident in the exposed parts of the slope, mainly due to the intensive soil organic carbon removal and subsoil exposing. Tang et al. (2010) demon-strated a significant difference of the WSA index
between the shoulder and toe slope positions, the
WSA at the toe slope being significantly higher
than that at the shoulder slope. The result was explained by the fact that the small-sized water
stable aggregates displaced at the shoulder slope,
transported by surface flow, and redeposited at the
toe slope accelerated the development of WSA at
the toe slope location. Pierson and Mulla (1990)
found thehighest aggregate stability and organic
carbon content in the foot-slope and toe-slope positions, and the lowest one at the summit.
Statistical analysis (Table 2, Figure 3) showed the dependency of the WSA index on organic carbon content. This result fully corresponds
WDW
WDS
WDS
[image:4.595.66.521.553.726.2]WSA
Figure 3. Regression analysis: relationship between WSA index and organic carbon content (left), relationship between WSA index and plan curvature (right)
W
SA
WSA × Cox WSA × PlanC
Cox PlanC
Ta
ble 1. W
at er st able agg re ga te s ( W SA ) inde x, me asur ed s oil pr op er tie
s and t
er
rain a
ttr
ibut
es in e
ac h sam ple Sam ple W SA (–) Soil unit
Cox (%)
PD (g/c m 3 ) pH H2O pH KC l C aC O3 Cla y Slop e M eanC Pl anC Pr ofC T WI ST I (–) (%) (–) M01 0.51 CE 1.71 2.55 7.55 6.76 0.44 18.50 10.50 0.02 –0.26 –0.02 4.87 0.90 M02 0.50 RG 1.07 2.62 7.78 7.01 1.78 18.62 9.90 –0.04 –0.79 –0.02 5.92 1.55 M03 0.56 CO 1.45 2.55 7.81 6.56 0.82 17.07 9.30 –0.15 –3.54 0.00 7.03 2.63 M04 0.46 CE 1.30 2.58 7.66 6.77 0.95 18.22 12.90 0.03 0.16 0.03 6.36 3.32 M05 0.46 RG 0.52 2.64 7.68 7.08 2.36 13.00 –0.06 –0.69 –0.07 6.76 4.34 M06 0.48 RG 0.95 2.67 7.76 7.04 2.92 17.81 14.10 –0.03 –0.84 –0.09 6.51 4.15 M07 0.43 C E de 1.15 2.61 7.74 6.81 1.35 17.66 13.80 0.04 0.17 0.02 6.02 3.05 M08 0.54 CO 1.54 2.61 7.78 6.87 1.21 17.09 12.50 –0.62 –9.82 –0.22 9.45 20.75 M09 0.38 RG 0.82 2.62 7.87 7.16 2.92 15.68 19.70 0.20 0.50 0.29 4.83 2.94 M10 0.52 CE 1.21 2.57 7.87 6.82 1.37 14.55 8.60 0.21 5.06 –0.01 5.25 0.79 M11 0.39 RG 0.79 2.65 7.99 6.97 2.69 14.79 20.10 0.34 1.88 0.31 5.25 3.91 M12 0.42 CO 1.16 2.61 7.83 6.95 1.90 15.59 6.50 –0.31 –1.26 –0.55 7.10 1.37 M13 0.25 CO 0.70 2.63 7.94 7.01 1.46 14.44 1.90 0.34 17.39 0.31 5.47 0.05 M14 0.56 CO 1.09 2.61 7.82 6.87 1.10 14.08 10.60 –0.98 –16.33 –0.33 9.67 16.78 M15 0.45 CO 1.02 2.63 7.85 6.99 2.27 17.38 14.10 –0.20 –0.90 –0.28 5.16 1.92 C
E – C
her
no
zem, C
E de – de
grade
d C
her
no
zem, R
G – Re
go
sol, C
O – Colluv
ial s oil; Cox – o xid able or ganic c arb
on; PD – p
ar
tic
le density
; me
anC – me
an c ur va tur e; pl
anC – pl
an c
ur
va
tur
e; pr
ofC – pr
ofile c ur va tur e; T W
I – t
op og ra phic we tne ss inde x; S
TI – s
edimen
t transp
or
t inde
Ta
ble 2. Cor
re la tion analy sis b etwe en w at er st able agg re ga te s ( W SA ) inde
x and s
ele
ct
ed s
oil and t
er rain a ttr ibut es (P ears on c or re la tion c oeffic ien t) Cox C aC O3 pH H2O pH KC l W SA Cla y PD Slop e M eanC Pl anC Pr ofC T WI ST I Cox –0.751** –0.758** –0.744** 0.718** 0.503 –0.766** –0.161 –0.379 –0.443 –0.399 0.309 0.262 C aC O3 –0.751** 0.560* 0.817** –0.417 –0.180 0.823** 0.547* 0.299 0.162 0.187 –0.307 –0.168 pH H2O –0.758** 0.560* 0.440 –0.470 –0.754** 0.509 0.060 0.205 0.289 0.266 –0.068 –0.023 pH KC l –0.744** 0.817** 0.440 –0.563* –0.220 0.801** 0.276 0.198 0.236 0.155 –0.252 –0.069 W SA 0.718** –0.417 –0.470 –0.563* 0.318 –0.465 0.075 –0.620* –0.779** –0.512 0.513 0.459 Cla y 0.503 –0.180 –0.754** –0.220 0.318 –0.173 0.152 0.029 –0.127 –0.108 –0.138 –0.150 PD –0.766** 0.823** 0.509 0.801** –0.465 –0.173 0.323 0.072 0.106 0.080 –0.005 0.101 Slop e –0.161 0.547* 0.060 0.276 0.075 0.152 0.323 0.118 –0.312 0.272 –0.174 0.146 M eanC –0.379 0.299 0.205 0.198 –0.620* 0.029 0.072 0.118 0.866** 0.775** –0.888** –0.788** Pl anC –0.443 0.162 0.289 0.236 –0.779** –0.127 0.106 –0.312 0.866** 0.603* –0.743** –0.746** Pr ofC –0.399 0.187 0.266 0.155 –0.512 –0.108 0.080 0.272 0.775** 0.603 –0.579* –0.356 T WI 0.309 –0.307 –0.068 –0.252 0.513 –0.138 –0.005 –0.174 –0.888** –0.743** –0.579* 0.874** ST I 0.262 –0.168 –0.023 –0.069 0.459 –0.150 0.101 0.146 –0.788** –0.746** –0.356 0.874** *, ** P
< 0.05, 0.01;
Cox – o xid able or ganic c arb
on; PD – p
ar
tic
le density
; me
anC – me
an c
ur
va
tur
e; pl
anC – pl
an c
ur
va
tur
e; pr
ofC – pr
ofile c ur va tur e; T W
I – t
op o-gra phic we tne ss inde x; S
TI – s
edimen
t transp
or
t inde
with numerous studies on aggregate stability (e.g., Roberson et al. 1991; Le Bissonnais et al. 2007; Kodešová et al. 2009a). The relationship between WSA and other analytic properties was proved only in the case of negative correlation with pHKCl. The increase of pH together with increasing car-bonates content in the steep parts of the slope evidence of subsoil loess horizon exposition. A lower aggregation of the subsoil then leads to a lower WSA index. The role of the soil reaction in the soil aggregation was showed by Boix-Fayos et al. (2001) and Bronick and Lal (2005). The soil texture did not show any significant relationship with the soil aggregate stability, although the role of the clay content in the aggregation was proven by many authors (e.g. Kay 1998). This fact can be explained by a relatively low spatial heterogeneity of the texture given by a high and non-variable silt content in the whole profile. A similar result was obtained by Cantón et al. (2009).
The role of the terrain attributes concerning WSA index was apparent in the case of curvature. Correlation analysis showed a significant rela-tionship between the mean and plan curvature and WSA index. Regression analysis proved a strong dependency of the aggregate stability on the plan curvature (Figure 3) meaning that decreas-ing (concave) plan curvature implies the increase of aggregates stability. The relationship does not consist in the organic carbon content distribution, when no correlation between organic matter and curvature was determined (Table 2). Zádorová et al. (2011) identified the plan curvature as the main variable influencing the general soil mass redistribution in the study plot where it showed a significant relationship between the soil unit distribution and soil depth. Correlation with the slope is very low. This fact corresponds with the low control of slope in general soil-mass redistribu-tion at the plot (Zádorová et al. 2011). Cantón et al. (2009) did not find any correlation between the terrain attributes and aggregates stability.
Multiple linear regression showed again that the WSA index was affected mainly by the organic carbon content and plan curvature:
WSA = 0. 3498 + 0.0967 × Cox (%) – 0.00722 × planC (2)
Equation explained 85.5% of the variability in the WSA index. The standard deviation of the residuals was 0.046.
CONCLUSIONS
Soil degradation by erosion and deposition is a significant factor changing the soil cover of the studied area. The study site showed a high variability of the soil units due to an accelerated soil erosion. Heterogeneity of the soil aggregate stability can be related to the strong material re-distribution on the slope influencing particularly organic carbon content in the plough layer. The soil structure is negatively influenced by a massive soil material removal from the steep parts of the back-slope and, at the same time, by the deposi-tion of the mineral loess material at the base of the slope. Terrain attributes, as one of the main factors actuating the surface runoff, showed a strong relationship with the structure stability through plan curvature index. The slope, on the contrary, has a very low influence on the spatial distribution of the soil aggregates stability.
Acknowledgements. We thank M. Fér and V. Jirků for their help with the field work.
References
Angers D.A. (1992): Changes in soil aggregation and organic carbon under corn and alfalfa. Soil Science Society of America Journal, 56: 1244–1249.
Angers D.A., Edwards L.M., Sanderson J.B., Bisson-nette N. (1999): Soil organic matter quality and ag-gregate stability under eight potato cropping sequences in a fine sandy loam of Prince Edward Island. Canadian Journal of Soil Science, 79: 411–417.
Berhe A.A., Harte J., Harden J.W., Torn M.S. (2007): The significance of the erosion-induced terrestrial carbon sink. BioScience, 57: 337–346.
Boix-Fayos C., Calvo-Cases A., Imeson A.C., Soria-no-Soto M.D. (2001): Influence of soil properties on the aggregation of some Mediterranean soils and the use of aggregate size and stability as land degradation indicators. Catena, 44: 47–67.
Bronick C.J., Lal R. (2005): Soil structure and manage-ment: a review. Geoderma, 124: 3–22.
Cantón Y., Solé-Benet A., Asensio C., Chamizo S., Puigdefábregas J. (2009): Aggregate stability in range sandy loam soils relationships with runoff and erosion. Catena, 77: 192–199.
soil in a humid climate. Soil and Tillage Research, 23: 361–372.
Chlupáč I., Brzobohatý R., Kovanda J., Stráník Z. (2002): Geological History of the Czech Republic. Academia, Praha. (in Czech)
Eynard A., Schumacher T.E., Lindstrom M.J, Malo D.D., Kohl R.A. (2006): Effects of aggregate structure and organic C on wettability of Ustolls. Soil and Tillage Research, 88: 205–216.
Flint A.L., Flint L.E. (2002): Particle density. In: Dane J.H., Topp G.C. (eds): Methods of Soil Analysis, Part 4 – Physical Methods. Soil Science Society of America, Madison, 229–240.
Fox D.M., Le Bissonnais Y. (1998): Process-based analysis of aggregate stability effects on sealing, infil-tration, and inter-rill erosion. Soil Science Society of America Journal, 62: 717–724.
Gee G.W., Or D. (2002): Particle-size analysis. In: Dane J.H., Topp G.C. (eds): Methods of Soil Analysis, Part 4 – Physical Methods. Soil Science Society of America, Madison, 255–294.
Gerrard A.J. (1981): Soils and Landforms. An Integra-tion of Geomorphology and Pedology. George Allen and Unwin, London.
ISO 10390 (1994): Standard of Soil Quality – Determina-tion of pH. InternaDetermina-tional OrganizaDetermina-tion of Standardiza-tion, Prague.
Kasper M., Buchan G.D., Mentler A., Blum W.E.H. (2009): Influence of soil tillage systems on aggregate sta-bility and the distribution of C and N in different aggre-gate fractions. Soil and Tillage Research, 105: 192–199. Kay B.D. (1998): Soil structure and organic carbon: a re-view. In: Lal R., Kimble J.M., Follett R.F., Stewart B.A. (eds): Soil Processes and the Carbon Cycle. CRC Press, Boca Raton, 169–197.
Kodešová R., Rohošková M., Žigová A. (2009a): Comparison of aggregate stability within six soil pro-files under conventional tillage using various labora-tory tests. Biologia, 64: 550–554.
Kodešová R., Vignozzi N., Rohošková M., Hájková T., Kočárek M., Pagliai M., Kozák J., Šimůnek J. (2009b): Impact of varying soil structure on transport processes in different diagnostic horizons of three soil types. Journal of Contaminant Hydrology, 104: 107–125.
Le Bissonnais Y. (1996): Aggregate stability and as-sessment of soil crustability and erodibility: I. Theory and methodology. European Journal of Soil Science, 47: 425–437.
Le Bissonnais Y., Blavet D., De Noni G., Laurent J.Y., Asseline J., Chenu C. (2007): Erodibility of Medi-terranean vineyard soils: relevant aggregate stability
methods and significant soil variables. European Jour-nal of Soil Science, 58: 188–195.
Looppert H.R., Suarez L.D. (1996): Carbonate and gypsum. In: Sparks D.L., Page A.L., Helmke P.A., Loeppert R.H., Soltanpour P.N., Tabatabai M.A., Johnston C.T., Sumer M.E. (eds): Methods of Soil Analysis, Part 3 – Chemical Methods. Soil Science Society of America, Madison, 437–474.
McKenzie N.J., Ryan P.J. (1999): Spatial prediction of soil properties using environmental correlation. Geoderma, 89: 67–94.
Mummery D., Battaglia M., Beadle C.L., Turnbull C.R.A., McLeod R. (1999): An application of terrain and environmental modelling in a large-scale forestry experiment. Forest Ecology and Management, 118: 149–159.
Nimmo J.R., Perkins K.S. (2002): Aggregate stability and size distribution. In: Dane J.H., Topp G.C. (eds): Methods of Soil Analysis, Part 4 – Physical Methods. Soil Science Society of America, Madison, 317–328. Odeh I.O.A., McBratney A.B., Chittleborough D.J.
(1995): Further results on prediction of soil proper-ties from terrain attributes: heterotopic cokriging and regression-kriging. Geoderma, 67: 215–226.
Olchin G.P., Ogle S., Frey S.D., Filley T.R., Paus-tian K., Six J. (2008): Residue carbon stabilization in soil aggregates of no-till and tillage management of dryland cropping systems. Soil Science Society of America Journal, 72: 507–513.
Pagliai M., Vignozzi N., Pellegrini S. (2004): Soil structure and the effect of management practices. Soil and Tillage Research, 79: 131–143.
Penížek V., Borůvka L. (2006): Soil depth prediction supported by primary terrain attributes: a comparison of methods. Plant, Soil and Environment, 52: 424–430. Pennock D. (2003): Terrain attributes, landform seg-mentation, and soil redistribution. Soil and Tillage Research, 69: 15–26.
Pierson F.B., Mulla D.J. (1990): Aggregate stability in the Palouse region of Washington: effect of landscape position. Soil Science Society of America Journal, 54: 1407–1412.
Rhoton F.E., Emmerich W.E., Goodrich D.C., Miller S.N., McChesney D.S. (2006): Soil geomorphological characteristics of a semiarid watershed: influence on carbon distribution and transport. Soil Science Society of America Journal, 70: 1532–1540.
Rhoton F.E., Duiker S.W. (2008): Erodibility of a soil drainage sequence in the loess uplands of Mississippi. Catena, 75: 164–171.
ag-gregation in an orchard soil. Soil Science Society of America Journal, 55: 734–739.
Rohošková M., Valla M. (2004): Comparison of two methods for aggregate stability measurement – a re-view. Plant, Soil and Environment, 50: 279–382. Shaver T., Peterson G., Ahuja L., Westfall D.,
Sher-rod L., Dunn G. (2007): Surface soil properties after twelve years of dryland no-till management. Available at www.ars.usda.got/research/publications.
Six J., Feller C., Denef K., Ogle S.M. (2002): Soil organic matter, biota and aggregation in temperate and tropical soils – Effect of no-tillage. Agronomie, 22: 755–775.
Six J., Bossuyt H., Degryze S., Denef K. (2004): A history of research on the link between (micro)ag-gregates, soil biota, and soil organic matter dynamics. Soil and Tillage Research, 79: 7–31.
Skjemstad J.O., Baldock J.A. (2008): Total and organic carbon. In: Carter M.R., Gregorech E.G. (eds): Soil Sampling and Method of Analysis. Canadian Society of Soil Science, Taylor and Francis Group, Boca Raton, 225–237.
Tang X., Liu S., Liu J., Zhou G. (2010): Effects of vegeta-tion restoravegeta-tion and slope posivegeta-tions on soil
aggrega-tion and soil carbon accumulaaggrega-tion on heavily eroded tropical land of Southern China. Journal of Soils and Sediments, 10: 505–513.
Wu L., Vomocil J.A., Childs S.W. (1990): Pore size, particle size, aggregate size, and water retention. Soil Science Society of America Journal, 54: 952–956. Yadav V., Malanson G. (2007): Progress in soil
organ-ic matter research: litter decomposition, modelling, monitoring and sequestration. Progress in Physical Geography, 31: 131–154.
Zádorová T., Chuman T., Šefrna L. (2008): A method proposal for colluvisol delineation in Chernozem’s region. Soil and Water Research, 3: 199–214.
Zádorová T., Brodský L., Rohošková M. (2009): Soil-terrain modelling and erosion analysis at field scale level, a case study. Soil and Water Research, 4: 84–90. Zádorová T., Penížek V., Šefrna L., Rohošková M., Borůvka L. (2011): Spatial delineation of organic carbon-rich Colluvial soils in Chernozem regions by Terrain analysis and fuzzy classification. Catena, 85: 22–33.
Received for publication March 4, 2011 Accepted after corrections May 30, 2011
Corresponding author:
Mgr. Tereza Zádorová, Česká zemědělská univerzita v Praze, Fakulta agrobiologie, potravinových a přírodních zdrojů, katedra pedologie a ochrany půdy, Kamýcká 129, 165 21 Praha 6-Suchdol, Česká republika