Towards in silico toxicity prediction: Analyzing superfund chemicals for their biological properties using the Toxcast data
Andrew Nguyen
A thesis submitted to the faculty at the University of North Carolina at Chapel Hill in partial fulfillment of the requirements for the degree of Master of Science in Public Health in the Department of Environmental Sciences and
Engineering in the Gillings School of Global Public Health.
Chapel Hill 2016
Approved by:
Rebecca Fry Jill Stewart Stephen Whalen
© 2016 Andrew Nguyen ALL RIGHTS RESERVED
Abstract
Andrew Nguyen: Towards in silico toxicity prediction: Analyzing superfund chemicals for their biological properties using the Toxcast data
Under the direction of Rebecca Fry
In 1980, the Superfund program was established in response to the growing concern about hazardous waste sites in the United States. Many toxicological exposure assessments, remediation processes and estimation of human health risks at Superfund sites depend on animal studies as a model for assessment. However, with the existence of thousands of potentially harmful toxicants, using a traditional in vivo approach to prioritize chemicals can become time-consuming and expensive. In this project, we set out to prioritize chemicals found at U.S. Superfund sites by incorporating a novel computational toxicological modeling tool, ToxPi, and half-maximal activity (AC50) data from in vitro assays run by the ToxCast program. Focusing on the biological processes (n=11) defined by ToxCast, we defined overall biological potency profiles, derived a rank based on a score for the 244 SPL toxicants which had a statistically significant correlation to the ATSDR 2013 SPL Rankings, and identified unique bioactivity trends.
INTRODUCTION
The release of hazardous substances or mixtures onto U.S. lands pose a risk to human health and the environment. The Superfund program was developed to clean these hazardous wastes sites and substances identified by the U.S. Environmental Protection Agency (EPA). These hazardous waste sites are known as Superfund sites and are placed on the National Priorities List (NPL). Both the ATSDR and the EPA are required to prepare a list, the ATSDR Substance Priorities List (SPL), which ranks the substances commonly found at facilities on the NPL that post the most significant potential threat and exposure to human health. The list was meant to help the Superfund program prioritize dangerous toxicants and sites for clean-up. The Superfund program was originally a two billion dollar, ten year plan, but it has extended over 35 years and has incurred an estimated trillion dollars in total cost. The completion of the Superfund program may be attributed to the presence of too many chemicals for toxicological assessments using traditional in vivomethods.
There are thousands of chemicals that humans and environmental species are exposed to. However, only a small percentage of those chemicals have been tested using the standard in vivo test method (Judson R. et al., 2014).
Thus, the challenge for most toxicology research is that there are too many chemicals for standard in vivo testing methods. To address this issue, the EPA developed the ToxCast program. The ToxCast program was developed with the intention of testing a large range of environmental chemicals using in vitro high-throughput screening (HTS) and high-content screening (HCS) assays to obtain activity profiles for predicting toxicity and prioritizing chemicals (EPA, 2014).
The ToxCast database houses thousands of chemicals which are analyzed through thousands of assays to establish dose-relationships between chemical and assay as half-maximal activity concentration (AC50). The assays contained in ToxCast is meant to collect information that can be used to profile chemicals. The assays provide information such as biological process target, intended target family, and target genes. Despite the robust ToxCast database, trying to manipulate data from over 800 assays to profile the overall toxicity of a chemical can become tedious and difficult to visualize especially when comparing thousands of chemicals. While ToxCast may provide the information needed to effectively predict and determine the toxicity of chemicals, a computational method that can take advantage of this data was missing.
The Toxicological Priority Index (ToxPi) may be the solution and can potentially alleviate some of the existing challenges in toxicology research. ToxPi is a flexible, computational tool with several key features:
extensibility to incorporate additional types of data, exposure, multivariate assessment of toxicity relative to any set of chemicals, differential weighting factors for various information domains and data sources, transparency in score deviation and visualization, and flexibility to customize components for diverse prioritization tasks (Reif et al. 2010).
ToxPi creates a ranking system formatted around a graphical framework for analyzing complex toxicological data (Reif et al. 2010). Similar to other computational toxicology approaches, ToxPi showcases the strengths of a cost effective method that can accurately assesses and prioritize chemicals based on their effects on biological processes.
This article describes the implementation of ToxPi for the objective chemical prioritization of Substance Priority Listed (SPL) toxicants (n=244) within the ToxCast database to identify and reveal plausible biological pathways for predictive toxicology assessments.
MATERIALS AND METHODS Data Source
The data set used to create the prioritization profiles was based on the ToxCast database (n=9076) queried for ATSDR 2013 SPL toxicants (n=878). Initially, a total of n=158 chemicals were identified in both ToxCast and the ATSDR substance priority list but, database updates at the end of 2014 led to an increase of chemical overlap (n=244). The primary data set used for data analysis included the 2014 ToxCast data updates, thus the total number of chemical overlap (n=244) and their accompanying data was used.
Assay Selection
Any chemical submitted to ToxCast undergo a battery of in vitro biological assays (n=342) generating data for 821 assay endpoints. The assay endpoints are categorized into various descriptors such as biological process target (n=11), intended target family assay types (n=22), and different target genes (n=334) indicated in the ToxCast Assay Target Info spreadsheet. For data analysis, assay endpoints were selected categorized based on biological process target which is related to a cumulative, biological response. After the assays were categorized into the specific biological process targets, a reference gene list was obtained based on the gene symbol annotations for each assay.
ToxPi Analysis
Using the ToxCast Annotation Assay Target Info, the assays were identified and categorized based on their biological process. The 244 overlapping substances found in both the ATSDR substance priority list and ToxCast were integrated into ToxPi as a Microsoft excel comma separated values (CSV) file. The ToxPi GUI was used to organize the assay data into slices where each slice represented one of the n=11 different biological process targets. For each slice, the slice weight can be scaled from 1 to 25. A slice weight of 1 was applied throughout the analysis. Each slice had a defaulted color but was changed individually to help distinguish between slices. After the assays were categorized, the component values were scaled using one of six available formulas. Since ToxCast represent their data as AC50 values a concentration level is considered a “hit” or active for an assay, the formula −1 ∗ log10(𝑥) + log10(max(𝑥)) was used. AC50 values that are small is represented as being potent while larger values are representative of non- active chemicals. The max(𝑥) portion of the equation represented data values that were defined as “not-active”. In ToxPi, potency is measured as distance from the center. Therefore, the more potent a chemical is, the larger the ToxPi slice. Chemical potency estimates is represented graphically by the size of the ToxPi slice as well as a numerical ToxPi value for that indicated slice. Overall, ToxPi produces a quasi-pie or ToxPi profile that can graphically show overall potency. However, each ToxPi profile has an overall ToxPi score that represents the ToxPi profiles. Chemicals that are more potent should have a larger ToxPi score. ToxPi profiles for the data set (n=244) was conducted for each biological process and an overall analysis in which each slice represented a biological process. The ToxPi data output from the overall analysis was used to rank the chemicals from 1 to 244 where 1 is considered the most potent. Figure 1 details the various components in a ToxPi profile and how to interpret the results.
Chemical Rank Comparison
Based on the overall ToxPi score for each chemical (n=244), chemical rankings were determined. ToxPi profiles with larger overall ToxPi scores were considered more potent and should be prioritized over the chemicals with lower overall ToxPi scores. Therefore, the chemicals with higher overall ToxPi scores were ranked higher (ie. 1), and chemicals with lower overall ToxPi scores were ranked lower (ie. 244). A linear regression model to compare the two rankings were made through Microsoft Excel 2013.
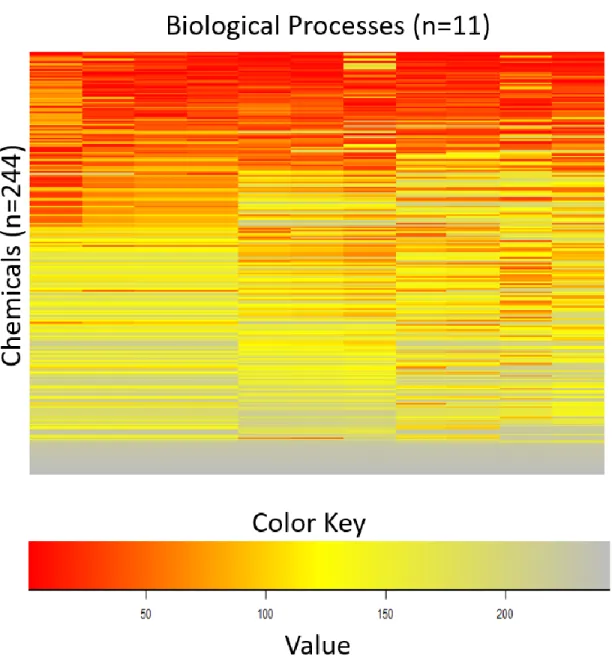
Heatmap and Hierarchical clustering
A heatmap was created to graphically represent all 244 chemicals and their ranking across each biological process using R-studio (v.3.2.4). Unsupervised, hierarchical clustering analysis using a complete-linkage method was performed to determine trends found within the heatmap using R-studio (v.3.2.4). Each cluster group was outlined with a red border and labeled as group 1, group 2, and group 3. (Figure 2) The chemicals in each clusters were identified with R-studio (v.3.2.4).
Identification and Distribution of Chemical Use
Once the chemicals were identified, the chemicals were queried for using their Chemical Abstracts Service Registry Number (CASRN) identifier through the iCSS ToxCast dashboard (v2). With the iCSS TOxCast dashboard (v2), the chemical use category was identified for each chemical (n=244) in the data set. Through Microsoft Excel 2013, the overall chemical use count distribution was determined by creating pivot table. A chemical use count distribution was determined for each chemical group cluster.
Identifying Bioactive Chemicals
Chemicals that were considered bioactive were determined based on their overall ToxPi value. Chemicals which had an overall ToxPi value two standard deviations above the mean overall ToxPi value were considered bioactive.
Identification of Target Genes and Biological Relevance
Using the Comparative Toxicogenomic Database, the top 10 ranking chemicals were individually queried for their known gene interactions and cross-referenced to the gene list provided by the ToxCast library. Genes that were not found in the cross-referenced gene list were removed and the remaining genes were queried for associated diseases that were statistically significant (p<0.01).
Chemical Properties
Chemical property descriptors such as the octanol/water partition coefficient, cell membrane permeability, and predicted percent human absorption were determined by QikProp. In some cases, values for logP and other chemical properties were unavailable.
Results
Overlap between Tox Cast data and ATSDR
The ToxCast data presented n=9076 chemicals and n=821 different assay endpoints was obtained from the EPA ToxCast site (https://www.epa.gov/chemical-research/toxicity-forecaster-toxcasttm-data), and queried for ATDSR 2013 (n=1000) chemicals. A total of n=244 chemicals were identified that were assayed in ToxCast (Table S1).
General Biological Processes Enrichment
The 244 chemicals that overlapped with ATSDR toxicants were analyzed in ToxPi to visualize a general effective- enrichment of each chemical for 11 different biological processes: cell cycle, cell death, cell morphology, cell proliferation, mitochondrial depolarization, oxidative phosphorylation, protein stabilization, receptor binding, regulation of catalytic activity, regulation of gene expression, and regulation of transcription factor activity. Overall ToxPi values ranged from 0 to 6.437 (Table S2). Based on the overall ToxPi value, approximately 10% of the chemicals (n=22) were considered bioactive across all biological processes. However, a total of 63 chemicals were identified as bioactive in at least one biological process. Across each biological process, 50% or more of the top 10%
bioactive chemicals showed significant perturbations in 6 of the 11 biological processes: cell death, protein stabilization, mitochondrial depolarization, oxidative phosphorylation, regulation of gene expression, and cell morphology. Among the top 10% bioactive chemicals (n=22), 10 different chemical use categories were identified:
11 insecticides, 3 fungicides, 2 plasticizers, 2 degradates, 1 bactericide, 1 flame retardant, 1 herbicide, 1 natural, and 1 wood preservative (Table 1).
Hierarchical clustering
A heatmap was created which show trends among the chemicals based on their ranks. Chemicals that are ranked the highest or more active are colored red while the chemicals that are considered moderately active are colored yellow and the chemicals that are considered least active are colored gray (Figure 2). Three distinct clusters are identified:
group 1, group 2, and group 3. Group 1 consisted of 72 chemicals, group 2 consisted of 89 chemicals, and group 3 consisted of 83 chemicals (Figure 3). Based on ToxPi rankings, group 1 contained the most toxic chemicals, group 2 consisted of chemicals that are considered moderately toxic in comparison to the other chemicals within the dataset, while group 3 consisted of the least toxic chemicals within the dataset. The iCSS ToxCast database was used to identify
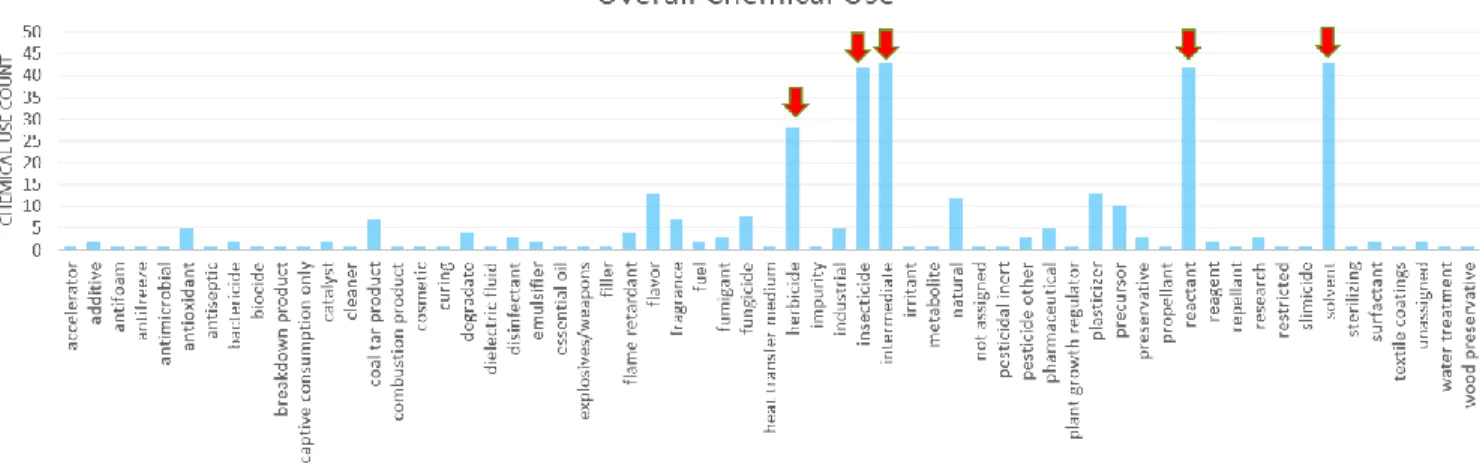
the different chemical use annotation terms (n=61) for each chemical (n=244). The overall chemical use distribution is shown in Figure 4 in which the major chemical use categories are highlighted with a red arrow in the figure and boxed in red in Table 2.
Hierarchical clustering-Group 1
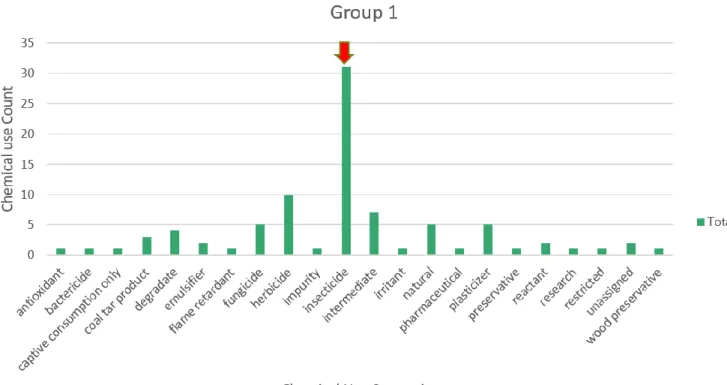
Group 1 included 22 different chemical use annotation terms identified as: insecticide, herbicide, intermediate, plasticizer, natural, fungicide, degradate, coal tar product, reactant, emulsifier, unassigned, pharmaceutical, antioxidant, flame retardant, research, preservative, bactericide, captive consumption only, impurity, irritant, restricted, and wood preservative. Of the chemical use categories identified in group 1, insecticides (n=31) are the most abundant and represented 73.8% of all chemicals identified as an insecticide in the dataset (Figure 5, Table 3).
The next abundant identifier are herbicides (n=10) which represented 35.7% of all chemicals identified as an herbicide in the dataset.
Hierarchical clustering-Group 2
Cluster group 2 contained 35 different chemical use terms which are identified as: solvent, intermediate, reactant, herbicide, insecticide, precursor, fragrance, industrial, plasticizer, flavor, antioxidant, pesticide other, natural, fungicide, fumigant, catalyst, coal tar product, pharmaceutical, flame retardant, preservative, disinfectant, additive, fuel, reagent, surfactant, antifoam, cleaner, cosmetic, essential oil, explosives/weapons, filler, heat transfer medium, not assigned, pesticidal inert, propellant, and textile coatings. Of the chemical use categories identified (n=35) in group 2, solvents (n=20), intermediate (n=17), reactant (n=15) and herbicide (n=14) are the most abundant and represented 46.5%, 39.5%, 35.7%, and 50% of all chemicals, respective to their chemical use in the dataset (Figure 6, Table 4).
Hierarchical clustering-Group 3
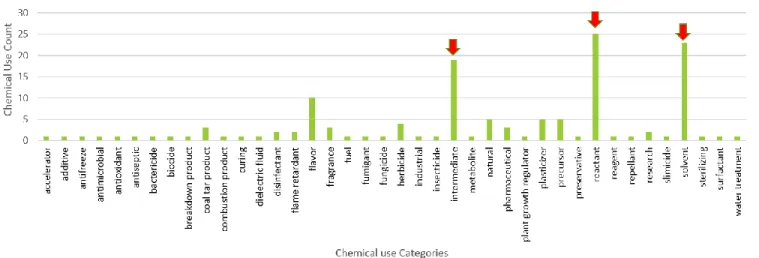
Cluster group 3 contained 40 different chemical use categories which include: reactant, solvent, intermediate, flavor, precursor, plasticizer, natural, herbicide, fragrance, coal tar product, pharmaceutical, flame retardant, disinfectant, research, insecticide, industrial, antioxidant, fungicide, fumigant, preservative, additive, fuel, reagent, surfactant, bactericide, accelerator, antifreeze, antimicrobial, antiseptic, biocide, breakdown product, combustion product, curing dielectric flued, metabolite, plant growth regulator, repellant, slimicide, sterilizing, and water treatment. Of the
chemical use categories identified in group 1, reactants (n=25) are the most abundant and represented 59.5% of all chemicals identified as a reactant in the dataset. Solvents (n=23), intermediates (n=19), and flavor (n=10) are the next most abundant chemical use identifier and represented 53.4%, 44.18%, and 76.9% of all chemicals, respective to their chemical use in the dataset (Figure 7, Table 5).
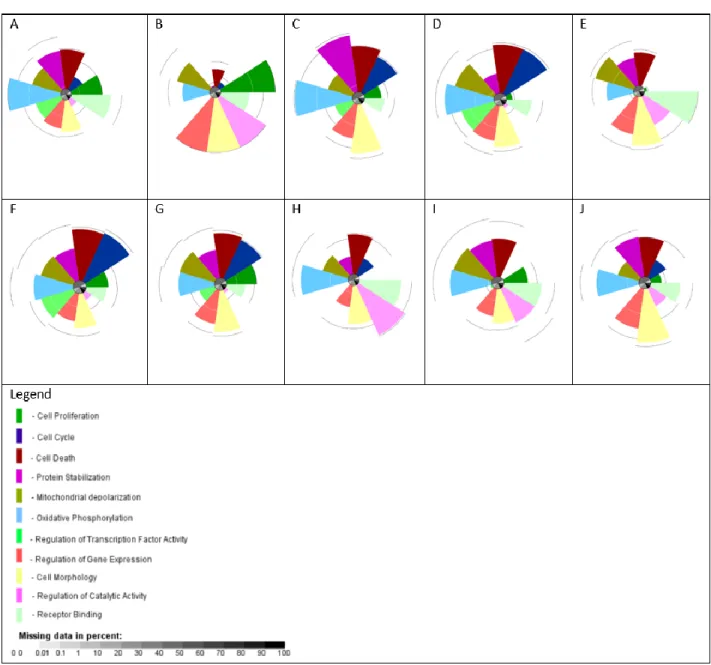
Top 10 Predicted Chemicals in ToxPi
The top 10 ranking chemicals were chlordane, thiram, heptachlor, p,p’-DDD, mercuric chloride, dinoseb, o,p’-DDT, captan, tannic acid, and naled respectively (Figure 8). Based on the ToxPi profiles, the top 10 ranking chemicals showed a high degree of activity for a majority of the biological processes (Figure 8). Significant perturbations for each chemical was determined based on their biological processes enrichment. To specify, chlordane was shown to significantly disrupt cell proliferation, cell death, protein stabilization, mitochondrial depolarization, oxidative phosphorylation, regulation of transcription factor activity, regulation of gene expression, cell morphology, and receptor binding. Thiram was shown to significantly disrupt cell proliferation, mitochondrial depolarization, regulation of gene expression, cell morphology, regulation of catalytic activity, and receptor binding. Heptachlor was shown to significantly disrupt cell cycle, cell death, protein stabilization, mitochondrial depolarization, oxidative phosphorylation, regulation of gene expression, and cell morphology. p,p’-DDD was shown to significantly disrupt cell cycle, cell death, mitochondrial depolarization, oxidative phosphorylation, regulation of transcription factor activity, regulation of gene expression, and cell morphology. Mercuric chloride was shown to significantly disrupt protein stabilization, mitochondrial depolarization, oxidative phosphorylation, regulation of gene expression, cell morphology, regulation of catalytic activity, and receptor binding. Dinoseb was shown to significantly disrupt cell cycle, cell death, protein stabilization, mitochondrial depolarization, oxidative phosphorylation, regulation of transcription factor activity, and cell morphology. o,p’-DDT was shown to significantly disrupt cell proliferation, cell cycle, cell death, protein stabilization, mitochondrial depolarization, oxidative phosphorylation, regulation of gene expression, and cell morphology. Captan was shown to significantly disrupt mitochondrial depolarization, oxidative phosphorylation, cell morphology, regulation of catalytic activity, and receptor binding. Tannic acid was shown to significantly disrupt protein stabilization, mitochondrial depolarization, oxidative phosphorylation, cell morphology, regulation of catalytic activity, and receptor binding. Naled was shown to significantly disrupt protein stabilization, oxidative phosphorylation, regulation of gene expression, cell morphology, and receptor binding.
Chemical Properties-Top 10
The top 10 ranking chemicals are mainly used as pesticides except for tannic acid, which was categorized as a natural substance. Based on the octanol/water partition coefficient (logP) values and chemical category, a majority of the compounds are structurally different except for p,p’-DDD and o,p’-DDT or chlordane and heptachlor. The top ten, logP values for mercuric chloride and tannic acid could not be obtained. Based on QikProp analysis, a majority of the chemicals were determined to have a high human oral absorption percentage, high predicted apparent MDCK cell permeability, and moderate central nervous system activity with two having high activity and one having no activity.
The logP values of the top 10 chemicals showed significant differences among the top 10. Chlordane, heptachlor, p,p’- DDD, and o,p’-DDT had similar logP values with the lowest being 5.835 and the highest being 6.882 while the remaining chemicals were between -1.417 and 2.839.
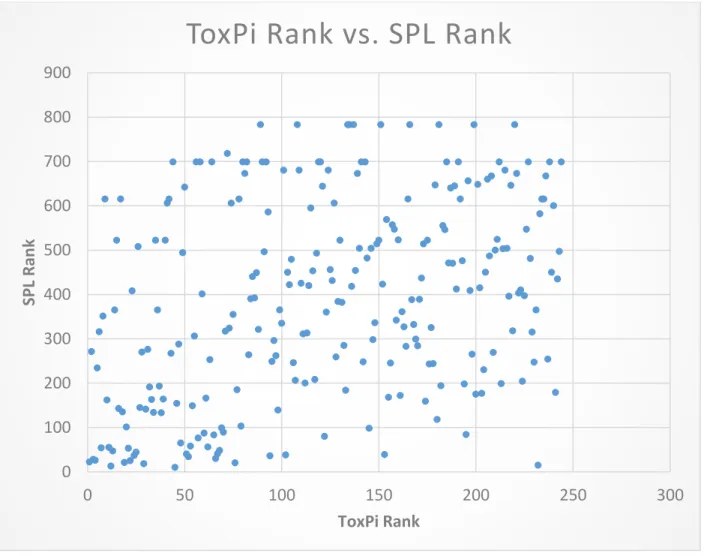
ATSDR/ToxPi Differences
Surprisingly, the top 10 ranking chemicals in ToxPi had low SPL rankings. For example, chlordane ranked 1 in ToxPi but only ranked 22 in ATSDR. Thiram ranked 2 for ToxPi but only ranked 271 for ATSDR. A regression model comparing ToxPi Rank and SPL rank showed that the F-statistic is 39.572 with a p-value of 1.468E-9. The p-value suggests that the parameters are jointly statistically significant. (Figure 9, Table 6).
Gene Interactions
The reference gene list (n=334) were queried for known interacting genes associated for the top 10 ranking chemicals individually. Chlordane resulted in a gene list of n=19, thiram resulted in a gene list of n=34, heptachlor resulted in a gene list of n=19, p,p’-DDD resulted in a gene list of n=45, mercuric chloride resulted in a gene list of n=73, o,p’- DDT resulted in a gene list of n=42, captan resulted in a gene list of n=6, and naled resulted in a gene list of n=4. Both tannic acid and dinoseb had known gene interactions. However, the known interacting genes were not found in the reference gene list (n=334). Therefore, tannic acid and dinoseb were removed from the analysis for disease associations.
The gene list for chlordane resulted in n=120 statistically significant diseases associations (p<0.01). The gene list for thiram resulted in n=300 statistically significant disease associations. The gene list for heptachlor resulted in n=156 statistically significant diseases associations. For p,p’-DDD, there were n=310 statistically significant diseases
associations, mercuric chloride resulted in n=419 statistically significant diseases associations, o,p’-DDT resulted in n=285 statistically significant diseases associations, captan resulted in n=55 statistically significant diseases associations, and naled resulted in n=19 statistically significant diseases associations (Table 7).
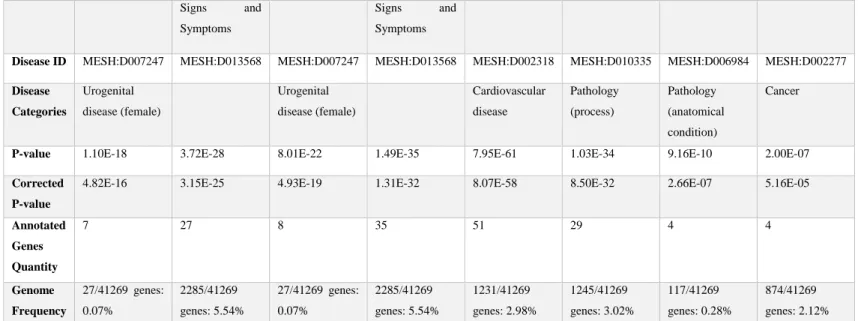
The top 10 ranking chemicals, excluding dinoseb and tannic acid, and their gene-disease associations showed that cancer was the predominant disease category for each chemical. There are many potential avenues to discuss the biological relevancies for each chemical gene list and their associated diseases. One example could be broadly focused around cardiovascular diseases. Results showed that n=3 chemicals: chlordane, captan and naled, did not have a statistically significant (p<0.01) association with hypertension. In comparison, n=5 chemicals: thiram, heptachlor, p,p’-DDD, mercuric chloride, and o,p’-DDT showed significant associations with hypertension.
Discussion
In the present study, we aimed to assess the capabilities of ToxPi as a computational modeling tool for predicting the propensity of SPL chemicals to disrupt biological processes based on in vitro data provided by ToxCast.
Based on the available ToxCast data for SPL chemicals, a unique approach for identifying patterns found from the bioassay response for each chemical was carried-out using ToxPi. ToxPi graphically represents data in a quasi-pie chart where the individual slices vary their distance from the center of the circle. The distance of the slices are proportional to a normalized interval [0,1] (Reif et al. 2010). These values represent the amount of activity or potency a chemical has towards a specific slice (Reif et al. 2010). With each slice, a scaling factor can be applied to increase the importance of a slice in comparison to the other slices within the pie. Upon scaling, ToxPi results would show the scaled slice as having a larger width compared to other slices. Within the study, each slice (n=11) were equally scaled to reduce bias when assessing the chemicals’ ability to perturb a biological process based on their ToxPi values and slice size.
A chemical was considered enriched if their ToxPi value was two standard deviations above the mean ToxPi value in each biological process. For example, the ToxPi mean for cell proliferation is 0.09832 and the standard deviation was 0.1896. Therefore, any chemical with a ToxPi value of 0.47752 or greater was considered bioactive and lead to significant perturbation. The ToxPi value for each slice is determined in respect to the values of the other chemicals within the dataset analyzed. Along with the ToxPi values for each individual slice, ToxPi provides an overall ToxPi value for the whole pie which was used to determine the chemicals’ potency to disrupt biological processes overall. Similar to the individual slices, the overall ToxPi value captures the chemicals’ potency compared to the other chemicals. Although this study presented a chemicals’ propensity to disrupt the biological processes overall, ToxPi can be used to examine specific events such as the endocrine disruption capabilities of the chemicals (Reif et al. 2010).
Based on the ToxPi profiles and overall ToxPi scores, we determined that ToxPi can be used as a computational tool for ranking SPL toxicants.
Once we determined that ToxPi can be used as a computational tool to rank SPL toxicants, we assessed whether the ToxPi rankings were comparable to the ATSDR SPL rankings. While the number of SPL chemicals (n=878) is drastically smaller than the number of chemical in the ToxCast database (n=1858), there was only ToxCast data for the 244 SPL toxicants. Of the 244 chemicals, the top ranking chemicals on the 2013 SPL such as arsenic, lead, mercury, and cadmium were not included. The chemical rankings based on the overall ToxPi values were found
to be significantly different from the rankings assigned on the 2013 SPL (Figure 9, Table 1). Despite the large discrepancies between the absolute rankings in ToxPi and SPL, the linear regression model indicated a significant relationship with a p-value of 1.468E-9. Many chemicals considered most toxic within the data set was not reflected in the 2013 SPL. Chemicals such as thiram, which ranked 2 in the dataset analyzed was only ranked 271 for ATSDR.
While the number of chemicals may influence the absolute rank of a given chemical, the difference between the two rankings was alarming.
Although absolute rankings may change and be influenced by the type of data included, the quantile regions along the entire ToxPi distribution should be more important in determining the relative toxicity. The differences in rankings may be affected by the type of data included within the ToxPi analysis. Having missing data or very small number of slices (eg. two or three) may affect the stability of ToxPi and what the slices imply. Furthermore, only bioassay data was included in the overall ToxPi analysis. Including another slice to describe chemical properties of each chemical such as logP values which describes the lipophilicity of a chemical would improve the accuracy of the ToxPi analysis for the overall biological processes ranking. Inclusion of logP values may have revealed additional novel findings in term of activity based on the assumption that similar molecular have similar activities. ToxPi analysis that included logP values was conducted however, some chemicals did not have a logP value recorded and therefore skewed the data. Since some chemicals did not have logP values and there was not another type of data source available which can also represent chemical properties, logP values were excluded in the analysis.
The statistically significant association found between the ToxPi rankings and the SPL rankings raised suspicion as to what type of relationships were found among the chemical rankings and biological processes. To assess the relationship between the ranks and biological processes among the chemicals, a heatmap was created to visualize the chemical rankings and hierarchical clustering analysis using a complete linkage method was applied to find similar clusters in the heatmap generated using R (v.3.2.4). (Figure 2, Figure 3). The clustering revealed three distinct groups (group 1, group 2, and group 3) where a majority of chemicals with high activity were clustered together (group 1), chemicals with moderate bioactivity grouped together (group 2), and mostly chemicals with low bioactivity were grouped together (group 3) (Figure 3). Across each biological process, the chemicals in the same group shared similar biological perturbations. This was an interesting pattern which suggested that the chemicals may share similar chemical structures or classifications (Figure 5, Figure 6, Figure 7). Figure 5-7 revealed that a majority of the chemicals found in each group shared relatively similar chemical use purposes. Although the absolute ranks differ
between ToxPi and SPL dramatically, the results suggest there is some association found between the two. Group 1, which contained the most active chemicals also contained the top 10% bioactive chemicals. Based on the chemical use count distribution, we found the major chemical use category was insecticides for both Group 1 overall as well as within the top 10% bioactive chemicals (Figure 5, Table 3). In group 2, the major chemical use category distribution widened but included insecticides and herbicides (Figure 6, Table 4). Finally, in group 3 which contained the least active chemicals did not contain many chemical uses as seen in group 1. Group 3 predominately contained reactants, solvents, and intermediates (Figure 7, Table 5). The results from the chemical use categories is very interesting. Using this information can help inform doctors as well as risk assesses identify populations at risk of exposure. By identifying that an individual comes from an agricultural community that frequently uses certain types of pesticides or insecticides, doctors can screen for the most active chemicals to help with diagnosing disease and identifying disease pathologies.
After identifying that there was a trend among the chemicals, we wanted to identify if the top 10 ranking chemicals had any significant biological relevance. There are many potential avenues to discuss the biological relevancies for each chemical gene list and their associated diseases. One example could be broadly focused around cardiovascular diseases or specifically hypertension. Besides the known risk factors associated with hypertension, few studies have suggested that exposure to environmental toxicants may increase the risk of hypertension. Some studies suggested that exposure to organic pollutants led to a positive but not statistically significant association to hypertension (Ha et al. 2009; Lind et al. 2014). Other studies showed that there was a positive association between hypertension and polychlorinated biphenyls (PCBs) while exposure to organochlorine pesticides showed varying associations (Valera et al. 2013). A meta-analysis study which examined the association between exposure to persistent organic pollutants (POPs) and hypertension found that exposure to both non-dioxin-like polychlorinated biphenyls (PCBs), and dioxin-like PCBs as well as organochlorine pesticides such as chlordane showed increased risk of hypertension but suggested that the concentration of the environmental toxicant was associated with the risk of hypertension (Park et al. 2016). While the association between exposure to environmental toxicants such as pesticides and the risk for hypertension remains controversial, the results of this study suggests the top ranking chemicals, many of which are pesticides, affect genes associated with hypertension (p<0.01). Surprisingly, the top ranking chemical, chlordane, did not show a statistically significant association (p<0.01) with the genes associated with hypertension while a similar compound, heptachlor, did show a statistically significant association. The CTD showed that heptachlor and chlordane share n=21 common interacting genes which makes the results more puzzling. However,
using a larger p-value threshold shows that the association between hypertension and chlordane’s gene list is statistically significant (p<0.05).
While the extent of this study examined the cumulative biological effects, preliminary ToxPi analysis examining the effects of chemicals on intended target families within each biological processes was performed and was found to be unstable due to the low number of slices. Further in-depth analysis of these chemicals and their intended target families should be conducted to establish adverse outcome pathways (AOP) for health diseases using an in silico approach. Overall, this study revealed a unique approach to: identify and visualize bioassay response trends within and between chemicals, categorize chemicals based on chemical use which showed the majority of pesticides found on Superfund sites being the most toxic and bioactive across each biological process, index a diverse selection of chemicals based on their propensity to disrupt biological processes which was shown to be statistically significant when compared to the SPL rankings, and found several statistically significant gene-disease associations related to the top 10 ranking chemicals which opens the possibilities to explore various disease pathways. With data based mainly on high-throughput screening, we may not be able to replicate the actual responses in a human system.
However, we can strive to examine the underlying mechanisms resulting in the patterns we observed by identifying genes for gene-pathway mapping, incorporating pathway perturbation scores in ToxPi, including additional parameters in our ToxPi models to provide a more accurate representation of the chemicals, and identifying predictive chemical signatures for adverse outcome pathways (AOP) which would contribute to the growing field of computational toxicology.
References:
Judson, R., Houck, K., Martin, M., Knudsen, T., Thomas, R. S., Sipes, N., Shah, I., Wambaugh, J., Crofton, K.
(2010) In Vitro and Modelling Approaches to Risk Assessment from the U.S. Environmental Protection Agency ToxCast Programme. Basic and Clinical Pharmacology & Toxicology 115(1), 1742-7843, 10.1111/bcpt.12239
Reif, D. M., Martin, M. T., Tan, S. W., Houck, K. A., Judson, R. S., Richard, A. M., . . . Kavlock, R. J. (2010).
Endocrine profiling and prioritization of environmental chemicals using ToxCast data. Environmental Health Perspectives, 118(12), 1714-20. Retrieved from
http://search.proquest.com/docview/821701356?accountid=14244
Park, S.H., Lim, J., Park, H. et al. (2016) Body burden of persistent organic pollutants on hypertension: a meta-analysis. Environmental Science and Pollution Research, 23(14), 14284-14293.
Ha MH, Lee DH, Son HK, Jacobs DR Jr (2009) Association between serum concentrations of persistent organic pollutants and prevalence of newly diagnosed hypertension: results from the National Health and Nutrition Examination Survey 1999–2002. J Hum Hypertens 23(4):274–286
Lind PM, Penell J, Salihovic S, van Bavel B, Lind L (2014) Circulating levels of p, p’-DDE are related to prevalent hypertension in the elderly. Environ Res 129:27–31
Valera B, Ayotte P, Poirier P, Dewailly E (2013) Associations between plasma persistent organic pollutant levels and blood pressure in Inuit adults from Nunavik. Environ Int 59:282–289
Valera B, Jørgensen ME, Jeppesen C, Bjerregaard P (2013) Exposure to persistent organic pollutants and risk of hypertension among Inuit from Greenland. Environ Res 122:65–73
Ogata H, Goto S, Sato K, Fujibuchi W, Bono H, Kanehisa M. (1999) KEGG: Kyoto Encyclopedia of Genes and Genomes. Nucleic Acids Res 27(1): 29-34
Inglese J, Johnson RL, Simeonov A, Xia M, Zheng W, Austin CP, et al. 2007. High-throughput screening assays for the identification of chemical probes. Nat Chem Biol 3(8): 466-479.
LeCluyse EL, Alexandre E, Hamilton GA, Viollon-Abradie C, Coon DJ, Jolley S, et al. 2005. Isolation and culture of primary human hepatocytes. Methods Mol Biol 290: 207-229
Martin MT, Dix DJ, Judson RS, Kavlock RJ, Reif DM, Richard AM, et al. 2010. Impact of environmental chemicals on key transcription regulators and correlation to toxicity end points within EPA’s ToxCast program. Chem Res Toxicol 23(3): 578-590.
Romanov S, Mendev A, Gambarian M, Poltoratskaya N, Moeser M, Medevdeva L, et al. 2008. Homogenous reporter system enables quantitative functional assessment of multiple transcription factors. Nat Methods 5(3): 253-260.
R Foundation for Statistical Computing. 2016. The R Project for Statistical Computing
Figure 1 Interpreting ToxPi Results
Figure 2 Heatmap of ToxPi Chemical Rankings (rows) and Biological Processes (columns)
CASRN Chemical Name Chemical Use Categories
133-06-2 * Captan fungicide
57-74-9 * Chlordane insecticide
88-85-7 * Dinoseb herbicide
76-44-8 * Heptachlor insecticide
7487-94-7 * Mercuric chloride bactericide
300-76-5 * Naled insecticide
789-02-6 * o,p'-DDT insecticide
72-54-8 * p,p'-DDD insecticide
1401-55-4 * Tannic acid natural
137-26-8 * Thiram fungicide
95-95-4 ¥ 2,4,5-Trichlorophenol fungicide
534-52-1 ¥ 2-Methyl-4,6-dinitrophenol insecticide
309-00-2 ¥ Aldrin insecticide
80-05-7 ¥ Bisphenol A plasticizer
510-15-6 ¥ Chlorobenzilate insecticide
143-50-0 ¥ Kepone insecticide
72-43-5 ¥ Methoxychlor insecticide
72-55-9 ¥ p,p'-DDE degradate
50-29-3 ¥ p,p'-DDT insecticide
87-86-5 ¥ Pentachlorophenol wood preservative
78-42-2 ¥ Tris(2-ethylhexyl) phosphate flame retardant, plasticizer
1024-57-3 ¥Heptachlor epoxide degradate
Table 1 Top 10% Bioactive Chemicals-Chemical Use Categories; "*" represents chemicals ranked in top 10; "¥" represent chemicals ranked 11-22
Figure 3 Hierarchical Clustering of Chemicals; Hierarchical clustering overlapped with heatmap (top); Hierarchical clustering with 3 identified clusters (bottom)
Figure 4 Overall Chemical Use Count Distribution
Chemical Use Categories # of chemicals
solvent 43
intermediate 43
reactant 42
insecticide 42
herbicide 28
flavor 13
plasticizer 13
natural 12
precursor 10
fungicide 8
Table 2 Overall Chemical Use Count Distribution
Figure 5 Group 1 Chemical Use Distribution; highest chemical use frequency highlighted with red arrow
Chemical Use Categories Total Group 1 % in Group 1
insecticide 42 31 73.80952
herbicide 28 10 35.71429
intermediate 43 7 16.27907
plasticizer 13 5 38.46154
natural 12 5 41.66667
fungicide 8 5 62.5
degradate 4 4 100
coal tar product 7 3 42.85714
reactant 42 2 4.761905
emulsifier 2 2 100
unassigned 2 2 100
pharmaceutical 5 1 20
antioxidant 5 1 25
flame retardant 4 1 33.33333
Table 3 Group 1 Chemical Use Count Distribution; highest frequency chemical use group highlighted in red box
Figure 6 Group 2 Chemical Use Distribution; major chemical use categories indicated by red arrow
Chemical Use Categories Total Group 2 % in Group 2
solvent 43 20 46.51163
intermediate 43 17 39.53488
reactant 42 15 35.71429
herbicide 28 14 50
insecticide 42 10 23.80952
precursor 10 5 50
fragrance 7 4 57.14286
industrial 5 4 80
plasticizer 13 3 23.07692
flavor 13 3 60
antioxidant 5 3 23.07692
pesticide other 3 3 100
fungicide 8 2 25
fumigant 3 2 66.66667
Table 4 Group 2 Chemical Use Count Distribution; major chemical use categories indicated by red box
Figure 7 Group 3 Chemical Use Distribution; major chemical use categories indicated by red arrow
Chemical Use Categories Total Group 3 % in Group 3
reactant 42 25 59.523
solvent 43 23 53.488
intermediate 43 19 44.186
flavor 13 10 76.923
precursor 10 5 50
plasticizer 13 5 38.461
natural 12 5 41.667
herbicide 28 4 14.286
fragrance 7 3 42.857
coal tar product 7 3 42.857
pharmaceutical 5 3 60
flame retardant 4 2 50
disinfectant 3 2 66.667
insecticide 42 1 2.381
industrial 5 1 20
antioxidant 5 1 20
fungicide 8 1 12.5
Table 5 Group 3 Chemical Use Count Distribution; major chemical use categories indicated by red box
Figure 8 Top 10 Ranking Chemicals and their ToxPi profiles; A-J: chlordane, thiram, heptachlor, p,p’-DDD, mercuric chloride, dinoseb, o,p’-DDT, captan, and tannic acid
Figure 9 ToxPi Chemical Ranking vs. SPL Ranking
Regression Statistics
R Square 0.1405381
P-value 1.468E-9
Table 6 Linear Regression Statistics for ToxPi Chemical Rankings vs. SPL Ranking (Figure 9)
Chlordane (n=19)
Thiram (n=34) Heptachlor (n=19)
p,p’-DDD (n=45)
Mercuric chloride (n=73)
o,p’-DDT (n=42)
Captan (n=6) Naled (n=4)
Disease Name
Infertility, Female
Pathological Conditions,
Infertility, Female
Pathological Conditions,
Cardiovascular Diseases
Pathologic Processes
Hypertrophy Carcinoma
0 100 200 300 400 500 600 700 800 900
0 50 100 150 200 250 300
SPL Rank
ToxPi Rank
ToxPi Rank vs. SPL Rank
Signs and Symptoms
Signs and Symptoms
Disease ID MESH:D007247 MESH:D013568 MESH:D007247 MESH:D013568 MESH:D002318 MESH:D010335 MESH:D006984 MESH:D002277
Disease Categories
Urogenital disease (female)
Urogenital disease (female)
Cardiovascular disease
Pathology (process)
Pathology (anatomical condition)
Cancer
P-value 1.10E-18 3.72E-28 8.01E-22 1.49E-35 7.95E-61 1.03E-34 9.16E-10 2.00E-07
Corrected P-value
4.82E-16 3.15E-25 4.93E-19 1.31E-32 8.07E-58 8.50E-32 2.66E-07 5.16E-05
Annotated Genes Quantity
7 27 8 35 51 29 4 4
Genome Frequency
27/41269 genes:
0.07%
2285/41269 genes: 5.54%
27/41269 genes:
0.07%
2285/41269 genes: 5.54%
1231/41269 genes: 2.98%
1245/41269 genes: 3.02%
117/41269 genes: 0.28%
874/41269 genes: 2.12%
Table 7 Gene-Disease Associations for top 10 ranking chemical based on lowest p-value; total number of overlapping gene interactions for each chemical in parenthesis below chemical name