Comparing rail passengers’ travel time use in Great Britain
between 2004 and 2010
Professor Glenn Lyons
Professor of Transport and Society
Centre for Transport & Society, University of the West of England, Bristol (UWE)
Dr Juliet Jain
Senior Research Fellow
Centre for Transport & Society, University of the West of England, Bristol (UWE)
Dr Yusak Susilo Assistant Professor
Royal Institute of Technology (KTH), Stockholm, Sweden
Professor Steve Atkins Visiting Professor
Centre for Transport & Society, University of the West of England, Bristol (UWE)
Abstract
This paper makes a contribution to the growing discourse and evidence base concerning travel time use, its meaning and value. In particular it provides a unique insight into aspects of stability and change regarding the travel time use of rail passengers in Great Britain between 2004 and 2010. Empirical evidence is presented on how rail passengers spend their time, how worthwhile they consider their time use to be, the extent of advance planning of their time use and how equipped for time use they are in terms of the items they have to hand when they travel. The results reveal a consistent dominance of reading for leisure, window gazing and working/studying as favoured travel time activities. Over the six year period the availability and use of mobile technologies has increased. Listening to music in particular has doubled in its incidence suggesting an increasing capacity for travellers to personalise the public space of the railway carriage. Most notably the analysis reveals a substantial increase in the proportion of travellers overall making very worthwhile use of their time. The paper relates such survey findings to the ongoing debate concerning how travel time savings are valued in preparing advice on transport investment decisions – currently pertinent in the UK in terms of high speed rail.
1 Introduction
For many years orthodox thinking in transport planning has identified travel as simply a means to an end; it represents the disutility of time spent to access and participate in activities at alternative spatial locations. Slower journeys are seen to reflect a greater cost to the individuals concerned and to society. Accordingly, investment in transport infrastructure and services has been justified largely by the prospect of making journeys quicker and ‘recovering’ wasted travel time such that it can be put to more economically or socially productive use. However, a growing body of research has been exploring the notion that travel is more than a means to an end and in fact can be an end in itself with the prospect of positive utility derived from how travel time is used (Mokhtarian and Salomon, 2001).
have emerged and Russell (2011) compares such studies in her examination of the design of structured observation studies of travel time use.
While there continues to be a need for greater understanding of travel time use and its meaning and value, there is also a need for insight into how behaviour is changing (or not) over time. Recent inventions and innovations in portable communication devices have provided individuals with various new ways of spending time whilst travelling. This paper provides a unique opportunity to examine change over time. The authors secured inclusion of a subset of the questions originally asked in the Autumn 2004 NRPS in the Autumn 2010 Survey wave. The paper thus provides evidence into how travel time use has changed (or not) over a six year period. This work delivers new empirical findings at a time when serious attention is being given by the UK Government to multi-billion pound investment in high speed rail. The economic case for such investment has had to confront the challenge to orthodox thinking in terms of how rail travel time savings can be valued in the context of (some) passengers making productive use of (some of) their time (DfT, 2011a).
The next section of the paper provides a selective review of key insights into travel time use and its meaning and value to set a context for the new empirical data.
2 Insights into the significance, meaning and value of travel time use
2.1 Enacting and experiencing travel time
Mokhtarian and Salomon have identified three means by which positive utility can be derived from travel: “1. the activities conducted at the destination; 2. activities that can be conducted while travelling; 3. the activity of travelling itself” (Mokhtarian and Salomon, 2001: 701). This underlines the need to recognise that travel itself has constructive meaning in people’s lives beyond being a means to an end. Jain and Lyons (2008) introduced the notion of the gift of travel time. They argued that “time is an inherent and unavoidable gift to co-presence from which we expect some reciprocation through the benefits associated with belonging to, and participating in, a social network” (Jain and Lyons, 2008: 81). In other words an individual shows commitment to others through the time devoted to travelling to be with them. They went on to note that travel time can be a gift to oneself, providing two important meanings: “1. Transition time – a need for experiencing distance and the opportunity for gearing up to the destination’s demands; and 2. Time out – escape from the obligations created through co-presence or fixed space that enable time for a ‘backstage’ time to be oneself or a specific activity (e.g. reading)” (Jain and Lyons, 2008: 85). Watts (2008) discusses the important distinction between clock time and experienced time and explains how travel time can be stretched or compressed according to the individual’s state of mind and activity engagement. ‘Compressing’ the experienced journey time may appear attractive but not everyone wants their journey to be instantaneous. Research testing the appeal of the notion of teleportation (Mokhtarian and Salomon, 2001; Jain and Lyons, 2008) reveals a desire amongst travellers for a travel time in excess of zero, in fact around 15-20 minutes for commuting – underlining notions of the gift and positive utility (or less negative utility) of travel time.
Watts (2008) has highlighted through ethnographic research the need to recognise that a passenger comprises the person plus their belongings, and points to the distinction between the packed and unpacked passenger. Watts and Lyons (2010) designed and applied what they referred to as a ‘travel remedy kit’ which illustrated how, with conscious consideration of travel time in advance of the journey, an individual could equip themselves both in terms of state of mind and in terms of carried objects to improve their journey experience. Bissell (2008) considers the physical and emotional state of creating comfort when travelling. He utilises the notion of crafting to argue that comfort is a state that has to be achieved through a compromised arrangement between the fixed setting of the carriage and the artefacts unpacked by the passenger.
suggest that “for many commute journeys, cognitive and affective effort will be low - the routine and familiarity allow the individual to enact the journey almost subconsciously or on ‘auto-pilot’ (even in the face of congestion)”. It seems reasonable to infer that less effort devoted to travel itself yields more potential opportunity for fruitful travel time use.
Listening through headphones on the move is very much a late twentieth century phenomena, which has been radically transformed with digital media and the MP3 player (either as a specific technology such as the iPod, or embedded into other mobile technologies, e.g. mobile phones) in the twenty-first century. The MP3 format has simplified and expanded the opportunity to listen to something anywhere (Simun, 2009). MP3 use (and that of the preceding Walkman) enables control over the mobile experience, and elevates the individual out of the mundane into personal and private experiences (Simun, 2009; Bull, 2000). Skånland (2011) considers the use of MP3 as a ‘coping strategy’ in crowded and noisy contexts that benefits individual wellbeing by reducing stress. She suggests that music is often used as a focus to remove the individual from other worrying thoughts or negative feelings or experiences; thus enabling commuters to over-ride the stress of being physically proximate to other travellers (and associated conversation/phone noise) creating a psychological distance and making the journey more pleasurable. It appears that music interplays with the concept of time out, raised earlier, in facilitating individual withdrawal from the immediate situation. In one respect, donning headphones is little different than the practice of hiding behind a newspaper or book, which Schivelbusch (1980) proposes enabled travellers to manage personal space in crowded situations. Is it possible that the MP3 has reduced the need for having a newspaper as such a device on the train?
2.2 Measuring and valuing travel time
Many of the concepts above point towards the nature, meaning and significance of travel time use. It is important to offer a reminder that travel time experience varies from person to person and from trip to trip – some is positive, some is negative (Lyons and Urry, 2005). However, the UK approach to economic appraisal of transport investment – a method that has applied since the 1960s - assumes that travel during the course of the working day represents unproductive (‘wasted’) time which is a cost to the economy. Meanwhile travel time outside the working day is a ‘cost’ to the individual and individuals are willing to pay for quicker journeys. In both cases, savings in travel time amount to economic benefits. Such benefits frequently represent the majority of the total benefits deemed to accrue from a transport investment and hence determine whether the resultant benefit to cost ratio is able to justify a decision to invest. Criticism of this approach for its apparent oversight of the positive utility of travel has been longstanding. However deliberations that have ensued to address such criticism are complex and in some respects unresolved, due, to a significant extent, to the problems of measuring time use and its value. There is not space within this paper to offer a full background to these issues though this can be found across a number of existing articles (Wardman, 1998; Fowkes, 2001; Mackie et al, 2003; Lyons, 2006; Lyons et al, 2007; Fickling et al, 2008; DfT, 2011b). This matter is returned to in our conclusions.
With such insights as background we now turn to introduce the survey that has provided the data for this paper’s own empirical examination of travel time use.
3 National Passenger Survey (NPS)
Figure 1. NPS travel time use questions - 36 and 37 (with modification since 2004 highlighted)
Figure 2. NPS travel time use questions - 38 and 39 (with modification since 2004 highlighted)
The result of this is that the 2004 sample of 26,221 has reduced to 22,866; and the 2010 sample of 27,556 has reduced to 19,715. Examination of the effect of the steps above on distribution of responses to given questions finds that the level of non-response and our subsequent remedial steps have not biased the data. The data remain weighted by Train Operating Company, journey purpose and weekday/weekend. All subsequent reporting of results and percentages are based on the resulting samples produced above.
4 Survey findings – how travel time is used
4.1 Consistency between 2004 and 2010
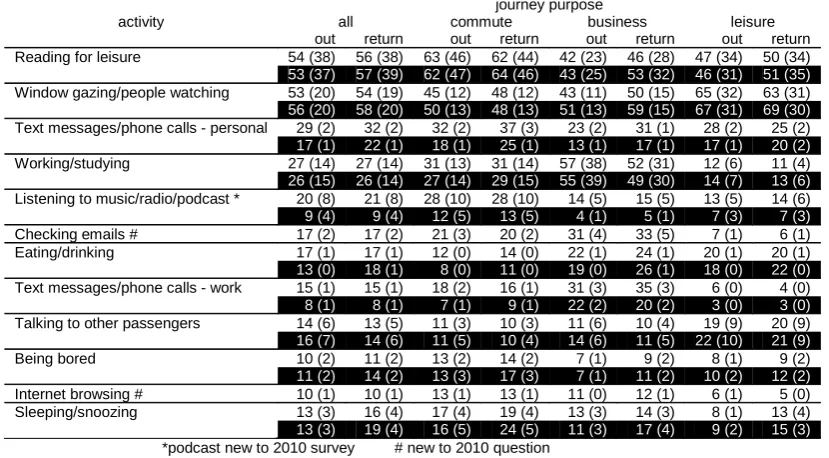
Table 1 reveals notable consistency between 2004 and 2010 in terms of the relative overall proportions of people reading for leisure, window gazing, working/studying, talking to other passengers, sleeping/snoozing, being bored and eating/drinking. Such activities (with the exception of one’s means of working/studying) are able to be independent of technological development so such stability over six years seems appropriate. Meanwhile, the technology-dependent activities – text messages/phone calls and listening to music/radio/podcast – have all increased in their extent of occurrence over the six year period.
4.2 Popular activities
[image:5.595.113.528.453.682.2]Reading for leisure and window gazing together represent the activities that the majority of all passengers spend most of their time engaging in on the train. Reading for leisure is the most commonly undertaken activity overall. The majority of commuters (over 60%) do this for part of their journey and over 40% do this as their main activity. Leisure travellers are less likely to read for leisure (around half spend some of their journey doing so) and business travellers least of all but even here around a quarter have this as the activity they spend most time on. Window gazing as an activity undertaken some of the time has seen a modest reduction between 2004 and 2010, perhaps reflecting the growing functional repertoire embodied in people’s carried artefacts that now divert the traveller’s gaze.
Table 1. Comparison for 2010, by journey purpose and direction of travel, of the percent of travellers undertaking activities for some time during the train journey and (shown in brackets) for most of the time; shaded rows show 2004 results – only activities undertaken by at least 10% of respondents are shown
The third most common activity engaged in concerns personal text messages/phone calls. However, this is not the case in terms of an activity that people spend most time on in their journeys (2% of all travellers). The third most common activity passengers spend most time on in their journeys is working/studying – 14% of all passengers. This shows almost no change over the six years from 2004. Over half of all business travellers spend some time working/studying on the train and around a third have this as the activity they spend most time on. In fact other activity response categories also (probably) reflect working/studying.
journey purpose
activity all commute business leisure
out return out return out return out return Reading for leisure 54 (38) 56 (38) 63 (46) 62 (44) 42 (23) 46 (28) 47 (34) 50 (34)
53 (37) 57 (39) 62 (47) 64 (46) 43 (25) 53 (32) 46 (31) 51 (35)
Window gazing/people watching 53 (20) 54 (19) 45 (12) 48 (12) 43 (11) 50 (15) 65 (32) 63 (31)
56 (20) 58 (20) 50 (13) 48 (13) 51 (13) 59 (15) 67 (31) 69 (30)
Text messages/phone calls - personal 29 (2) 32 (2) 32 (2) 37 (3) 23 (2) 31 (1) 28 (2) 25 (2)
17 (1) 22 (1) 18 (1) 25 (1) 13 (1) 17 (1) 17 (1) 20 (2)
Working/studying 27 (14) 27 (14) 31 (13) 31 (14) 57 (38) 52 (31) 12 (6) 11 (4)
26 (15) 26 (14) 27 (14) 29 (15) 55 (39) 49 (30) 14 (7) 13 (6)
Listening to music/radio/podcast * 20 (8) 21 (8) 28 (10) 28 (10) 14 (5) 15 (5) 13 (5) 14 (6)
9 (4) 9 (4) 12 (5) 13 (5) 4 (1) 5 (1) 7 (3) 7 (3)
Checking emails # 17 (2) 17 (2) 21 (3) 20 (2) 31 (4) 33 (5) 7 (1) 6 (1) Eating/drinking 17 (1) 17 (1) 12 (0) 14 (0) 22 (1) 24 (1) 20 (1) 20 (1)
13 (0) 18 (1) 8 (0) 11 (0) 19 (0) 26 (1) 18 (0) 22 (0)
Text messages/phone calls - work 15 (1) 15 (1) 18 (2) 16 (1) 31 (3) 35 (3) 6 (0) 4 (0)
8 (1) 8 (1) 7 (1) 9 (1) 22 (2) 20 (2) 3 (0) 3 (0)
Talking to other passengers 14 (6) 13 (5) 11 (3) 10 (3) 11 (6) 10 (4) 19 (9) 20 (9)
16 (7) 14 (6) 11 (5) 10 (4) 14 (6) 11 (5) 22 (10) 21 (9)
Being bored 10 (2) 11 (2) 13 (2) 14 (2) 7 (1) 9 (2) 8 (1) 9 (2)
11 (2) 14 (2) 13 (3) 17 (3) 7 (1) 11 (2) 10 (2) 12 (2)
Internet browsing # 10 (1) 10 (1) 13 (1) 13 (1) 11 (0) 12 (1) 6 (1) 5 (0) Sleeping/snoozing 13 (3) 16 (4) 17 (4) 19 (4) 13 (3) 14 (3) 8 (1) 13 (4)
13 (3) 19 (4) 16 (5) 24 (5) 11 (3) 17 (4) 9 (2) 15 (3)
Nearly 8% of business travellers indicate spending most time on either checking email (4-5%) or work texting/phoning (3%) – this suggests that the proportion of people working as their main activity may be increasing (albeit that ‘checking email’ was not an available response category in 2004) – a finding in line with Fickling et al (2008).
4.3 The march of the information age in six years and the growing role of sound
There have been notable changes between 2004 and 2010 in the use of information and communications technologies (ICTs). Not identified as specific activity categories in 2004, internet browsing and checking emails are prevalent in 2010 with 1 in 5 commuters and nearly 1 in 3 business travellers now doing the latter (1 in 20 passengers overall are also accessing social networking sites). Text messaging and making phone calls is still not something that occupies many passengers as the activity they spend most time on - probably reflective typically of the relative short duration of such activity. In terms of a time use for at least part of a train journey then such communication has grown – passengers in 2010 are 63% more likely to be texting or phoning for personal reasons and 83% more likely to be doing so for work. It is clear that technology is permeating or ‘infecting’ the carriage environment as people increasingly communicate external to this (though in the case of email the balance between online or offline checking while on the train is not known).
There has been a marked change in the proportions of people listening to music/radio/(podcast) – a doubling overall in six years (1 in 5 now do so for some of the time and for 8% it is now the activity they spend most time on – compared to 4% in 2004). This has doubtless been facilitated by the increasingly available and portable nature of music-playing technology, perhaps allied to the growth of music downloads and the ease of assembling mobile personal music collections. It may also reflect a change in social acceptability of this practice and better earphone technology reducing or eliminating annoyance for other passengers. This activity has clear prospect for being a backdrop activity for other time uses - serving (as discussed earlier in Section 2) as an aid in ‘personalising public space’ from an acoustic point of view (and potentially discouraging interaction with other passengers). Talking to other passengers has decreased a little over six years but multi-tasking is not able to be measured in the survey (see Kenyon and Lyons (2007) for an examination of multitasking in relation to travel and use of ICTs).
4.4 Boredom still has its place, just
The results remind us that there is still space for boredom in train travel, in spite of the myriad of potential (technologically enabled) activities to engage in. That said nearly 90% of passenger give no indication of encountering any boredom on their journeys and less than 2% spend most of their time being bored.
4.5 Directions of travel
There is little difference in the overall pattern of activity engagement between outbound and return journeys. Those differences that are apparent tend to concern business travellers. Compared to their outbound journeys, business travellers on their return journeys are more likely to be reading for leisure, window gazing and using their phones for personal reasons; and less likely to be working or studying. This perhaps reflects a switch in (perceived) ownership of time from employer (outbound) to employee (return).
4.6 Class of travel
We can conclude little robustly regarding the effect of class of travel given the small percentage (2% and 3% in 2010 and 2004 respectively) who travel first class. It should be noted that while in 2004 38% of first class travellers were commuters this has reduced to 23% in 2010 with a corresponding increase in the proportion of leisure travellers who now comprise first class passengers (42% in 2010 compared to 23% in 2004). In line with this, there is some reduction between 2004 and 2010 in the proportion of first class travellers who spend most time working/studying. First class travellers are twice as likely in 2010 (27%) to spend most time on this activity compared to standard class travellers (13%).
4.7 Gender and travel time use
Men are more likely than women to spend some of their travel time: working/studying (32% versus 24%); texting/phoning for work (18% versus 12%); checking emails (21% versus 14%); internet browsing (12% versus 8%); and playing games (5% versus 3%). Meanwhile women are more likely than men to spend some of their travel time: talking to other passengers (15% versus 12%); and personal texting/phoning (35% versus 25%). Such gender distinctions apply for commuting and, broadly but less so, for leisure travel. There is also some consistency in this for business travel however here there is greater similarity between genders in terms of the likelihood of working/studying.
4.8 The influence of journey duration
The pattern of activities most time is spent on according to journey duration has remained broadly similar between 2004 and 2010, notwithstanding overall increases. However, for listening to music/radio/(podcast) there is now a more noticeable increase in this being the main activity as journey duration decreases suggesting that the portability and usability of music on the move has improved (alongside social acceptability perhaps). It continues to be the case in 2010 that when journey durations drop below 30 minutes, and more so again below 15 minutes, the likelihood of window gazing as the main activity increases. For working/studying, consistent with the finding in 2004, the optimal journey duration for this activity to be most prominent is 1-3 hours.
5 Survey findings – how worthwhile is rail travel time use?
[image:7.595.160.479.463.547.2]Table 2 shows how passengers judge the degree to which their travel time is worthwhile. Overall the proportion of people considering their time wasted has gone down by nearly a third in six years from 19% to 13% of all passengers. Correspondingly the proportion of people making very worthwhile use of their time has gone up by a quarter – from 24% to 30%. These results are good news for the marketing departments of train operators. In terms of proportional changes over the six years, leisure travellers have seen the greatest change in terms of making very worthwhile use of their time – 36% more leisure travellers indicating this in 2010 compared to 2004. There has been a 37% reduction over six years in the proportion of business travellers indicating that their time on the train was wasted.
Table 2. “Thinking about the time you spent on the train from XXX station, which one of the following statements do you most agree with?” (percent of respondents selecting each statement in 2010; equivalent figure for 2004 shown in brackets)
There is a strong overall message here that worthwhile use of rail travel time has increased over the six year period. This may in part reflect how rail service provision is perceived to have changed over this time. Corresponding to (though with no evidence it is necessarily related to) the increase in travellers who considered their time use had been very worthwhile, the proportion of travellers who were very/fairly satisfied with the punctuality/reliability of their train has grown by 15% (from 71% to 82%) and the proportion of travellers who rated the train very good or good in terms of there being sufficient room for all the passengers to sit/stand has also grown by 15% (from 59% to 68%). Thus it would appear overall that improvement in service provision is accompanied by an improvement in worthwhile time use. The greater proportional increase in worthwhile time use may relate to improvement in terms of how individuals are equipping themselves for travel (see later).
When considering how ‘time worth’ of a journey overall relates to the activities engaged in, the following most highly rated activities are drawn out. For those individuals who work/study as the single activity they devote most time to 46% of them consider their time use on the train very worthwhile. The corresponding figures for other well-rated activities are as follows: text messages/phone calls (work) - 42%; checking emails - 39%; eating/drinking - 38%; and reading for leisure - 34%.
statement most agreed with all commute business leisure I made very worthwhile use of
my time on this train today
30 (24) 27 (23) 34 (28) 32 (23)
I made some use of my time on this train today
55 (55) 55 (53) 57 (58) 53 (55)
my time spent on this train today is ‘wasted time
13 (19) 16 (23) 8 (13) 12 (17)
In terms of the thing people spend most time doing, three activities account for 71% of all journeys – reading for leisure, window gazing and working/studying. For all three of these there are substantial increases in six years in the proportion who consider their time spent to have been very worthwhile. Few passengers who spend most time reading for leisure or working/studying consider their time to have been wasted. Across the three activities, leisure travellers are most likely to consider their time use very worthwhile – twice as likely as commuters for window gazing and even higher than business travellers for working or studying. Perhaps this reflects the relaxed state of mind surrounding a journey for leisure.
Three activities (window gazing, listening to music/radio/podcast and sleeping/snoozing) produce polarised subjective views from travellers overall with around a fifth seeing their time as very worthwhile and another fifth seeing their time as wasted. This is a reminder that the same activity can have different appeal to different individuals and indeed the same individual for different journeys. Simply knowing what people are doing is not enough.
In 2010 as in 2004, a greater proportion of first class travellers considered they had made very worthwhile use of their time compared to standard class travellers – 44% compared to 30% (33% compared to 24% in 2004). In 2004, the proportion of people who considered they had made very worthwhile use of their time increased through the age bands. This was similar in 2010 but with more consistency for those aged 35 and above. 18% of 16-25 year olds considered their time use to have been very worthwhile in 2010 compared to 25% of 26-34 year olds and 31% of 35-44 year olds.
6 Survey findings – the support of travel time use
6.1 Advance planning
Table 3 shows the extent of planning in advance for how to use the time on the train. An important revision to the response options was made in 2010 with the inclusion of ‘very little as I always use my journey time the same way’. This has clearly proved significant. It underlines that for the majority of commuters (72%) very little or no advance planning of time use takes places largely on the basis that this is a regular/routine part of their lives for which established practices exist. The extent of planning in advance is very similar between males and females. First class travellers are twice as likely to plan in advance compared to standard class travellers.
[image:8.595.75.478.517.579.2]Table 3. “To what extent had you planned in advance how you would spend the time on this train?” (percent of respondents equivalent figure for 2004 shown in brackets)
Table 4 goes on to highlight how advance planning relates to the assessment of time worth. Individuals who have planned a lot in advance are three times more likely to consider their time use very worthwhile compared to those who have not planned at all and seven times less likely to consider their time has been wasted. Comparable observations applied for 2004 – planning in advance improves the prospects of getting more out of one’s journey. Intriguingly, those for whom the journey experience is familiar, i.e. they know what to expect as they always use their journey time in the same way (and who we have earlier suggested would have lower cognitive and affective effort relating to making the journey itself), are half as likely to make very worthwhile use of their time compared to those who plan a lot in advance and four times more likely to consider their time is wasted. Especially for (daily) commuters it might be expected that a much higher proportion than 27% of these would be indicating that they had made very worthwhile use of their time given that nearly half of commuters are indicating they have established practices of travel time use. Factors at work here could include established practices being ‘OK’ for passing time or even appreciated as welcome ‘down time’ or ‘me time’ but not judged as very worthwhile. It might also be that
Planning in advance all commute business leisure
A lot 8 (11) 8 (11) 14 (19) 6 (7)
A little 23 (36) 19 (36) 35 (45) 23 (32)
Very little as I always use my journey time the same way* 38 49 25 29
Not at all 30 (42) 23 (45) 26 (30) 40 (42)
Not stated / not applicable (2004 response options) 1 (12) 1 (8) 1 (5) 1 (19)
formed habits and satisficing behaviour obstruct the reviewing of and revising established practices in a way that could get more out of the time on the train. Work by Watts and Lyons (2010) has highlighted how routine travel experience can be ‘remedied’ by reviewing and revising how a traveller is equipped and their state of mind in approaching the journey.
Table 4. Assessment of time worth according to extent of advance planning – 2010 results
It seems reasonable to suggest that the overall amount of rail travel in an individual’s daily life could also affect how ‘worthwhile’ time on any given train journey is considered to be. The train environment may be well suited to certain time uses but if there is more rail travel time in a person’s life than they need or desire for such uses then the appeal of rail travel time may diminish. For example, one may relish being able to read on the train once or twice a week, but if one has a daily two-hour train commute then 10 hours reading a week may be more than is wanted! Meanwhile, individuals who plan a lot in advance may be seeking to make the most of a less frequent opportunity for some time out and accordingly get more out of that time when on the train.
6.2 Equipped travel and the newspaper puzzle
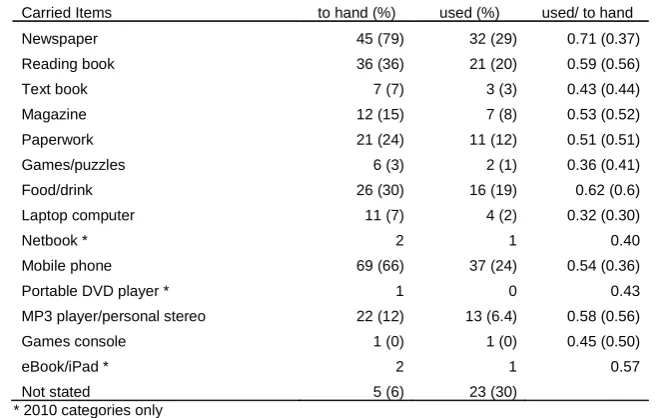
[image:9.595.142.472.476.685.2]Table 5 compares the extent to which items were both to hand and used between 2004 and 2010. The following items show little difference over 6 years: reading book; text book; magazine; and paperwork. 54% of people overall read for leisure during a train journey – the figures in Table 5 reflect that this reading may relate to a number of different carried media.
Table 5. Items individuals had to hand and items individuals used (2004 figures in brackets)
There appear to be changing fortunes for the newspaper – in 2004 the majority (79%) had a newspaper to hand – by 2010 this had reduced to a minority (45%). Those who still have a newspaper to hand are twice as likely to use it compared to the position in 2004. How might this be explained? The newspaper industry has been facing decline for a number of years – just over 21% between 2007 and 2009 (OECD, 2010). A factor may be the changing nature of newspapers – especially those targeted at the public transport traveller. In 1999 the Metro
All Planning in Advance
A lot A little
Very little as I always use my journey time the
same way
Not at all
Not stated I made very worthwhile use of my
time on this train today 30 64 29 31 21 30
I made some use of my time on
this train today 55 32 63 56 53 42
My time spent on this train is
wasted time 13 3 7 12 22 16
Not stated 2 1 1 1 4 13
Carried Items to hand (%) used (%) used/ to hand
Newspaper 45 (79) 32 (29) 0.71 (0.37)
Reading book 36 (36) 21 (20) 0.59 (0.56)
Text book 7 (7) 3 (3) 0.43 (0.44)
Magazine 12 (15) 7 (8) 0.53 (0.52)
Paperwork 21 (24) 11 (12) 0.51 (0.51)
Games/puzzles 6 (3) 2 (1) 0.36 (0.41)
Food/drink 26 (30) 16 (19) 0.62 (0.6)
Laptop computer 11 (7) 4 (2) 0.32 (0.30)
Netbook * 2 1 0.40
Mobile phone 69 (66) 37 (24) 0.54 (0.36)
Portable DVD player * 1 0 0.43
MP3 player/personal stereo 22 (12) 13 (6.4) 0.58 (0.56)
Games console 1 (0) 1 (0) 0.45 (0.50)
eBook/iPad * 2 1 0.57
Not stated 5 (6) 23 (30)
newspaper was launched in London – a free daily newspaper. Its first edition had 85,000 copies. It is now available in 50 UK cities with a daily distribution of around 1.3 million copies (www.metro.co.uk). However, the peculiarity here is that one would expect, if anything, more people having a newspaper if they are freely available and targeted at public transport users. This said, many people are embarking on their outbound journeys from points where the newspapers are not available and may instead obtain a newspaper on their arrival at a city station. Free evening newspapers are less widespread than morning newspapers which may diminish the number of people who obtain a newspaper for their return journey – and this may be coupled with people not retaining the morning/outbound paper because it was free. The earlier mentioned issue of music being able to create the psychological distance from other passengers that the newspaper can also achieve may also be relevant as the proportion of passengers equipped for music increases.
6.3 Keeping pace with technological advance
Taking netbooks and laptops together then the proportion of people with such a device has increased by 77% in six years from 7% in 2004 to 13% in 2010 – the proportion of travellers who have and use a laptop computer has increased by 60%. The proportion of people with a mobile phone has only increased modestly over the six years. However, a much higher proportion of those who have a phone with them are now using it during the journey – 54% compared to 36% for 2004. The proportion of people who have a music player and the proportion who have one and use it has doubled in six years. However, it is increasingly difficult to know what functionality a device has. Thus ‘mobile phone’ in its earliest guise made phone calls and then text messages. Now the latest (smart) phones have touch screens and can be used to browse the internet, take and view photos, check and send emails, store and play music and listen to podcasts and play games.
6.4 Equipped travel according to gender, age and journey purpose
In terms of gender, and reflecting the activities discussed earlier, men are more likely than women to have a newspaper, paperwork, laptop, games console or eBook/iPad with them; meanwhile women are more likely than men to have a reading book with them and marginally more likely (72% compared to 68%) to have a mobile phone with them.
In relation to age, those 35 and over are more likely to have a newspaper and to use it than those under 35. Similar proportions across notional working ages have paperwork and to a much greater extent than those aged 60 and over. Those aged 35-44 are most likely to have a laptop with them (17%) and to use it (6%). This compares to figures of 9% and 3% respectively for 16-25 year olds and 10% and 3% for those aged 55-59. Mobile phones are more likely to be carried across all age ranges in 2010 compared to 2004 but both having and using a mobile phone on the train is something that decreases with age – 87% of 16-25 year olds have a phone (66% have and use one) while 38% of those aged 65+ have one with them (13% have and use one). Similarly, having and having and using an MP3 player / personal stereo both decrease with age – 50% of 16-25 year-olds have one (27% use it) while only 2% of those aged 65+ have one (1% have one and use it).
In terms of journey purpose, commuters are more likely than other passengers to have the following with them: newspaper; reading book; text book; and music player. Business travellers are more likely than other passengers to have the following with them: paperwork; laptop computer (much more likely – 28%); and mobile phone. Leisure travellers are more likely than other passengers to have a magazine with them.
7 Concluding discussion
their time better or seem to pass more quickly. Over a fifth to whom the question of ‘better’ applied indicated that the time had been made a lot better; meanwhile 46% indicated no effect. 46% indicated the time seemed to pass quicker by having electronic devices (32% indicated ‘no’ to this). We suspect there would have been a strengthening of the view of ‘better’ and ‘quicker’ in relation to travel time six years on. This relates to Watts’ (2008) notion of experienced time being able to be stretched or compressed.
The substantial increase in listening to music/radio/(podcast) signals strong prospects that people are increasingly able to create psychological distance from other passengers and a private space for (better) engaging in other activities. At the same time, other technologies and their use are permeating and infecting this private space as people communicate with others remote from the train via email, texting, phoning and social networking.
It has been revealing that passengers who indicate they plan very little because they always use the travel time in the same way are not emerging correspondingly as those most likely to consider their time use very worthwhile. We suggest there is an important challenge / opportunity for both employers and rail operators to address here through approaches that aim to influence traveller behaviour such that they can increase the worthwhile nature of rail travel time use (as Watts and Lyons (2010) have demonstrated is possible through their travel remedy kit).
Our empirical evidence has been limited by the questions we were able to ask. We do not have specific data on the duration of different activities within people’s journeys or any robust metrics of (relative) productivity for travel time use. This limits the extent to which we are able to challenge the way travel time (savings) are valued in economic appraisal of transport investment. However, it is telling to note that the UK Department for Transport is having to explicitly address doubts in its approach to provide assurances that its economic case for high speed rail is sound. One of the frequently asked questions set out on the Government website (http://www.dft.gov.uk/pgr/rail/pi/highspeedrail/faq) is as follows: “I’ve heard that the business case is based on the idea that all the time passengers spend on train is wasted. Isn’t that stupid?”. This is correspondingly addressed at some length in the economic appraisal report for high speed rail (DfT, 2011a). While our study cannot offer revised ‘values of time’ as alternatives for the process of economic appraisal in light of how people use their time on trains, we do believe our findings raise other important issues to be acknowledged and perhaps accounted for. Travel time use and how worthwhile it is considered to be (reflective of its ‘value’) are changing over time in the face of the information age and its transformation of how people communicate, conduct business and leisure activity. Our research also reveals that it is very difficult to attribute ownership of time – something else significant to economic appraisal which distinguishes between an individual’s own time and that paid for by their employer (in the case of business travel). There is evidence of people seemingly doing their employer’s bidding in their own time (notably working during the commute) and using their employer’s time for their own (for instance reading for leisure during business travel). The information age is creating greater flexibilities in where and when we undertake certain activities.
We conclude by underlining that while rail travel may see its prospects improve through the provision of higher levels of service and capacity provision on the part of government and transport providers, we should not underestimate the prospects of improvement through the increasing capacity and opportunity for mobile technology and service providers to equip people on the move and support their time use.
8 Acknowledgements
The authors are very grateful to Passenger Focus for the opportunity to include questions on travel time use in the NPS and extend their thanks in particular to David Greeno and Ian Wright for their support. The University of the West of England, Bristol (UWE) is acknowledged for providing the time resources to enable this research to be pursued.
9 References
Bull, M. (2000). Sounding out the city. Personal Stereos and the management of everyday life. Oxford: Berg.
Continental Research (2005). National Passenger Survey overview document: Autumn 2004 (wave 11). Prepared for the Strategic Rail Authority, January.
DfT (2011a). Economic case for HS2: The Y network and London - West Midlands. Department for Transport, February, London.
DfT (2011b). Values of Time and Operating Costs. Transport Analysis Guidance (TAG) Unit 3.5.6, Department for Transport, April, London.
Fickling, R., Gunn, H., Kirby, H., Bradley, M. and Heywood, C. (2008). The productive use of rail travel time and value of travel time saving for travellers in the course of work. Proc. European Transport Conference, Leeuwenhorst Conference Centre, The Netherlands. Fowkes, A. S. (2001). Principles of Valuing Business Travel Time Savings. ITS WP 562,
Institute for Transport Studies, University of Leeds.
Hensher, D.A. (1977). Value of Business Travel Time. Pergamon Press, Oxford.
Jain, J. and Lyons, G. (2008). The gift of travel time. Journal of Transport Geography, 16, 81-89.
Kenyon, S. and Lyons, G. (2007). Introducing multitasking to the study of travel and ICT: examining its extent and assessing its potential importance. Transportation Research, 41(A), 161-175.
Kirby, H.R., Smyth, A.W. and Carreno, M. (2006). Exploring the relative costs of travelling by train and by car. Final Report to Virgin Trains. TRi Record 01/12/06, Transport Research Institute, Napier University, Edinburgh.
Lyons, G. (2006). Travel Time Use – Developing a Research Agenda. Department for Transport, London.
Lyons, G. and Chatterjee, K. (2008). A human perspective on the daily commute: costs, benefits and trade-offs. Transport Reviews, 28(2), 181-198.
Lyons, G. and Urry, J. (2005). Travel time use in the information age. Transportation Research, 39(A), 257-276.
Lyons, G., Jain, J. and Holley, D. (2007). The use of travel time by rail passengers in Great Britain. Transportation Research, 41(A), 107-120.
Mackie, P.J., Fowkes, A.S., Wardman, M., Whelan, G., Nellthorp, J. and Bates, J. (2003). Value of Travel Time Savings in the UK. Department for Transport, July, London. Mokhtarian, P.L., Salomon, I. (2001). How derived is the demand for travel? Some
conceptual and measurement considerations. Transportation Research, 35(A), 695– 719.
OECD (2010). The evolution of news and the internet. DSTI/ICCP/IE(2009)14/FINAL, Directorate for Science, Technology and Industry, Organisation for Economic Co-operation and Development.
Passenger Focus (2011). National Passenger Survey: Autumn 2010 main report. Passenger Focus, London.
Russell, M. (2011). Watching passengers: Using structured observation methods on public transport. Proc. 43rd Universities Transport Study Group Conference, January, Milton Keynes.
Schivelbusch, W. (1980). The Railway Journey. Trains and Travel in the 19th Century. Blackwell, Oxford.
Simun, M. (2009). My music, my world: using the MP3 player to shape experience in London. New Media & Society, 11(6): 921–941.
Skånland, M. (2011). Use of MP3 Players as a Coping Resource. Music and Arts in Action, 3 (2), 15-32.
Stradling, S. (2006). The Psychology of Travel. Review for the Foresight ‘Intelligent Infrastructure Systems’ Project, Office of Science and Technology, Department for Trade and Industry, London.
Wardman, M. (1998). The Value of Travel Time - A Review of British Evidence. Journal of Transport Economics and Policy. 32 (3), 285-316.
Watts, L. (2008). The Art and Craft of Train Travel. Journal of Social and Cultural Geography, 9(6), 711-726.