DRAFT VERSION OF CHAPTER:
E.O.D. Waygood, E. Avineri, G. Lyons (2012), The Impact of Travel Information Systems. Forthcoming in: Ryley, T. and Chapman, L. (Eds.), Transport and Climate Change, Transport & Sustainability Book Series, Emerald, UK. Expected publication: July 2012. ISSN: 20449941.
1. INTRODUCTION
It has long been held that information has an important part to play in supporting and
influencing the travel decisions of individuals. Further, it has been widely hoped if not assumed that improvements in information provision will yield changes in travel behaviour that are to the advantage of the transport system as a whole (whether they be reductions to externalities like congestion or carbon dioxide). Information serves a number of important roles (Lyons, 2006): making the individual aware of the travel options available to them; enabling ‘better’ judgement in selecting between the options; and assisting in being able to plan, undertake and successfully complete the travel option pursued. As the information age has taken hold, the nature and extent of availability of information has evolved considerably. Alongside this, research into understanding the role of information in influencing behaviour has advanced insights into how the content and context of information provision may exert influence. This Chapter examines factors that may influence the efficacy of information provision, with particular reference to how the environmental dimension to people’s travel choices can be addressed.
Concerns over climate change, air pollution, health, and congestion on the road network, coupled with falling oil reserves, are leading governments and citizen groups to take action to change the way people travel. The provision of travel information about transport‐related attributes, such as travel time, travel costs and, more recently, transport‐related carbon emissions might be seen not only as a service provided to the public, but also as an instrument intended to change their travel behaviour. However, some expectations of big effects from new information systems have remained unrealized (Chorus et al., 2006). It can be argued that the design of travel information systems has often ignored the psychological, ergonomic and cognitive processes of choosing to seek and then retrieving and using information. While rational man theory suggests that individuals base choices on the attributes of the choice set (“information content”), the way information is being presented (“information context”) can also have a strong effect on travellers’ use of and reaction to information – a particular focus of this Chapter. Following recent studies in behavioural economics and cognitive psychology, we illustrate how “choice architecture,” through the design and incorporation of small features in the environment of choice making (‘nudges’), might help individuals to overcome cognitive biases, and to highlight the ‘better’ choices for them.
The Chapter will reveal through theory and empirical insight a range of considerations that are likely to govern the effectiveness of travel information provision. The next section provides a brief introduction to the assumed response of travellers to information provision and the notions of content and context. It goes on to consider factors that can determine an individual’s propensity to seek and engage with travel information. The following section considers
heterogeneity of individuals’ social‐psychology in relation to travel choices and what this means for information provision. Section 4 then focuses on information context and considers how the design of information content representation to users can influence their reaction to the content. The final section offers a concluding commentary.
2. INFORMATION USE
If information provision is intended to influence travel behaviour change then an appropriate starting point is to understand its use and the choice making processes related to travel information.
2.1
R
ATIONAL AND IRRATIONAL DETERMINANTS OF TRAVEL CHOICEThe behavioural assumptions on responses of individuals to travel information, commonly applied in the design of Advanced Traveller Information Systems (ATIS), can be traced back to economic theory and the paradigm of rational man. Ben‐Akiva and Lerman (1985, p.32)
describe the theory of choice as a collection of procedures that define the following elements: (i) decision maker; (ii) alternatives; (iii) attributes of alternatives; and (iv) decision rule. The attractiveness of an alternative in the mind of the traveller can be described as ‘utility’ related to the values of the travel attributes.
A choice to take a mode can relate to many things, and some of the reasons to take a mode could be: independence, privacy, social interaction, convenience, time (total, portion), cost
(real/perceived), comfort, experience, environmental impact, social impact (e.g. safety,
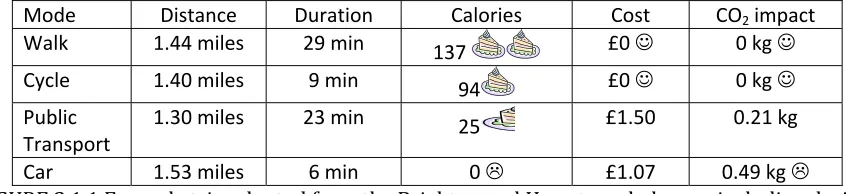
congestion), or health. As information concerning the poor performance of a mode can stimulate change (Chorus et al., 2006), providing information on things that people value, but that cars perform poorly at in comparison to other alternatives may help swing the pros and cons of the decisional balance. One example of this would be the Brighton and Hove travel planner, Journey On1 (Figure 2.1.1).
Mode Distance Duration Calories Cost CO2 impact
Walk 1.44 miles 29 min 137 £0 ☺ 0 kg ☺
Cycle 1.40 miles 9 min 94 £0 ☺ 0 kg ☺
Public
Transport
1.30 miles 23 min 25 £1.50 0.21 kg
[image:2.595.84.517.495.592.2]Car 1.53 miles 6 min 0 £1.07 0.49 kg FIGURE 2.1.1 Example trip adopted from the Brighton and Hove travel planner including design features such as smiley faces (that act as injunctive norms (Schultz et al., 2007)).
As travellers are expected to act as rational human beings, and specifically to exhibit
consistency and transitivity in their choices (Ben‐Akiva and Lerman, 1985, p. 38), then the way alternatives and attributes are presented to the traveller should not matter greatly. However, as it will later on be argued, it is not just the information content that may be influential; travellers may also be affected by the manner in which information is presented (its context).
A strategic review of travel information research commissioned by the UK Department for Transport (Lyons et al., 2007) examined evidence that travellers do not necessarily respond to the information in the way ATIS designers may believe they should. It has been argued within this literature that travellers’ limited cognitive resources have a strong effect on travel‐choice behaviour, and evidence on systematic deviations from rational models have emerged from studies of the processes of gathering travel knowledge, interpreting travel information, and processing it in real time (Avineri and Prashker, 2004, 2004; van der Kaa, 2010; Waygood and Avineri, 2011b). Even when travel information is simple, reliable, and accurate, travellers tend to interpret and value this information in ways that systematically violate the main assumptions of rational behaviour. Although informed travel choices made by individuals should not be seen as ‘irrational’, it appears more weight should be given to what are sometimes called ‘irrational’ motives and behaviours in the design of information systems, recognising the importance of context, emotions, habit, impulses, social influence, and a range of socio‐psychological factors that might substantially vary between travel information users.
We will come on to consider socio‐psychological factors that influence behaviour change and behaviour change intention allied to the role of information provision. However, we next consider what can determine an individual’s propensity to seek information.
2.2
I
NFORMATION ACQUISITIONIt is asserted, with support from empirical findings, that most people, most of the time, do not consult information because their everyday behaviours are routinized and habitualised – they are sufficiently familiar and predictable for the individual to make a (conscious) decision based on prior experience and typically yield a satisfactory outcome from that decision.
Correspondingly people have a greater propensity to seek information when they face
unfamiliar and/or uncertain circumstances. Such circumstances apply when individuals make a trip for the first time (Chorus et al., 2006). It can also concern people who are less established in a mode (i.e. they do not use it out of habit) (Kenyon & Lyons, 2003; Lyons et al., 2007) and who need more information for various modes before making a decision (Verplanken et al., 1997).
In light of such findings, the city of Malmö, Sweden, created a travel information program through which new residents were given travel information for modes other than by car (SMILE, 2006). The program actively provided information, rather than waiting for the individual to seek information (that would most likely relate to their usual/preferred mode). The study found that 95% of people contacted wanted and accepted transport advice and 15% of regular car users reported that they had changed some common travel patterns. Similarly, Bamberg (2006) reports a study where new residents were given a free bus ticket and personalised travel information. In comparison to the control group, the study group had statistically higher public transit use. Those findings suggest that information provided when new travel decisions are being made can lead to more sustainable travel.
Hague to convey local air quality information2). However, here it should be noted that in a UK
study, only a third of motorists passing a sign displaying immediate warning information were found to have even seen the sign (Chatterjee et al., 2002). In other words, pushing information to travellers is no guarantee that they will connect with the information.
In a review of the role of information on car‐use, Chorus et al. (2006a) concluded that,
“Information provision on the performance of the currently chosen alternative… may help change cardrivers’ choices in the long run.” Their review found that ex‐post information was
particularly valuable for changing subsequent trips. With consideration to climate change it may be necessary to incorporate such information into cars, as many people are unlikely to seek this out independently considering the findings related to habit and preferred choice. However, this information may still be ignored.
Even if information is available, there may be low awareness of the information source, or even if people are aware of it, they may not use it (Coulter et al., 2007; Farag & Lyons, 2008; Kenyon & Lyons, 2003; Lyons et al., 2007; Peirce & Lappin, 2005). The use of such resources relates to the discussions above. Farag and Lyons (forthcoming) in an empirical study of online public transport information found that propensity to consider public transport had a stronger
influence on consulting public transport information than the other way around. What follows is that raising awareness of information availability may not increase its use – attention must be given to the need to raise awareness of public transport as a viable option and it is this that is likely to generate greater use of information.
One further point about information acquisition relates to the source. Not everyone owns a Smartphone, nor is everyone comfortable or able to access online information. It is important to think who the target is and where they obtain information. In the UK, older people were found to rely on more traditional sources of paper‐based information, whereas younger people more commonly used Internet‐sources (Farag and Lyons, 2008). However, this can vary across countries, as in Japan mobile phones are available that are specifically tailor to older people.
An appreciation of how people (are assumed to) make decisions and when they are prompted to consult or engage with travel information leads us now to consider further the heterogeneity of the travelling public in terms of social‐psychological factors that are pertinent to the prospects of, and the requirements for, information influencing travel decisions.
3. PSYCHOLOGICAL AND BEHAVIOURAL STAGES OF CHANGE
The framing of this Chapter is the notion that people are exhibiting current travel behaviours that are more or less detrimental in environmental terms – notably some forms of travel yield more or less greenhouse gas (GHG) emissions than others. At a system level it is desirable to see travellers moving collectively to more sustainable travel choices – i.e. those that reduce the carbon footprint of travel. At the level of the individual traveller, behaviour will be governed in part by the extent to which the person considers ‘environmental impact’ to be an attribute of
travel alternatives that has relevance to her selection of a preferred option. We note ‘in part’ because more sustainable travel choices may in some instances arise as a consequence of individuals considering other impacts such as monetary or health – i.e. I may coincidentally travel more sustainably because I have chosen to walk and cycle more and drive less for health reasons, irrespective of my views regarding the environmental impact of my travel.
In this section we consider the Transtheoretical Model (TTM) to conceptualise how different individuals can be at different stages psychologically and in turn behavioural change leading from one behaviour to another. We note how such interpretation of context can help
considerations of the appropriate offering of information content to assist behaviour change in the direction desired.
TTM was developed in the health field to help address addictive behaviour, specifically smoking (Prochaska & Norcross, 2001), but it has also been applied to a wide range of health behaviours (Prochaska et al., 1994, 2008). The model “uses stages of change to integrate processes and principles of change across major theories of intervention” (Prochaska et al., 2008, pg. 97). It was built to assist health practitioners identify what type of help was required to move an individual towards successfully changing their problem behaviour. It is considered here as a theory to guide the provision of transport information to help individuals move from less sustainable to more sustainable behaviour. It has been applied previously in this regard in relation to drivers’ willingness to reduce car use (Beatty et al., 2002) and cycling to work (Gatersleben & Appleton, 2007). It has also been applied to projects on information campaigns (TAPESTRY3) and mobility management (MAX4 ). We later note in relation to this chapter that a key distinction between health behaviours such as giving up smoking and reducing car use can be the proximity of the benefit to the individual.
The model is composed of six temporal stages of change and a number of processes that can help move the target from one stage to the next. By understanding what the particular stage of change is, information can be tailored to best assist the target person or population move to the next stage. This involves understanding how the target views the pros and cons of changing travel behaviour in the decision process (Prochaska et al., 1994) so that the right triggers, or motivations, are addressed. The sequential stages of change are summarised as follows:
Precontemplation – the target individual’s behaviour is a problem, but the individual does not consider it to be (or may wish to change but exhibits no consideration of doing so)
Contemplation – the individual is aware of the problem and is considering a change (i.e. knowledge of the problem may not be enough to cause change)
Preparation – the individual is preparing for a change, possibly trialling actions, but not as a sustained level (e.g. relapse to problem behaviour occurs frequently)
Action – an action has been chosen and sustained for up to six months
3 http://www.transport‐research.info/web/projects/project_details.cfm?id=13774&page=results
Maintenance – an action has consistently been carried out for at least six months – lower risk of relapse, but the individual may still be consciously making the choice to act in this way
Termination – an action has become habit (i.e. an automated, not consciously considered behaviour) and the threat of relapse is negligible
We now discuss the first four of these stages in more detail in relation to moving from ‘less sustainable’ to ‘more sustainable’ transport behaviours and consider the ways in which individuals might be ‘informed’ to encourage movement through the stages. Information provision here will be seen to be broader than merely the concept of a journey planning facility that provides information on attributes of the alternatives. This further underlines the breadth of the notion of ‘information context’.
Pre
contemplation
In the pre‐contemplation stage the target may not consider their behaviour to be a problem and may be acting in a habitual manner. Here the challenge is one of consciousness raising and an awareness of the causes, consequences and ‘solutions’ to the problem. Unlike smoking where the behaviour is directly a problem to the individual, it can be more difficult for an individual to subscribe to the view that their unsustainable travel behaviour is a problem for them or indeed that acting to achieve a ‘solution’ may benefit them. Due to numerous such psychological hurdles related to climate change (see Swim et al., 2009 for examples), it may be necessary to focus on more individual or local impacts of car use (Anable et al., 2006; Swim et al., 2009) such as those shown in Figures X and Y from Japan.
[image:6.595.71.135.406.616.2]
FIGURE 2 GOVERNMENT SIGN AND LOCAL SIGN. TRANSLATION OF GOVERNMENT SIGN: SCHOOL ROUTE. TRANSLATION OF LOCAL SIGN: DON'T SPEED, SIGNED THE LOCAL PARENT‐TEACHERS ASSOCIATION (PTA).
It has been suggested (see TAPESTRY 2003) that after raising awareness of the general problem, it is necessary for the target individuals to accept responsibility. Due to the scale of climate change, individuals may feel that any change that they might effect would have little overall impact (Swim et al., 2009; Waygood & Avineri, 2010), thus they may feel reduced responsibility. Initiatives such as Transportation Town5 or the Housing and Transportation Affordability Index6 are attempting to address this problem of scale by contextualizing the individual’s impact in their provision of information on greenhouse gases (GHGs) (see section on context).
The process of dramatic relief suggests that emotional experiences should be triggered. People are more motivated by emotive stories of individuals than they are by statistics (Slovic, 2010), so developing campaigns that highlight success stories or focus on impacts to an individual may be effective motivators. However, the impact of climate change on individuals that are
geographically and culturally removed may not be as effective (Swim et al., 2009).
It will be appreciated from the above that to take individuals out of pre‐contemplation may be a formidable challenge and may ‘only’ support contemplation of change.
Contemplation
5 transportationtown.com
At this stage an individual accepts that there is problem with their personal behaviour and is contemplating some change. It is necessary to help the target understand the pros and cons of behaviour change and to shift the decisional balance away from the problem behaviour. It will also be important for the individual to believe that they can change.
The process of environmental reevaluation encourages the individual to think about the impact his problem behaviour has on others. Information here may relate to personal benefits (e.g. health, monetary savings), community benefits (e.g. reduced traffic, NO2), or global ones (e.g. climate change) such as the example of Brighton and Hove’s travel planner in Figure 2.1.1. However, consideration to the design issue of framing (discussed later) could improve the effectiveness of such information. The end result is to reduce GHGs, but people do not
necessarily need to be motivated by environmental concerns to reduce their transport impacts.
Gatersleben and Appleton (2007) found that information that supports cycling as a flexible transport option rather than explicitly in terms of the health or environmental benefits may be more effective at creating behaviour change. Such results highlight that although the end goal is to achieve sustainable transport behaviour, an individual’s motivation(s) to do so does not need to be environmentally based.
Selfliberation is the belief that one can change. This is related to self‐efficacy where confidence exists that despite problems, one will succeed in changing behaviour. With consideration to the framework that the MAX project created, Gatersleben and Appleton (2007) found that pre‐ contemplators had the highest personal barriers, which might be addressed through
individualised travel programs that focus on removing perceived barriers such as Individualised Marketing (Brög & Erl, 2008), Travel Blending (Rose & Ampt, 2001; Taylor & Ampt, 2003), or the Travel Feedback Program (Taniguchi et al., 2003). Such programs often identify people who are already considering change.
Preparation
In the preparation stage, individuals are deciding how they might change their problem behaviour. The process of counterconditioning should here be applied by highlighting different relevant transport options. Practical information and tacit know‐how (rather than conceptual information), are useful in facilitating behavioural change (De Young, 1996). People with less knowledge or experience may desire prescriptive information, while more experienced individuals may desire descriptive information that allows them to make a refined choice themselves. In a state of low knowledge, more prescriptive advice may also be more useful than a range of options (Chorus et al., 2006a).
The process of helping relationships suggests that social connections will be an important source of support and information, alongside formal information sources – i.e. making plans in front of others has a pledge component which is seen as psychologically meaningful. Research on descriptive norms suggests that using information on how others behave can be an effective way to change behaviour. Despite people not believing that information about how others behave would affect their personal behaviour, research has found that it does (Nolan et al.,
2008; Schultz, 1999; Schultz et al., 2007).
At this stage an individual has chosen an action to address their problem. The cons of the problem behaviour outweigh the pros and thus such information is not the focus. For this stage, the process of contingency management is relevant. Here the appropriate information will be feedback on their chosen action related to their motivations to change (e.g. calories burnt if it is a health motivation, GHG emissions if it is environmental). Prochaska et al. (2008) suggest that positive feedback with rewards is relied upon more than punishment for self‐changers.
Appropriate feedback can help the individual feel that they are accomplishing something, or help them adjust their actions to make improvements.
[image:9.595.72.247.197.509.2]
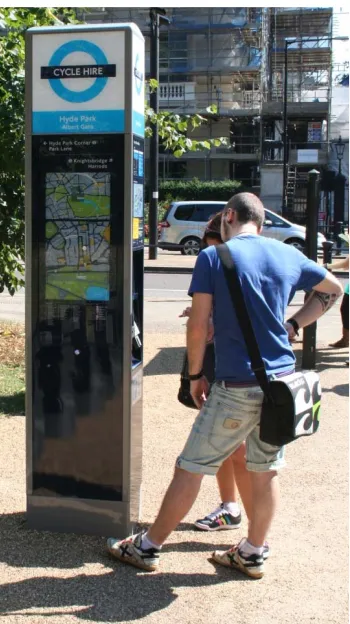
FIGURE 3 CYCLE HIRE INFORMATION IN LONDON, UK HELPS INDIVIDUALS PERFORM THE ACTION OF CYCLING (RATHER THAN PERHAPS TAKING A MORE ENERGY INTENSIVE MODE).
There is no clear‐cut theory on how feedback works. Darby (2006b) suggests that it is part of a learning process that contributes to behaviour. In some situations, feedback is intrinsic (such as touching a hot stove) and we learn to behave in certain ways (such as not touching hot objects). However, in other situations such as CO2 emissions, feedback is hidden or disconnected from the action. As a result, tools like carbon calculators attempt to complete the link between one’s actions and the resultant CO2 produced (Coulter et al., 2007). (Discuss use of such tools?)
feature of what she termed “second generation” carbon calculators. Those tools allowed users to register and track use over time. However, such tools are typically accessed by people who are highly concerned about climate change already and their personal impacts (Coulter et al., 2007).
Eco‐driving is an area where ongoing measuring and monitoring is being applied in encouraging drivers to become more energy efficient in their driving styles. In several hybrid vehicles more efficient driving is encouraged through feedback that has a game‐like aspect. For example, in more recent versions of Ford’s SmartGuage (Ford Media, 2010), the tool now incorporates a long‐term (four to six weeks7) driving pattern feedback in the form of growing flowers. If the driver maintains more efficient driving over a longer period of time then flowers will sprout. Such feedback may help establish more energy efficient driving patterns rather than just short term responses to the previous feedback of growing leaves in response to short‐term driving efficiency.
4. HOW ARE WE AFFECTED BY CONTEXT DESIGN?
The preceding sections have highlighted some of the challenges and opportunities associated with influencing behaviour through information provision. They underline that while
information content itself has an importance, the significance of
context
in terms both of the nature of the individual’s travel (habit, familiarity, certainty etc) and social‐psychological considerations (the stage of change they are at, according to the TTM) cannot be understated. In this section we examine further how individuals can be affected by a further contextual issue – information context design. By this we mean not the content of information itself (i.e. ‘the facts’) but the way in which those facts are portrayed to the individual.People are influenced by images, symbols and context, i.e. the manner in which information is being presented to them. For example, a textual message coloured in green would carry an additional connotation besides the text content. It is widely recognised that colours can have an impact on our emotions and feelings ‐ Green, for example, has been generally found to have a relaxing effect; it has both positive impressions such as refreshment, quietness, naturalness, and negative impressions such as tiredness and guilt (Davey, 1998; Mahnke, 1996; Saito, 1996, cited in Kaya and Epps, 2004).
Although individuals seem to be largely unaware of colour effects (and other effects of visual, textual and contextual design of information on their perceptions and choices), they are
influenced by their use in specific contexts; fashion designers, product designers, and marketers have incorporated such insights in the design of products and goods to influence consumer choices. For example, warm colours (such as red and orange) have been found to be stronger, more exciting, and more arousing than cool colours (such as blue and green) that are considered calming (Kreitler and Kreitler, 1972; Bellizi and Hite 1992; Davidoff, 1991). This concept has been applied in a variety of situations in an attempt to influence people’s behaviour, an example of arousing consumers by using warm colours is the use of the colour red in gambling
environments to stimulate gambling (Griffiths and Swift, 1992; Spenwyn et al., 2010).
A critical feature of the mind's cognitive architecture is the ‘modularity of the mind’ (Fodor, 1983). The mind is composed of an array of interacting, specialized subsystems with somewhat limited flows of intercommunication. Many perceptual and cognitive processes work
independently of each other and specialise in processing specific inputs from the environment. This concept can be illustrated by optical illusions – where previous ‘objective’ knowledge on a visual image might be in conflict with its perception. Brain scientists and cognitive psychologists have discovered that the brain functions as if it had two systems of decision making; one is very fast and automatic, while the other one is reflective (Epstein, 1994). It appears that while the reflective system processes the information
content
, and applies rather systematic and rational ‘algorithms’, a parallel process takes place in our brain by the automatic system whichprocesses the
context
of information – such as the visual environment of the main message, applies heuristic ‘short‐cuts’, and attaches emotions and feelings.This model of information processing contrasts sharply with the old idea that any piece of relevant information would be accessed by a rational cognitive process, while irrelevant information would be ignored by the reflective system. However, both systems work in parallel in the processing of information, and sometimes generate different outcomes. Optical illusions demonstrate the modularity of the mind: even when we are aware of the illusion, we cannot simply have it "turned off".
An informed design of the context of travel information might be another important dimension in promoting sustainable behaviour. In applying a holistic approach to the design of travel information systems we should make simultaneous use of different methods that influence and stimulate both the reflective and the automatic system, and which are pulling in the same direction. Such an approach (one that combines content design and context design) would be seen as more effective than a traditional approach to the design of travel information systems that focuses on information content only.
Research in behavioural sciences, especially cognitive psychology, indicates that individuals' choices in a wide range of contexts deviate from the predictions of economic theory which largely assume a rational behaviour. Some of these deviations are systematic, consistent, robust and largely predictable. Evidence on systematic deviations from rational models have mainly emerged from studies on consumer behaviour, financial behaviour, health behaviour and more recently – travel behaviour (Avineri & Prashker, 2003; Avineri & Prashker, 2004; Kahneman & Tversky, 1979; Tversky & Kahneman, 1974; Tversky & Kahneman, 1991). The “predicted
irrationality” (a term coined by Ariely, 2008 of individuals could (and some argue that it should) play a role in the design of behavioural change interventions. Thaler and Sunstein (2008) advocate the use of ‘choice architecture’ to influence behavioural change: 'nudges', small features designed in the environment of choice making, could help individuals to overcome cognitive biases, and to highlight the better choices for them – without restricting their freedom of choice, and without making big changes to the physical environment, the set of choices, or the economic attributes of the choices.
application of some of the insights from behavioural sciences and their relevance to the design of travel information systems. There has been so far only limited literature on context effects in the design of traveller information systems, and choice architecture has not been applied and evaluated in a this context. Therefore its effectiveness remains an open question, which is not addressed in this chapter.
Three specific concepts of context design are explained in detail and illustrated in this section: design of default choices, framing of textual and numeric messages, and the contextualisation of travel‐related CO2 emissions in the design of choices.
4.1
D
EFAULTSPeople are influenced by ‘defaults’ set for them by the designers of information systems. A default choice is what happens if no effort is made by the individual to change the outcome. For example, a default action may be to receive a plastic bag when shopping and the customer must make some effort to change that outcome.
It is often impossible for private and public institutions to avoid picking some option as the default. Picking ‘smart’ defaults is a way to nudge towards specific choices. Enrolling people automatically into savings plans or organ donation, while allowing them to opt out, is an example of a nudge based on default design. Well‐chosen default rules are examples of helpful "choice architecture." For example, the “Save More Tomorrow” plan (Thaler & Benartzi, 2004), which allows employees to commit themselves now to increasing their savings rates later, when they get raises, has been remarkably successful. Enrolling people automatically into savings plans, while allowing them to opt out, is an example of a successful default choice (Madrian & Shea, 2001). Organ donation policies that make use of opt‐in defaults are more successful than others (Thaler & Sunstein, 2008).
In the context of ATIS design, in response to a user’s interactive query on travel alternatives, the system could present by default (or prioritize through ‘semantic framing’) the more desired choices (i.e. sustainable modes such as walking, cycling or public transport will be presented by default; eco‐driving choices presented by an in‐car system). For example, in the UK, Transport Direct8, a national‐scale web‐based journey planner, provides travellers pre‐trip information about both public transport and car alternatives to get from a specified origin to a destination. Ticking off the public transport option, the user would receive only information related to car transport. However, it can be assumed that many ‘passive’ users of the system would not make the cognitive effort to tick off an option and will be provided with information on the (more sustainable) public transport, even if many of them have the original intention of using a car for the journey. Kenyon and Lyons (2003) termed such systems Integrated Multimodal Traveller Information and found that it could produce a modal shift amongst some users.
Highlighting the alternative ways to travel, and providing additional information about their co‐ benefits (such as the expected reduction in carbon emissions) might contribute to the level of awareness, change attitudes and intentions, and might even provide an opportunity to bring about behavioural change among car users. In some situations, some ‘rational’ utility
maximisers among car‐users might find that sustainable choices, with their co‐benefits, might provide a better option for them and be motivated to change their intended choice (or at least be encouraged further into stages of contemplation and preparation). Although relevant information about sustainable alternatives is provided, many users of travel information systems would not consult it as they might not find it relevant to them, or not be willing to pay the cognitive effort in pursuing such information.
The main argument in favour of incorporating defaults into travel information systems would be that even a user who does not have the original intention of pursuing information on sustainable choices, would be exposed to such information. Another argument would be the relatively marginal cost in designing such defaults options (they do not require ‘new’ content of information or much addition to the source code). As information on other choices is provided and accessible, and users choices are not restricted in any way (not even by a ‘friendly advice’) this could be seen as a gentle push into the right direction, and not as choice enforcement – in line with the ‘libertarian paternalism’ approach advocated by Thaler and Sunstein (2008).
4.2
F
RAMINGFraming is the semantic manipulation of rationally identical problems. In semantic framing only alternative phrasing is used, while in valence framing, information is put in either a positive or negative light (Hallahan, 1999). Semantic framing may reorganize a sentence so that a key point comes at the beginning rather than the end. Valence framing attempts to put something in a positive or negative light (e.g. the spin on a story) such as renaming “tax cuts” as “tax relief” because “relief” has positive connotations.
Related to valence framing and semantic framing is a framing technique that highlights gains or losses associated with the choice outcome, called gain/loss framing. It has generally been observed that people tend to feel and behave differently when information is presented (or ‘framed’) in terms of gains or losses (Kahneman & Tversky, 1979; Tversky & Kahneman, 1991; Thaler et al., 2007). This observed behaviour, called gain/loss asymmetry, refers to the fact that people tend to be more sensitive to decreases in their wealth than to increases. Roughly speaking, losing £100 produces a negative feeling which is twice as intense as the positive feeling experienced when gaining £100.
In Prospect Theory (Kahneman & Tversky, 1979; Tversky & Kahneman, 1991) the choice outcomes evaluated by the decision maker are perceived as ‘gains’ or ‘losses’ relative to some reference point. Such a reference point may be the current asset position, but may be influenced by the presentation of the outcomes or expectations of the decision‐maker. Recent studies provide evidence that travellers exhibit aversion to loss and have a strong tendency to avoid choices associated with losses (Avineri & Prashker, 2004; van de Kaa, 2010; Avineri, 2006).
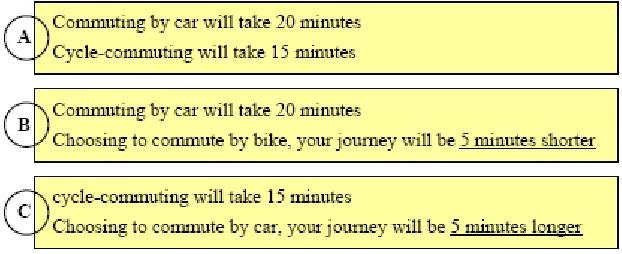
Figure 4.2.1 illustrates the application of loss aversion in the framing of travel choices. It presents three ways of presenting the same information on the journey time of two options: car and cycle commuting.
Fig. 4.2.1. Framing Effects: Three ways of presenting the same travel time information (from Avineri, 2011)
Under the rational choice model, the format of the information should not matter. The information presented by all three formats in Figure 4.2.1 has the same content; it is the difference in how it is presented (B with cycling as a gain; C with car use as a loss) that could influence the choice – in a way that cannot be explained or predicted by classical economics.
None of the information formats impose a restriction of the travel options for the traveller and therefore can be seen as a ‘soft’ measure. Through the loss‐framing applied in framing alternative C, the traveller is encouraged, or ‘nudged’, to choose the option which is considered to be preferable.
An
environmental
impact–oriented
case
study
of
framing
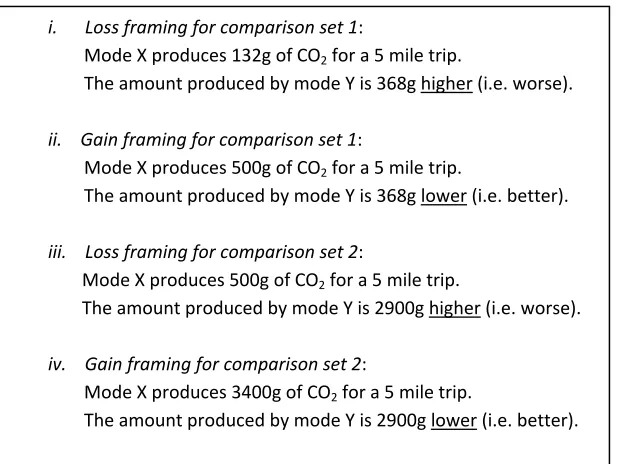
Waygood and Avineri (2011b) examined whether the design consideration of loss framing could increase the perception of differences about the mass of travel‐related CO2 emissions. The hypothesis on the relative effectiveness of loss framing, based on the empirical evidence in other fields, is that it will increase the likelihood of a loss being perceived. Different than most studies on loss aversion their research focuses on the effect of framing on perception rather than its direct effect on choice. Perceiving differences between the outcomes of choices is believed to be important in choices made in a social dilemma context. Therefore incorporating loss‐framing as a nudge to highlight the differences between alternative choices is a preliminary stage in behavioural change required before or in parallel to a change to one’s motivation and intention of behaviour change towards sustainable choices.
FIGURE 4.2.2 The gain and loss framing for two CO2 emissions comparison sets.
4.3
C
ONTEXTUALISING TRAVEL‐
RELATEDCO
2Presented with travel‐related CO2 emissions information by mass, people may appreciate that less is better than more, but to what degree and what the desirable thresholds are may not be clear.
Due to the relative “newness” of CO2 information, people are likely acting in a state of uncertainty about how sustainable their motorized travel choices are. In a high state of uncertainty other alternatives could make certain choices appear more or less sustainable.
Despite the increasing presence of CO2 information, there seems to be little research on whether people understand that information. Coulter et al. (2007) found that both users and non‐users of carbon calculator websites reported not really understanding the results when presented in units of mass. The interpretation of information depends on the users’ background knowledge and the provided context.
Through its contextualisation, information on CO2 emissions can be better grasped, and its presentation would be more likely to be effective in motivating behaviour change. One way to contextualize GHG information would be to represent it as something more familiar to people. This might be showing the volume of gas as a balloon, the energy consumption as hours of a common household appliance, or something that interacts with the gases such as trees. Although graphical representation is beneficial in many regards, consideration must be given to what it conveys. A common image associated with CO2 emissions is that of the carbon footprint. However, the image itself does not convey any injunctive information; that is, information that would allow the user to know if the amount was desirable from a societal perspective. Coulter et al.’s (2007) study highlighted that visual equivalents which display impacts (negative and positive) were more desirable than simply CO2 mass.
i. Loss framing for comparison set 1:
Mode X produces 132g of CO2 for a 5 mile trip.
The amount produced by mode Y is 368g higher (i.e. worse).
ii. Gain framing for comparison set 1:
Mode X produces 500g of CO2 for a 5 mile trip.
The amount produced by mode Y is 368g lower (i.e. better).
iii. Loss framing for comparison set 2:
Mode X produces 500g of CO2 for a 5 mile trip.
The amount produced by mode Y is 2900g higher (i.e. worse).
iv. Gain framing for comparison set 2:
Mode X produces 3400g of CO2 for a 5 mile trip.
The amount produced by mode Y is 2900g lower (i.e. better).
Other presentation styles, or formats, that have some degree of context could be considered as an alternative to presentation of transport‐related CO2 emissions in mass units. For example, the presentation style of tree equivalents (the number of trees required to sequester the CO2 output) visualises the rather abstract CO2 emissions. The presentation style of earth equivalents visualises the CO2 information and attempts to show what is sustainable by showing how many earths would be required if all people behaved as the user. Carbon emissions presented as percentages of a carbon budget or an ‘allowance’ represented a cap and trade system. To increase the relevancy of CO2 information to people, governments are contemplating cap and trade systems or tax systems related to CO2 output. Cap and trade systems could change behaviour by giving an acceptable limit and through market mechanisms. The acceptable limit set by the cap would help to create a reference point for people to judge whether a choice would be a gain or loss (related to the concept of a reference point and gains/losses associated with travel choices, see the discussion in Section 4.2 on framing).
Figure 4.3.1 illustrates how the same information about travel‐related CO2 emissions, a typical yearly amount of emissions produced over a five mile trip by a car, can be presented in four formats: mass, trees equivalent, earths equivalent and a carbon budget. The yearly amount is based on the UK average mileage of 6923 miles9. The tree equivalents used are based on results from American Forests10. A carbon allowance of 3.6 tonnes was used based on results from the World Wildlife Fund’s footprint calculator11.
mass: “680 kg of CO2/year”
trees equivalent:
earths equivalent:
Carbon budget: “27% of yearly budget”
9 http://www.dft.gov.uk/pgr/statistics/datatablespublications/trends/current/section2ptbm.pdf
10 http://www.americanforests.org
FIGURE 4.3.1: information on travel‐related CO2 (typical annual per passenger amount for a full mid‐sized car) presented in four different formats.
Another consideration to equivalents might also be the dual process theory’s experiential versus analytic systems. Certain equivalents might work on an emotional level rather than in the slower analytic system. Equivalents such as the number of trees necessary to absorb the CO2 might act in the experiential system as it would encode the information as an image and metaphor rather than purely a number.
Along with contextualization, there may be further benefits to visualizing CO2 mass. In a review of transport information use, graphical information was found to be the format that is most easily understood (C. G. Chorus et al., 2006). Images assist with the encoding of information (Gick, 1989), are good at concretizing abstract concepts (Stenning & Oberlander, 1995), and improving the comprehension of scientific material (Large et al., 1995). Images can also assist comprehension when the individual has low prior knowledge (Mandl & Levin, 1989; Waygood & Avineri, 2011a). Through those various benefits, visualization of the CO2 information may improve the usability of visual equivalents and improve people’s ability to rank travel alternatives on a sustainability scale.
The findings of Coulter et al. (2007) and Waygood and Avineri (2011a) suggest that the dominant format of using CO2 mass to inform decision makers is not very effective. Waygood and Avineri (2011a) found that the best format to present CO2 was the carbon budget, based on a cap and trade system where a limit was set. In post survey focus groups, individuals commented that it was the easiest to interpret as percentages and budgets were something that they dealt with regularly (Waygood & Avineri, 2010). Coulter et al. (2007) also found that people desired a “target allowance” that would work like calorie counting. That format likely worked best because it gave context to the information; and it gave the decision maker a reference point to work with.
5. CONCLUSIONS
This Chapter has sought to offer an insight into some of the challenges and opportunities associated with information provision in relation to encouraging a move towards more sustainable travel behaviour. What is evident is the considerable diversity of factors that are likely to contribute in practice to an individual’s encounter with information provision and the behavioural influence, if any, that may result.
is complex and far from being strongly understood. We still have rather limited evidence of putting theories into practice and establishing the efficacy of conceptual wisdom in reality.
Travel information services that are focused on the preparation and action stages are substantially developed and common place in many people’s lives – available on a variety of platforms and offering both pre‐trip and en‐route information, particularly in relation to tangible factors such as time, distance, and cost. While it is known that most people most of the time do not consult such services this reflects the local nature of much travel and (corresponding) familiarity and predictability. Meanwhile information services are able to demonstrate appreciable levels of use overall suggesting that they meet a demand for those instances where individuals need, in some capacity, to further inform their decision making. An important question then becomes: how much further can information provision go in relation to influencing travel behaviour? The Chapter has highlighted on the one hand that some social‐ psychological factors are outside the control of the information service designers – the ‘stage of change’ people are at in relation to any move from one behavioural focus to another. On the other hand, it has highlighted that in some respects information context design could make a difference though this remains to be tests. Whether it makes a difference may depend upon how marginal the actual differences are between travel options. Considerations such as the value of one mode over another to society must be made outside of this chapter’s focus on the use of information to affect choices.
REFERENCES
Abrahamse, W., Steg, L., Vlek, C., & Rothengatter, T. (2005). A review of intervention studies aimed at household energy conservation. Journal of Environmental Psychology, 25(3), 273‐ 291. doi:10.1016/j.jenvp.2005.08.002
Anable, J., Lane, B., & Kelay, T. (2006). Review of public attitudes to climate change and transport: Summary report. No. Contract No: PPRO 004/006/006).The Department for Transport. Ariely, D. (2008). Predictably irrational. New York, USA: HarperCollins.
Avineri, E. (2006). The effect of reference point on stochastic network equilibrium. Transportation Science, 40(4), 409‐420.
Avineri, E. (2011), Applying behaviour economics in the design of travel information systems.
The 43rd Annual UTSG (The Universities' Transport Study Group) Conference, Milton Keynes, UK.
Avineri, E., & Goodwin, P. (2010). Individual behaviour change: Evidence in transport and public health. London: The Department for Transport. Retrieved from
http://www.dft.gov.uk/pgr/scienceresearch/social/behaviour‐changes/pdf/transport‐and‐ health.pdf
Avineri, E., & Prashker, J. (2003). Sensitivity to uncertainty: The need for a paradigm shift. Transportation Research Record, 1854, 90‐98.
Avineri, E., & Prashker, J. (2004). Violations of expected utility theory in route‐choice stated preferences: Certainty effect and inflation of small probabilities. Transportation Research Record: Journal of the Transportation Research Board, 1894, 222‐229.
Avineri, E., & Waygood, E. O. D. (2010). Behavioural inception report. Carbon Aware Travel Choices (CATCH). Retrieved from
http://www.carbonaware.eu/fileadmin/user_upload/Deliverables/CATCH_DEL_DOC_D1.1_2 0Behavioural_20Inception_20Report_orginal_V1.pdf
Bamberg, S. (2006). Is a residential relocation a good opportunity to change People’s travel behavior? Results from a theory‐driven intervention study. Environment and Behavior, 38(6), 820‐840. doi:10.1177/0013916505285091
Beatty, S., Meadows, M., & White, D. (2002). Stages of change in drivers willingness to reduce car use before and during the UK fuel crisis. In G. Lyons, & K. Chatterjee (Eds.), Transport lessons from the fuel tax protests. Aldershot, United Kingdom: Ashgate Publishing.
Bellizi, J. A., & Hite, R. E. (1992). Environmental colour, consumer feelings and purchase likelihood. Psychological Marketing, 9(5), 347–363.
Ben‐Akiva, M. E. and Lerman, S. R. (1985). Discrete choice analysis: Theory and application to travel demand. Cambridge, MA.: MIT Press.
Botrill, C. (2007). Internet‐based carbon tools for behaviour change. European Council for Energy Efficient Economies (ECEEE) Summer Study 2007, Côte d'Azur.
Chatterjee, K., Hounsell, N. B., Firmin, P. E., & Bonsall, P. W. (2002). Driver response to variable message sign information in London. Transportation Research Part C: Emerging Technologies, 10(2), 149‐169. doi:10.1016/S0968‐090X(01)00008‐0
Chorus, C. G., Arentz, T. A., & Timmermans, H. J. P. (2006a). Observing the making of travel choices under uncertainty and information: Validation of travel simulator. Paper presented at the 85th annual meeting of the Transportation Research Board, Washington, D.C.
Chorus, C. G., Molin, E. J., & Wee, B. v. (2006b). Travel information as an instrument to change car drivers’ travel choices: A literature review. European Journal of Transport and
Infrastructure Research, 6(4), 335‐364. Retrieved from
http://www.sortclearinghouse.info/cgi/viewcontent.cgi?article=1376&context=research Coulter, A., Clegg, S., Lyons, G., Chatterton, T., & Musselwhite, C. B. A. (2007). Exploring Public Attitudes to Personal Carbon Dioxide Emission Information. London: Department for
for DEFRA On The Literature On Metering, Billing and Direct Displays. Environmental Change Institute, University of Oxford.Darby, S. (2006b). Social learning and public policy: Lessons from an energy‐conscious village. Energy Policy, 34(17), 2929‐2940.
doi:10.1016/j.enpol.2005.04.013
Davey, P. (1998). True colors: The glorious polychromy of the past suggests a strong historical need for color, despite current reductive fashions. The Architectural Review, 204, 34‐36. Davidoff, J. (1991), Cognition through Color. Cambridge, MA: The MIT Press.
De Young, R. (1996). Some psychological aspects of reduced consumption behavior. Environment and Behavior, 28(3), 358‐409. doi:10.1177/0013916596283005
Epstein, S. (1994). Integration of the cognitive and the psychodynamic unconscious. American Psychologist, 49(8), 709‐724. doi:10.1037/0003‐066X.49.8.709
Farag, S., & Lyons, G. (2008). Explaining public transport information use when a car is
available: Attitude theory empirically investigated. Transportation Research Record, 2069, 85‐ 92.
Farag, S., & Lyons, G. (Forthcoming). To use or not to use? an empirical study of pre‐trip public transport information for business and leisure trips and comparison with car travel. Transport Policy.
Fodor, J. A. (1983). Modularity of mind: An essay on faculty psychology. Cambridge, MA.: Bradford Books, MIT Press.
Ford Media. (2010). Lincoln SmartGauge with EcoGuide: Taking drivers to the next level of engagement. Retrieved from
http://media.ford.com/images/10031/SmartGauge_MKZHyb.pdf
Gatersleben, B., & Appleton, K. M. (2007). Contemplating cycling to work: Attitudes and
perceptions in different stages of change. Transportation Research Part A: Policy and Practice, 41(4), 302‐312. doi:10.1016/j.tra.2006.09.002
Gick, M. L. (1989). Two functions of diagrams in problem solving by analogy. In J. R. Levin, & H. Handl (Eds.), Advances in psychology 58: Knowledge acquisition from text and pictures (pp. 215‐230). New York: Elsevier Science Publishers.
Gonzales, M. H., Aronson, E., & Costanzo, M. A. (1988). Using social cognition and persuasion to promote energy conservation: A quasi‐Experiment. Journal of Applied Social Psychology, 18(12), 1049‐1066. doi:10.1111/j.1559‐1816.1988.tb01192.x
Griffiths, M. D., & Swift, G. (1992). The use of light and colour in gambling arcades: A pilot study.
Society for the Study of Gambling Newsletter, 21, 16–22.
Hallahan, K. (1999). Seven models of framing: Implications for public relations. Journal of Public Relations Research, 11(3), 205.
Kaya, N. and Epps, H. H. (2004). Relationship between color and emotion: A study of college students. College Student Journal, 38, 396–405.
Kahneman, D., & Tversky, A. (1979). Prospect theory: An analysis of decision under risk. Econometrica, 47(2), 263‐291.
Kenyon, S., & Lyons, G. (2003). The value of integrated multimodal traveller information and its potential contribution to modal change. Transportation Research Part F: Traffic Psychology and Behaviour, 6(1), 1‐21. doi:10.1016/S1369‐8478(02)00035‐9
Kreitler, H., & Kreitler, S. (1972). Psychology of the Arts. Durham, NC: Duke University Press. Kühberger, A. (1998). The influence of framing on risky decisions: A meta‐analysis.
Organizational Behavior and Human Decision Processes, 75(1), 23‐55. doi:10.1006/obhd.1998.2781
Large, A., Beheshti, J., Breuleux, A., & Renaud, A. (1995). Multimedia and comprehension: The relationship among text, animation, and captions. Journal of the American Society for Information Science, 46(5), 340‐347.
Lyons, G. (2006). The role of information in decision‐making with regard to travel. Intelligent Transport Systems, 153(3), 199‐212.
http://webarchive.nationalarchives.gov.uk/+/http://www.dft.gov.uk/adobepdf/245385/24 9577/Strategic_Review_of_Travel_1.pdf
Madrian, B. C., & Shea, D. F. (2001). The power of suggestion: Inertia in 401(k) participation and savings behavior. Quarterly Journal of Economics, 116(4), 1149‐1187.
doi:10.1162/003355301753265543
Mandl, H., & Levin, J. R. (Eds.). (1989). Advances in psychology 58: Knowledge acquisition from text and pictures. New York: Elsevier Science Publishers.
Mahnke F. (1996). Color, Environment, Human Response. New York: Van Nostrand Reinhold. Peirce, S., & Lappin, J. (2005). Why don’t more people use advanced traveler information?
Evidence from the Seattle area. Retrieved from
http://ntl.bts.gov/lib/jpodocs/repts_te/14004_files/14004.pdf
Prochaska, J. O., & Norcross, J. C. (2001). Stages of change. Psychotherapy: Theory, Research, Practice, Training, 38(4), 443‐448.
Prochaska, J. O., Redding, C. A., & Evers, K. E. (2008). The transtheoretical model and stages of change. In K. Glanz, B. K. Rimer & K. Viswanath (Eds.), Health behavior and health education: Theory, research, and practice (4th ed., pp. 97‐121). San Francisco, CA: Jossey‐Bass.
Prochaska, J. O., Velicer, W. F., Rossi, J. S., Goldstein, M. G., Marcus, B. H., Rakowski, W., . . . Rossi, S. R. (1994). Stages of change and decisional balance for 12 problem behaviors. Health Psychology, 13(1), 39‐46.
Saito, M. (1996). Comparative studies on color preference in Japan and other Asian regions, with special emphasis on the preference for white. Color Research and Application, 21(1), 35‐49.
Schultz, P.W. (1999). Changing Behavior with Normative Feedback Interventions: A Field
Experiment on Curbside Recycling. Basic and Applied Social Psychology, vol. 21, no. 1, pp. 25‐ 36.
Schultz, P. W., Nolan, J. M., Cialdini, R. B., Goldstein, N. J., & Griskevicius, V. (2007). The
constructive, destructive, and reconstructive power of social norms. Psychological Science, 18(5), 429‐434. doi:10.1111/j.1467‐9280.2007.01917.x
Slovic, P. (2010). If I look at the mass I will never act: Psychic numbing and genocide. Emotions and Risky Technologies, 5(1), 37‐59.
SMILE (2006). CIVITAS SMILE newsletter no 2. Retrieved from http://www.civitas‐ initiative.org/docs/CIVITAS%20SMILE%20‐%20Newsletter%20No%201.pdf
Spenwyn, J., Barrett, D.J.K., & Griffiths, M.D. (2010). The role of light and music in gambling behaviour: An empirical pilot study. International Journal of Mental Health Addiction, 8, 107– 118.
Staats, H., Harland, P., & Wilke, H. A. M. (2004). Effecting durable change: A team approach to improve environmental behavior in the household. Environment and Behavior, 36(3), 341‐ 367.
Stenning, K., & Oberlander, J. (1995). A cognitive theory of graphical and linguistic reasoning: Logic and implementation. Cognitive Science, 19(1), 97‐140.
Swim, J., Clayton, S., Doherty, T., Gifford, R., Howard, G., Reser, J., Weber, E. (2009). Psychology and Global Climate Change: Addressing a MultiFaceted Phenomenon and Set of Challenges.
American Psychological Association. Retrieved from
http://www.apa.org/science/about/publications/climate‐change.aspx
TAPESTRY (2003). Travel Awareness Publicity and Education Supporting a Sustainable Transport Strategy in Europe: Final Publishable Report. Available from http://www.transport‐
research.info/Upload/Documents/200810/20081002_161028_52677_TAPESTRY.pdf
[viewed 7 May, 2011].
Thaler, R., & Benartzi, S. (2004). Save more tomorrow™: Using behavioral economics to increase employee saving. The Journal of Political Economy, 112(S1, Papers in Honor of Sherwin Rosen: A Supplement to Volume 112), pp. S164‐S187. Retrieved from
http://www.jstor.org/stable/10.1086/380085
Thaler, R.H., Tversky, A., Kahneman, D., & Schwartz, A. (1997). The effect of myopia and loss aversion on risk taking: An experimental test, Quarterly Journal of Economics, 112, 647–661. Tversky, A., & Kahneman, D. (1974). Judgment under uncertainty: Heuristics and biases. Science,
185(1124), 1131.
Tversky, A., & Kahneman, D. (1991). Loss aversion in riskless choice: A reference‐dependent model. The Quarterly Journal of Economics, 106(4), 1039‐1061.
van de Kaa, E. J. (2010). Prospect theory and choice behaviour strategies, review and synthesis from social sciences. European Journal of Transport and Infrastructure Research, 10(4), 347‐ 367.
Verplanken, V., Aarts, H., & van Knippenberg, A. (1997). Habit, information acquisition, and the process of making travel mode choices. European Journal of Social Psychology, 27, 539‐560. Waygood, E. O. D., & Avineri, E. (2011a). Does "500g of CO2 for a five mile trip" mean anything? Towards more effective presentation of CO2 information. Proceedings of the Transportation Research Board 90th Annual Meeting, Washington, D.C.
Waygood, E. O. D., & Avineri, E. (2011b). The effect of loss framing on the perceived difference of
CO2 amounts: Implications for advanced travel information systems (ATIS). The 43rd Annual UTSG (The Universities' Transport Study Group) Conference, Milton Keynes, UK. Retrieved from http://www.carbonaware.eu/news/latest‐news/article/catch‐publications‐online.html Waygood, E. O. D., & Avineri, E. (2010). Research and Design Report. Carbon Aware Travel Choices
(CATCH). Retrieved from
http://www.carbonaware.eu/fileadmin/user_upload/Deliverables/D1.2_Research_and_desi gn_report.pdf