JOURNAL OF THE STATISTICAL AND
SOCIAL INQUIRY SOCIETY OF IRELAND.
THE MORTALITY FROM TUBERCULOSIS IN SAORSTAT BntEANN. A STATISTICAL STUDY.
BY R. C, GEARY, M.SQ,
[Bead before the Society on Thursday, 19th June, 1930.] [This paper nwy not be reprinted without permission,]
I.—INTRODUCTION.
There were 3,774 deaths from tuberculosis in Saorstat Eireann in 1929, or 128 per 100,000 of the estimated popu-lation. For the fourth year in succession declines have been recorded. The rate in 1929 was 6.6% less than the rate in 1928, and 53.7% less than in 1904, which was the highest recorded in recent years in the present area of Saorstat Eireann.
Deaths from tuberculosis were 8.8% of all deaths in 1929. Between the ages of 15 and 45 deaths from tuberculosis were no less than 42.8% of all deaths in 1928.
EXPECTATION OF LIFE IN YEARS 1925-27 IN SAORSTAT EIREANN.
Actual:
Males Females Female excess
If there were no deaths from tuberculosis . Males
Females ... Female excess
A G E o
57-4 57-9 + 0.5
61.4 61.3
— 0 . 1 5
59.5 59-2 —0.3
62 .0 62 .3 + 0.3
15
5°-7
5o-5
53-3 53-3
25
42.4 42.4
44-3 44.2
35
34-4
34-7 + 0.3
35-6 35-6
45
26.5 27.0
+ 0.5
27.1 27-3 +0.2
These figures show that the relatively low female expecta-tion of life at the young ages is not due to any marked ex-tent to the mortality from tuberculosis. It will also be noted that the total extinction of the disease in the Saorstat would result in an increased expectation of life at birth of 4.0 years in the case of males, and 3.4 years in the case of females.
II.—SOME INTERNATIONAL COMPARISONS. The following table* shows the crude tuberculosis mor-tality rates in 1927 in twenty-four countries:—
Chile Hungary Finland Japan France Austria Norway
Saorstdt Eireann
Spain . . Northern Ireland Switzerland Italy . . Sweden
Rates per
100,000
population.
238 (a) 235 202 (b)
. . 187 (c) 174 166 . . 164 (c) . . 145
144 1 4 1 1 4 0 134 1 3 2
Scotland England & Wales Belgium
Czecho- Slovakia Netherlands Germany Canada Denmark United States
Australia New Zealand
Rates per
100,000 i
population.
1 0 0
97 97 95 94 93 85
82 77 56 49
(a) 1923 , (b) phthisis, 1926 ; (c) 1926.
The great range of variation in the tuberculosis mortality rates from Chile, with 238, to New Zealand, with 49 per 100,000, is very remarkable. The Saorstat was eighth in a list of twenty-four countries, and the rate (in 1927) was not much greater than those for the five countries following. Perhaps the most interesting features of the , table are the large gaps which at certain stages separate groups of countries. Would this grouping be maintained if the statistics for other countries were available, or would the missing countries fill up the gaps?
The contrast between the Saorstat and England is rather too favourable to the former, in so far as England is pre-dominantly urban. In English rural districts in 1927 the rate was only 77 compared with 145 in the whole Saorstat We have still a lot of leeway to make up in this country.
The decline in the mortality from tuberculosis during the last twenty years or so seems to have been a universal phenomenon. The following table# shows the percentage
declines between the years 1911 and 1927 for nineteen coun-tries arranged in order of the magnitude of these figures:—
United States. . Scotland Germany Netherlands Northern Ireland Switzerland . . England and Wales Australia
New Zealand . .
Saorstat Eireann
49 (a)
44 41 4 1 4 0 35 34 33 33 33
Sweden Norway Belgium Italy .. Finland France Japan
Chile . . Spam
3i (b) 26 (b) 25
2 2
21 (c)
2 1
16 (b) 13 (d)
9
(a) 1910-26, (b) 1911-26, (c) phthisis 1911-26; (d) 1911-23. In view of the vast increase in its per capita wealth during the sixteen years it is not surprising to find that improvement is most marked in the United States. The Saorstat improvement is well up to the average; in fact we occupy exactly the median position, with about the same percentage as England, and only 2% below Switzerland in the sixth place. It is markedly less than the percentage declines for Scotland and Northern Ireland. The high position of Germany is in contrast with that of France, Belgium and Italy.
A most encouraging feature of the general improvement in the international tuberculosis position is that the im-provement is in no way related to the magnitude of the tuberculosis mortality rate in any of the countries—the im-provement is as marked in countries in which the mortality
70 Mortality from Tuberculosis in Saorstdt Eireann is relatively high as in those in which it is relatively low. It might reasonably be argued, therefore, that there is, so to speak, no saturation point in the degree of improvement, and it is likely that the disease will be completely wiped out in many countries in our own time.
A remarkable paper* by Louis I. Dublin and Gladden W. Baker on the "Mortality of Hace Stocks in Pennsylvania and New York, 1910," directed attention to the appallingly high mortality from all causes, but particularly from phthisis amongst the Irish-born in the United States in 1910. The following table Has been constructed from data pub-lished in this paper:—
MORTALITY FROM PHTHISIS AND FROM ALL CAUSES OF DEATH IN PENNSYLVANIA AND NEW YORK, 1910. MALES.
Birth Place
U.S.A. (native parentage Ireland
Austria-Hungary Russia
Italy Germany Great Britain
PENNSYLVANIA
Phthisis per 100,000
(crude)
1 0 5
343
1 1 8 1 0 7 82 195 1 5 0
All causes per 1000 (a)
(standard-ised)
12.8
23.6 14.4 13-7 14-5
17.0 16.1
N E W
Phthisis per 100,000
(crude)
1 7 1 589 1 6 6 1 1 5 1 1 2 267 2 1 5
YORK
All causes per 1000 (a)
(standard-ised)
13.8 25-9 14-3 i3-i 12.9 17-9 16.6
(a) Aged 10 and over.
As the figures are almost incredible it is necessary to explain that they refer (as far as one can judge) to com-plete enumerations in the single year 1910 in Pennsylvania and New York State, where about one-half of the Irish-born in the United States reside, so that the numbers on which the rates were based were quite substantial, and there can be no doubt that they represent the normal relation which the mortality of Irish immigrants bears to that of other immigrant stocks. The results for the two states were, broadly speaking, quite confirmatory. The standard-ised death-rates for all causes of death were twice as high amongst the Irish-born males as amongst persons born in the United States of native parentage. In both states the male phthisis mortality rate was three and a-half times as great as amongst the native-born, and more than twice as high as for any other race stock on the list.
A previous table has shown that since 1910 the tuber-culosis mortality rate has halved in the United States, and
presumably this improvement has extended to the poorest classes, amongst whom are the Irish-born. It is unlikely, however, that the relative position of the Irish in this matter has substantially changed.
III.—MORTALITY FROM TUBERCULOSIS SINCE 1840.
The annual report of the Registrar-General for the year 1928 contains a most useful summary of the numbers of deaths in Saorstat Eireann, and the rates per 100,000 popu-lation from 1864 to 1928 for some of the principal causes of death. The particulars for phthisis are given in Table 1, and are graphed in diagram 1, with the mortality from all forms of tuberculosis in Saorstat Eireann (from 1881) and in England and Wales (from 1848).
DIAGRAM 1.—MORTALITY FROM TUBERCULOSIS. 100,000 OF POPULATION, 1840-1929.
RATES PER
400
3oo-
i£o-\ A
-Aoo
3SO
-3oo
72 Mortality from Tuberculosis in Saorstdt fiireann from 1864 to 1900. The history of tuberculosis in England and Wales has been very different. The rates have declined almost continuously throughout the whole period of statis-tical record, and from 1885 the Saorstat rates have always been in excess of the English rates. In all series of curves* the linearity of the trends (except during the war years) is rather remarkable.
It is fairly apparent from the chart that the gradient of decline in the years immediately preceding the war was greater than in the years since 1920. In fact, on fitting straight lines (by the method of least squares) to the Saor-stat (phthisis) and the English curves from 1902-14 and 1920-28 respectively, we find that the Saorstat pre-war rates were declining by 4.5 per 100,000 per annum during the years 1902-14, and by only 2.0 in the post-war years. The corresponding figures for England and Wales were 3.8 in 1902-14, and 2.7 in 1920-28.
TABLE YEAR 1840 1850 1860 1864 1865 1866 1867 1868 1869 1870 1871 1872 1873 1874 1875 1876 1877 1878 1879 1880 1881 1882 1883 188t 1885 1886 1887 1888 1889 1890 1891 1892 1893 1894 1895
L— MOETALTTY FROM TUBERCULOSIS 1840—1929.
Rates poi 100,000 Population All Forms
"a?
<
U-J
224 231 249 250 255 255 251 238 243 248 255 254 255 246 258 Phthisis 109 (a) 293 (a) 187 (a) 157 165 163 171 155 108 167 174 177 179 158 171 173 176 177 181 190 173 181 196 196 201 200 198 187 192 200 201 198 199 196 199 Phthisis Mortality Deviations
as % of, quinquennial averages — — — — + 0 . 3 + 4.1 - 5 . 8 - 0 3 - 0 . 6 + 0.9 + 3.7 + 3.9 - 8 1 - 0 . 7 + 1.1 + 0.6 - 0 . 9 -*-l 4 + 5.3 - 6 0 - 3 . 1 + 3.4 + 0.3 + 1.4 + 2.1 + 1.2 - 4 . 3 - 1 . 8 + 2 1 + 1.5 - 0 . 8 + 0.2 + 0.4 + 1.1 YEAR 1896 1897 1898 1899 1900 1901 1902 1903 1904 1905 1906 1907 1908 1909 1910 1911 1912 1913 1914 1915 1916 1917 1918 1919 1920 1921 1922 1923 1924 1925 1926 1927 1928 1929
IN SAORSTAT FIREANN,
Rates pei 100,000 Population All Forms 243 266 268 266 274 266 255 262 277 259 255 255 250 234 224 212 210 210 205 219 211 218 212 188 165 156 153 148?" 153 157 147 110 137 128^ Phthisis 185 203 203 200 218 209 204 209 217 202 195 198 192 181 171 169 168 167 162 177 168 174 168 146 128 125 122 117 123 123 114 115 108 103 Phthisis Mortality ' Deviations
as % bf,
quinquennial averages.
- 6 . 1 + 2.4 + 0.7 - 2 . 9 + 5.2 + 0.1 - 3 . 3 + 0.2 + 5.5 — 1.0 - 2 . 8 + 2.1 + 2.4 - 0 . 7 - 2 . 9 - 1 . 1 + 0.3 - 1 . 0 - 3 . 5 + 4.0 — 1.1 + 4.0 + 6.5 - 0 8 - 6 . 3 - 1 . 4 — 1.5 - 4 . 4 + 2.9 + 38 - 2 . 8 + 2.3 —
Prior to 1864 mortality statistics were collected at the time of the Census, i.e., in each of the years 1841, 1851, 1861, and 1871, each householder or head of institution, etc., was asked to state particulars of deaths in his family or institution during the preceding ten intercensal years. The defects of the system are, of course, evident, and were indeed stressed in each" successive Census report. The principal defect was that the records of mortality in families all of whose members had emigrated were completely lost, as were the deaths of many old people. In the year immediately preceding the Census year, however, the mortality records as disclosed at the 'Census might be expected to be fairly complete, and, in fact, we find an excellent correspondence in 1870 when the results of the two systems could be set side by side: in all Ireland the Census mortality statistics showed 91,683 deaths from all causes, compared with 90,462 as returned by the registration system. In consequence it is thought that the statistics of mortality from " consump-tion " in the years 1840, 1850, 1860 and 1870 may be used to show the trend in mortality from phthisis prior to 1864. The following are the estimate'd phthisis mortality rates in Saorstat Eireann in the years 1840, 1850, and 1860:—
Per 100,000
population.
1840 . . . . . . . . . . . . . . . 199 1850 293 i860 187
These estimates were found by linking up the all-Ireland consumption rates at the ages 15-44 in the years 1840, 1850, 1860, 1870 with the .Saorstat phthisis rate in 1870. It was necessary to confine attention to these ages because it is fairly obvious from the pre-registration statistics that many deaths at the older ages, which were really due to bron-chitis, were attributed to consumption.
While the higher rate in 1850 might be attributed as an after effect of the Famine, it is clear that even prior to that great catastrophe the phthisis rate was substantial, and, furthermore, that the upward trend in the rates which began in 1864 was not a continuation of an earlier trend in the same direction.
account of the simplicity of the economic and social organi-sation in this country, and because the decline started well within the period of more exact and detailed statistical record.
DIAGRAM 2.—SAORSTAT RURAL ECONOMY AND PHTHISIS,
1890 TO 1913.
As the annual mortality rates in the Saorstat fluctuated in an irregular manner round about 1900, it may be well to concentrate for the moment on smoothed data. -Quin-quennial averages of1 the phthisis rates graphed at the
middle year (e.g., 1888-92 at 1890) are graphed on diagram 2, with the three major indices of rural prosperity—the agricultural price index number (1911-13 = 100), the total produce in starch tons of crops (including hay), and the number of milch cows.
The following are the quinquennial mortality rates which are shown on the the diagram :—
Five years ending :
1892 1893 1894 1895 1896 1897 1898 1899
Phthisis mortality
per
100,000 1 9 6 1 9 8 1 9 9 1 9 9 1 9 5 1 9 6 1 9 7
I Q 8
Five years ending :
1900 1901 1902 1903 1904 1905 1906 1907
Phthisis mortality
per
100,000
2 0 2
2 0 7 2 0 7 2 0 8
2 1 1
2 0 8 2 0 5 2 0 4
Five years
ending :
1908 1909 1910 1911 1912 !9i3 1914 1915
Phthisis mortality
per
100,000
2 0 1
These rates show emphatically that 1902 must be regar-,ded as the peak year, after which the rate started to fall with a gathering momentum until 1913. From about 1896 onward the trends in prices, crop production, and the number of milch cows were all definitely upward. In addi-tion, the great Land Act of 1903 gave the farmers an in-creased spending power of perhaps several millions a year. ]t can, I think, safely be asserted that from the Famine to the present day there was no prolonged period during which the level of rural prosperity was so high and increasing at so rapid a rate as during those seventeen years before the outbreak of the European war.
The Women's National Health Association, under the leadership of the Countess of Aberdeen, did great and useful service principally in propaganda work against the disease. This association was inaugurated at a public meeting on the 13th March, 1907. It is necessary to point out, however, that the decline in the mortality from the disease had defi-nitely set in five years before this great organisation was started. The principal legislative measure against the disease was the Tuberculosis Prevention (Ireland) Act of 1908.*
The analysis in the previous paragraphs suggests (but does not prove) that the decline in the disease in Ireland at the beginning of the century received its first impetus either directly or indirectly from economic causes.
In the analysis of " time series " (but more commonly in the case of economic than of vital statistics) it is cus-tomary to distinguish between long-term and short-term trends. The long-term trends in the Saorstat phthisis rates have already been discussed. In order to bring the short-term (including the year to year) trends into relief the deviations from the quinquennial moving averages in the numbers of deaths from phthisis have been expressed as percentages of these moving averages, and the results shown in diagram 3. For example, the +0.3% at the year 1866 means that the 6,799 deaths from phthisis in 1866 in the present area of Saorstat Eireann exceeded the annual average number of deaths in 1864-68 (6,778) by 0.3%.
DIAGRAM 3.—PHTHISIS MORTALITY. DEVIATIONS FROM, AS PERCENTAGES OF, QUINQUENNIAL AVERAGES, 1866-1927.
These calculations bring out a rather curious periodicity in the series prior to 1900, i.e., during the period when the general trend in the rates was upward, but at a slow gradient. -Starting with the high point at the year 1867, it will be seen that from 1868 to 1896 there are four clearly-marked periods—from 1868 to 1874, from 1874 to 1881, from 1881 to 1888, and from 1888 to 1896, during each of which the trend may be described in the following terms— " steep fall, partial recovery, slight recession, rise." I do not wish to stress this matter unduly. It would appear to merit further study, and so the actual percentage deviations are given in Table 1.
Before proceeding to analyse the causes underlying the year-to-year changes in the phthisis mortality rate, it is essential to observe that year-to-year changes in "external" causes^ (weather, economic conditions, etc.) do affect the phthisis mortality to a very marked extent, and that the variation in the mortality from year to year cannot be attributed solely to the operation of the multiplicity of small causes which go by the name of Chance. For if chance only were operating we should find approximately the same mortality over a series of years, and the year to year variation from the mean annual mortality, if the indi-vidual's chance of dying of the disease were small, would be in the neighbourhood of V n (the " standard devia-tion ") where n is the mean annual mortality, and only about once in 20 years would twice this deviation be ex-ceeded, or about once in 360 years would it exceed 3 V n.
operation of external causes on the phthisis mortality rate by comparing the actual deviations with 2-y/n where n is the quinquennial moving average number of deaths, or the corresponding percentage deviations. It will be seen from diagram 3 that the deviations far exceed the limits (shown by dotted lines) allowed by the operation of chance, and in fact the limits are exceeded in 24 cases where the law of chance would allow only about 3 out of 62. Over the whole period the actual standard deviation, as found from the observations, is no less than 2.48 times the standard deviation which would be found if the year to year fluctu-ation were due solely to chance. We conclude that the effects of these external causes on the mortality from phthisis are quite substantial. It is interesting to note that a corresponding calculation for the mortality from cancer during the years 1883-1926 shows a ratio of 1.32 compared with the 2.48 in the case of phthisis. It follows that external causes also affect year to year changes in the mortality from cancer, but not to nearly so great an extent as they do from phthisis.
The first external causes which suggest themselves as affecting the year to year fluctuations in phthisis mortality are, of course, weather and economic conditions. Support-ing this view we perceive from diagram 3 that prior to 1900 the highest point in the series is at the year 1880, which obviously corresponds with the appalling weather condi-tions of 1879, the worst year since 1847, when agricultural prices were also bad. But as workers in this field are aware, it is difficult to devise a single statistic (a function of temperature, rainfall, hours of sun, etc.), which repre-sents " weather." The most convenient index in all the circumstances, both of weather and economic conditions, would appear to be the annual yield of crops. Working with the annual yield in starch lbs. per acre crops and pasture of corn crops, green crops, roots and hay (given in "Agricultural Statistics, 1847-1926," pp. 6-9), and calcu-lating the percentage deviations from trend, as in the case of phthisis mortality, it was found that the coefficient of correlation (r)* between these deviations and the phthisis
78 Mortality from Tuberculosis in Saorstdt Eireann deviations in the following year was —0.37, which is pro-bably significant, as it has been calculated from 60 obser-vations. If mortality data from phthisis had been avail-able by quarterly or monthly periods, it is probavail-able that the crop yields might be associated with twelve monthly phthisis mortality periods, so as to yield a higher negative correlation coefficient. In any case, we may conclude that year-to-year fluctuations in the- phthisis mortality rate are likely to follow variations in the opposite sense in crop yields one year previously, when both series have been divested of their long-term trends. It may be added that the correlation between crop yields and phthisis mortality in simultaneous years is not significant (r= -f-.003).
In the Dublin Registration Area the decline in the mor-tality from tuberculosis started definitely in 1901, i.e., about two years before the decline in the whole Saorstat. In a general way the year to year fluctuations in Dublin corres-pond with those for the rest of the Saorstat, for when the annual deviations from the five-yearly averages in the two areas were correlated for the years 1866 to 1926 a correla-tion coefficient r = +.44 was found.
The Dublin phthisis mortality statistics are available by quarters since 1864. Almost invariably the deaths regis-tered in the first and second quarters are high, and in the third and fourth quarters low. The question arises: if registrations in the first half-year are comparatively low, are they compensated by many deaths registered in the second half-year, or vice-versa? In other words, does a good half-year only postpone mortality from phthisis to the second half-year? To answer this question, deviations from the five-yearly averages were calculated separately for the first and second half-years, and correlated for the years 1866 to 1912. A correlation coefficient r = - . 1 2 was found, showing that if such a tendency exists it must be very slight.
IV.—AGES AT DEATH.
It is well known that in this country the tuberculoses mor-tality rate reaches a peak at the young1 adult aeres. This is
by no means a general feature of the disease, as the follow-ing table* shows:—
* Calculated from statistics published in the International Health
Year Book, 1Q28, published by the League of Nations, and in Annual
MORTALITY FROM TUBERCULOSIS PER 100,000 POPULATION IN EACH GROUP. M A L E S .
Country
Saorstat £irearm . Northern Ireland England and Wales Scotland Austria Sweden France U S. A. . . Canada Year 1925-7 1926 1924 1926 1925 1926 ti-ns 135 103 158 176 129 130 41 68 5 -45 44 34 41 39 43 39 11 23 10-47 44 28 38 33 47 HO 15 33 AGES 15-141 141 76 —— 2 0 -238 239 127 96 104 166 127 57 70 188 262 289 109 113 — 25-249 214 138 138 231 215 297 120 106 —.— 35-210 189 162 123 237 148 282 132 101 - 45-175 179 163 132 300 125 300 135 106 55-142 133 135 134 314 216 143 117 -— 6 5
-65 69 87 95 75-?,1 ?,5 30 4fi 289 140 156 171 134 82 134 105 All A pet, 146 142 111 106 193 146 199 87 82
If age at death be regarded as a criterion of type of tuberculosis, the foregoing* table (and diagram 4 con-structed from it) shows that the type of tuberculosis varies in the most extreme manner in the different countries tabu-lated. For instance, we note that the maximum rate (picked out in black type) is found at the age group 0-4 in Scotland, and at the age group 65-74 in the United States and Canada. In Saorstat Eireann and in Northern Ireland, where the types of tuberculosis are otherwise strikingly similar, the highest rate is reached at the young adult ages, and then recedes regularly to the latest age. In the United States the rates increase as regularly from the ages 5-9 to the age group 65-74. The Saorstat rate is second highest of the nine at age group 25-29, and lowest at ages 65 and over.
DIAGRAM 4.—MORTALITY FROM TUBERCULOSIS (ALL FORMS) PER 10,000 POPULATION IN EACH AGE GROUP IN FIVE COUNTRIES.
MALES.
s •
From the marked difference between the types of the disease in Ireland, which is largely rural, and England, which is largely a town-dwelling community, it was thought that similar differences might obtain between urban and rural types of the disease within the boundaries of the Saorstat. The following table shows that this is yevy markedly the case. The Saorstat rates have been calcu-lated from published data. The rates for the urban areas have been calculated from unpublished records in the General Register Office, to which I was kindly allowed access. Note that the following table refers to phthisis only, the foregoing to all forms of tuberculosis (phthisis rates not being available for all the countries).
MORTALITY FROM PHTHISIS PER 1*00,000 MALES AND FEMALES.
Saorstat Eireann Dublin Co. Boro: Three other C B ' s Dublin Extern *
Saorstat "£ireann Dublin Co. Boro' Three other CB.'s Dublin Extern*
Year
1925-7 1923-8
1925-7 1923-8
1 5
-105 159 143 140
182 243 188 141
2 0
-198 207 204 208
252 255 202
198
AOES 2 5
-M\
221 245 252 190
FEMA
233 221
281
167 3 5
-LES
183
340 326 214
LES.
182 208 252 120
4 5
-151 284 261 132
119 149 178 98
5 5
-83 195 133 88
53 111 96 51
All Ages
113 181 165 121
121 165 158 105 * Rathmines and Rithgar, Pembroke, Biackrock, and Dun Laoghaire Urban Distucts.
On account of the fewness of the deaths at the later ages it has been found convenient to use a single group for 55 years and over. It is quite clear that the types of phthisis in Dublin and the two urban groups of areas, both for males and females, are distinct from one another and from other Saorstat types. At the age group 20-24 the male rates are nearly the same in all four cases, whereas at ages 55 and over the rates range from 83 for the Saorstat to 195 for Dublin City. The male rates at all age groups are rather similar in Dublin and the aggregate of the three other Co. Boroughs. The rates for females are quite dissimilar.
DEATH RATES FROM PHTHISIS IN 1923-8 AS PER CENT, OF THE SAORSTAT (EXCLUDING THE CO. BOROUGHS) RATES. MALES AND
FEMALES.
Saorstat Iiireann (a) Dublin County "Wexford Cork County Mayo Donegal
AGES
0
-I O O 1 2 1 1 5 1 1 1 3
89
Q6
1 5
-1 0 0 95
1 3 1 1 0 1 98
1 1 3
4 5 -1 0 0 93
1 0 8 1 0 7
96 88
65-1 6 0 1 3 0 1 2 2 1 2 9
54
9 0
All ages
1 0 0 1 0 4 1 2 9 1 0 6 9 0 1 0 2
(a) Excluding Co. Boroughs.
The Wexford excess is most marked at the age group 0-14, when the phthisis rate was 51% over the Saorstat average, and the rates receded until the age group 65 and over, where the increase may be accidental, as the numbers of deaths on which it was based was only 20 in the six years. The figures indicate that in Wexford and Donegal the younger type of phthisis predominates. Probably if the figures were available for a more detailed age gradation the differences in types of the disease would be more pronounced in different parts of the country.
Reference may here be made to the remarkable theory which the late John Brownlee, M.D.* based on differences in the phthisis death rates by age groups in different parts of Great Britain. According to this theory these differ-ences indicated the presence of two or more distinct types of the disease. Having decided on three series of death rates by ages as characteristic of three separate types of the disease, called " young adult," " middle-age/"' .and "old-age" phthisis, the proportions in which the three types were present in various parts of England and Wales were determined. Dr. Brownlee inclined to the view that these types correspond with separate types of the infecting bacillus. What is most interesting is that Brownlee showed that these three types were quite distinct in their relations with associated phenomena. Thus he found that the amount of young adult phthisis was negatively correlated with the amount of middle-aged phthisis, or, in other words, where young adult phthisis occurs the middle-aged type is less likely to be found. Young adult and old-age phthisis, on the other hand, tend to occur in the same areas. He also found that in England young adult and old-age
phthisis vary independently of the hygienic surroundings, while middle-aged phthisis is closely related to the general standard of health. Where young adult phthisis occurred there was less tuberculosis amongst children aged 0-4. Another important result was that young adult phthisis was likely to occur in areas situated on boulder clay, a conclusion which we shall have occasion to consider later in connection with Co. Wexford. Brownlee used the Irish phthisis rates, 1891-1900 (with some modifications) as characteristic of young adult phthisis.
T!i(3 a: e type of phthisis in Ireland has undergone a
marked change with the passing of the years. The follow-ing table shows, in fact, the percentage declines in the rates between 1871-80 and 1925-7.
PERCENTAGE DECLINES IN ANNUAL AVERAGE PHTHISIS MORTALITY RATES BETWEEN 1871-80 AKD 1925-27 ALL IRELAND.
All Ages Males . .
Females
0
-11 32
5
-77 75
1 0
-68 55'
15-51 42
2 0
-43 26
25-46 31,
35-37 35
4 5
-34 44
55-51 62
6 5
-52 59
75-67 56
42 39
First of all it will be noted that at all the age groups with the highest phthisis mortality rates (ages 15-34) the declines in the male rates are much higher than the female. At the age groups 0-4 and 45-54, 55-64 and 65-74, the female per-centage declines exceed the male, and there is not much difference in the general rate—42% for males and 39% for females. There has been a marked movement towards an older type of phthisis amongst males, for we note that bo-tween the age groups 5-9 and 45-54 the declines range-in an unbroken sequence from 77% to 34%. The percentages for females vary irregularly. The declines range from 75% at the age group 5-9 to only 26% at the group 20-24.
Statistics of the mortality from phthisis amongst the Irish-born in Pennsylvania and New York# seem to have an
im-portant bearing on Dr. Brownlee's theory of different types of the disease.
DEATHS PER 100,000 FROM PHTHISIS AMONGST MALES IN 1910.
Died m Ireland Born in Ireland—
Died m Pennsylvania ... ,, ,, New York State Born in U.S.A.—
Died in Pennsylvania ... „ „ New York State
AGES
1 5
-1 7 0
4 2 8 3 1 2
6 1 1 0 2
20 — 3 2 1
1 2 8 327
148 2 1 6
25 —
3 1 0
376 663
185 352
45-64
2 0 2 4 0 9 6 8 2
174 2 6 2
The age types of the disease are totally different for deaths amongst the Irish-born in Ireland and in the United States, and the latter are quite different from the U.S.A.-born deaths. We note, in fact, that from age 20 the ratio of the rates of the Irish-born in U.S.A. to the corresponding rates for Ireland or for ILS.A.-born increases steeply with age. It is obviously environment and not race which deter-mines the type of disease.
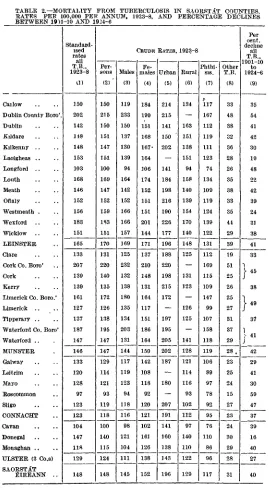
V.—MORTALITY IN SAORSTAT COUNTIES.
TABLE 2.—MORTALITY FTIOM TUBERCULOSIS IN SAORSTAT COUNTIES. RATES PER 100,000 PER ANNUM, 1923-8, AND PERCENTAGE DECLINES BETWEEN 1901-10 AND 1924-6
Cailow
Dublin County Boro' Dublin Kildare Kilkenny Laoigheas .. Longford Louth Meath Oftaly Westmeath . Wexford Wicklow LEINSTER Clare Cork Co. Boro' Cork Kerry
Limerick Co. Boro.' Limerick Tipperary .. Waterford Co. Boro' Waterford .. MUNSTER Galway Leitrim Mayo Roscommon Sligo CONNACHT Cavan Donegal Monaghan ULSTER (3 Co.s) SAORSTAT EIREANN .. Standard-ised rates all T.B., 1923-8 0 ) 150 202 142 148 148 153 103 168 146 152 156 183 151 165 133 207 139 139 161 127 137 187 147 146 133 120 128 97 123 123 104 147 118 129 148 Per-ons (2) 150 215 150 151 147 151 100 169 147 152 159 183 151 170 131 220 140 135 172 126 138 195 147 147 129 114 121 93 119 118 100 140 115 124 148 Males (3) 119 233 150 137 130 139 94 164 142 152 166 166 157 169 125 232 132 138 180 135 134 203 131 144 117 119 123 94 118 116 98 121 104 111 145 CRUDE Fe-males (4) 184 199 151 168 167' 164 106 174 152 151 151 201 144 171 137 210 148 131 164 117 151 186 164 150 142 108 118 92 120 121 102 161 126 138 152 RATSS. Urban (5) 214 215 141 150 202 _ 141 184 198 216 190 226 177 196 188 220 198 215 172 — 197 195 205 202 187 -180 -207 191 141 160 138 143 196 1923-8 Rural (6) 134 — 163 151 138 151 94 158 140 139 154 170 140 148 125 — 131 123 — 126 125 -141 128 121 114 116 93 102 112 97 140 110 122 129 Phthi-sis. (7) 117 167 112 119 111 123 74 134 109 119 124 139 122 131 112 169 115 109 147 99 107 158 118 119 106 89 97 78 92 95 76 110 86 96 117 Other T.B. (8) 33 48 38 32 36 28 26 35 38 33 35 41 29 39 19 51 25 26 25 27 31 37 29 28 , 23 25 24 15 27 23 24 30 29 28 31 Per decline all T.B., 1901-10 to 1924-6 (9) 35 54 41 42 30 19 48 22 42 39 24 31 38 41 33
j
4 ! >38
1
AQ;
«
37
} 4 1
In Table 2 will be found eight series of county mortality rates based on the experience of six years of these statistics. The standardised rates in column (1) were calculated by the " indirect " method.* Comparing columns (1) and (2) it will be seen that the corrections introduced by standardisa-tion into the crude rates are important in only a few cases, notably, in the County Boroughs, where there are propor-tionately large numbers of young adults amongst whom the ravages of the disease are most severe in this country. Outside of these,Leitrim, Mayo and Donegal (amongst whose population are large numbers of very young and old people not liable to die of the disease) are the only counties materially affected by standardisation. In view of the fact that all the remaining series of rates in the table are crude it is important to emphasise that the general picture pre-sented by the crude and standardised series of rates is the same in all essentials.
The highest (standardised) rates of mortality occur in Cork County Borough, 207; Dublin County Borough, 202; Waterford County Borough, 187; Wexford, 183; Louth, 168; Limerick County Borough, 161. We note that all the Lein-ster county rates (with the emphatic exception of Long-ford's, in this as in many other statistics, a " Connacht " county) and those of Waterford and Donegal are in excess of 140, while the rates for 'Connacht and Ulster (3 counties), except those for Galway and Donegal, do not exceed 130.
Comparing the male and female rates it is remarkable that the nine counties in which the relative excess for females is most marked include six in the south-east. In fact, the female rate per cent, of the male is highest in the following counties: Carlow, 155; Donegal, 133; Kilkenny, 128; Water-ford, 125; Kildare, 123; Galway, 121; Monaghan, 121; W ex-ford, 121; and Laoigheas, 119. While the very high excess may be due in some measure to the fewness of the deaths in the smallest county, the contiguity of the six south-eastern counties is evidently due to some definite cause. It will be noted that there is a well-marked male excess in each of the County Boroughs, most marked in Dublin.
The crude mortality in Saorstat urban districts is more
than 50% in excess of the rural mortality. In only two counties (Dublin, excluding Dublin County Borough, and Kildare) does the rural mortality exceed the urban. The im-portant fact also emerges that there is no apparent relation between urban and rural mortality from tuberculosis, for we note that in Lenister Minister and Connacht, where the rural rates vary widely, there is little or no difference in the urban rates. The urban rates, relatively to those in their rural areas, are worst in Sligo and Kerry. To Wexford belongs the melancholy distinction of having the highest urban and rural tuberculosis rates in the country.
MAPS 1 AND 2.—MORTALITY PER 100,000 PER ANNUM IN THE RURAL DISTRICTS OF IRISH COUNTIES FROM CONSUMPTION (1840)
AND FROM ALL FORMS OF TUBERCULOSIS (1923-8).
72111
HP
Map 2 shows that there is a remarkable homogeneity in the geographical distribution of the disease over large con-tiguous areas of the country. It will be seen that all- Ireland may from this point of view be parcelled out into four main areas: eleven eastern counties in which the rural rate is 140 or more; a midland and western group of nine counties com-prising the five Connacht counties, Longford and three Ulster counties, in which the rate does not exceed 121, and a northern and southern group of four and eight counties respectively, in each of wThich the rates are medium.
The high rates in the eastern littoral have often been com-mented upon, but perhaps it required these fully distributed mortality statistics to bring the other geographical features of the distribution into full relief.
The other map showing the mortality rates (compiled from statistics published in connection with the Census of 1841) from " consumption " in 1840 brings out the important fact that while the eastern phthisis rates were always high the general geographical distribution of mortality has undergone a marked change since 1840. The distribution is not nearly so homogeneous as in 1923-8 on account, perhaps, of the vast improvement in the quality of the statistics. In presenting the map and the rates which are shown on it, it- has been assumed that even if there was a bias in the statement of numbers or causes of death that it operated in the same manner in all counties. In those days there were seven counties in which the mortality from consumption in rural districts was far lower than in the remaining twenty-five counties: Mayo, 105; Donegal, 107; Derry, 122; Sligo, 128; Kerry, 133; Tyrone, 136; Clare, 139 ; Cork, 148. Since 1840 Donegal has fallen from the second to the twenty-first place in ascending order of mortality rates. The retardation in the improvement of the Donegal rate is borne out in Table 2, column (9), which shows that the Donegal rate declined by only 16 % between 1901-10 and 1924-6 compared with 40 % for the whole Saorstat. A special anti-tuberculosis " drive" is surely needed in this county.
The high mortality from tuberculosis on the east coast was observed and commented on at an early 'Stage in the records of vital statistics in this country. Thus the 1851 Census Commissioners wrote (Census of Ireland, 1851, Vol. V, Part T, page 448) :—
" But when we enter into a more minute examination of the subject we find some very remarkable irregulari-ties. Thus of the seaboard baronies the proportion of deaths registered under the head of pulmonary consump-tion to the total of all causes in those of the east coast, extending from the junction of the baronies of Forth and Bargy, in the county of Wexford, to Upper Glen-arm, in the county of Antrim, was as high as 1 in 5.88, possibly the result of the trying east winds which play upon this part of the island during a large portion of the year."
88 Mortality from Tuberculosis in Saorstdt fiireann These, for 1924-6, were obtained from the quarterly returns of the Registrar-General, which showed the numbers of deaths from tuberculosis as returned by the registrars. These had to be adjusted in a minor degree to allow for the slight discrepancy which always occurs between the quar-terly returns (which have to be issued promptly) and the definitive figures of the Registrar-General.
I had at first hoped to be able to relate these declines in mortality rates with the magnitude of the public health effort in the different counties or with the differential changes in the economic condition, etc., but found the task beyond my powers. It would be extremely valuable for future guidance in combating this or other diseases to be able to show that the counties which exhibit the greatest declines in mortality are just those counties in which the public health activities were most pronounced. Perhaps some enquirer with special knowledge will examine these statistics in this sense. At any rate, the counties showing the greatest improvements were Roseommon with a decline of 59 %, Dublin Co. Borough-with 54 %, Limerick County and Co. Borough 49 %, Longford 48 %. And (more impor-tant) the counties where the improvements were least marked were Donegal with 16 %, Laoigheas 19 %, Louth 2,2 %, and Westmeath 24 %.
In the 1928 Report of the Registrar-General the stan-dardised rates of mortality from all causes in the rural districts of each county in 1928 are given. It was found that the coefficient of correlation between these standardised rates and the crude tuberculosis rates in rural areas, 1923-28, was + .67. It follows that in rural areas where the general level of public healtlr is high there is relatively little tuberculosis, and vice versa. This is at variance with a result of Dr. Brownlee, who showed that in England there is no significant correlation between " young adult " phthisis (the predominant type in rural Ireland) and the general level of health.
VI.—TUBERCULOSIS IN WEXFORD.
In the former county there were 133 cattle to every 100 of country population in 1926, compared with 207 in the latter county; 43.7% of the rural population were living more than two persons to a room in Mayo compared with 13.6% in Wexford, and yet the tuberculosis rate in rural Mayo was only 116, compared with 170 per 100,000 in Wexford.
Of course, it is likely that within the boundaries of the county the poorer classes have a higher mortality rate. This is borne out by the rates in the rural portions of the four Superintendent Registrar's Districts in Wexford during the years 1923-28. The numbers on which these rates are based have been fully corrected for institutional deaths:—
Rural portion of— Enniscorthy S.R.D. Gorey ,, New Ross ,, ... Wexford „ ...
Total
Tuberculosis Mortality
per 100,000 per annum
165
1 6 2
167
1 8 2
1 7 0
Small farmers (1-15 acres) and relatives and agricultural labourers
living out as % of total in agriculture, 1926
3 2 2 9
3 0
4 3
34
TABLE 3.—DEATHS FROM TUBERCULOSIS (ALL FORMS) IN THE REGISTRAR'S DISTRICTS IN CO. WEXFORD, 1906-26.
Superintendent Registrar's District
and Registrar's District
Enniscorthy S.R.D. Clonroche Reg. D. Enniscorthy (w) ,, ,, Ferns ,, ,, Killann ,, ,, Newtownbarry ,, ,, Oulart „ ,, Gorey S R.D.
Camolm Reg. D. Coolgreany ,, ,, Gorey (w) ,, ,, Killenagh and
Wells
New Ross S.R.D. Carrickbyrne Reg. D. Fethard No. 1 ,, ,, Fethard No. 2 ,, ,, New Ross (w) ,, ,, Old Ross
Templeludigan ,, ,, Wexford S.RD.
Bannow Reg. D. Bridgetown ,, ,, Broadway ,, ,, Crossabeg ,, ,, Taghraon and
Glynn ,, ,, Wexford (w) ,, ,, Total of County ...
Total number of Deaths1 from
Tuberculosis 1906-26
As Recorded
1,294
137
7 0 6 1 0 8
1 1 2
1 0 5 1 2 6
631 1 0 6
7 0 3 1 2
143
907 1 1 6 89
1 0 3
433 1 2 1 45
1,661 9 2
165 *47
1 2 4
1 3 1 1,002
4>493
As Distributed
1,332
1 8 3
546 144
1 5 0 1 4 0 1 6 9
649
1 3 8 9 2
233
186
933 155
1 1 9 1 3 8 2 9 9 1 6 2 6 0
1,710
1 1 3
2 0 2
1 8 0 1 5 2 1 6 1
9 0 2 4,624 Annual Average per 100,000 of Population
2 0 7 2 0 4
234 2 2 2
2 0 4
176 166
2 0 3
2 0 1
1 6 3 1 9 3 2 5 1
2 1 0
1 8 2
197
2 2 9 2 4 0 2 1 3
158
254
1 6 1
2 0 9
1 9 6
295
2 5 1
3 0 1 2 2 2
Valuation of land per 100 acres of crops and pasture £ 52 49 63 50 . 39 43 6 1 58 48 54 6 2 67 54 45 6 0 53 99 , 58 46 65 6 2 66 73 6 2 5 2 84 57
(w) Registrar's District containing Workhouse.
have compiled the ideaths during the twenty-one yearsi, 1906-26, in each of these districts and show the results in table 3. It should be explained that these deaths referred, in the first instance, to deaths occurring within the borders of each district, i.e., institutional deaths were not allocated to the areas from which the deceased were admitted. These allocations were effected by deducting certain proportions of the deaths in the Reg. D.'s which contained the work-houses and distributing them over the constituent districts in each S,.R.D. I will not burthen this already long paper with a description of the methods by which these propor-tions were estimated: it may suffice to state that they were taken to be 23% for Bnniscorthy S.R.D., 21% for Gorey S.R.D., 23% for New Ross S.R.D. and 16% for Wexford S.R.D. Finally, as it was found that the Registrars7 returns
understated the total mortality from tuberculosis in Wex-ford (as given in the annual reports) by 131, or just 3%, during the twenty-one years all the Reg. D. rates were raised pro rata. The original and the adjusted statistics are shown in table 3. It is thought that the final figures adopted for the eighteen Reg. D 's, other than the four con-taining the workhouses, are fairly reliable. A certain doubt attaches to the latter on account of the substantial element of estimate.
As economic and climatic reasons do not appear to explain the high tuberculosis mortality in Wexford, it was thought that the quality of the soil might be a contributory cause. In England certain enquiries have been made into the relationship between subsoil and phthisis. Dr. Brown-lee* showed that there is a positive correlation (r= +.40) between the percentage of the total area of the Reg. D's in Norfolk and Suffolk lying upon boulder clay and the mortality from "young adult" phthisis in the years 1850-70, in other words, persons living on such areas were more likely to die of the disease. The result was confirmed in Essex.
MAP 3.—MORTALITY FROM TUBERCULOSIS (ALL FORMS) PER 100,000 PER ANNUM IN THE REGISTRARS' DISTRICTS OF CO.
WEXFORD, 1902-26, AND THE LITTORAL MARL AREA.
I discussed the possibility of applying Dr. Brownlee's method of enquiry to the Wexford problem with Mr. T. Hallissy, of the Geological Survey, who suggested that the famous marl areas of Wexford might furnish a suitable region for investigation. I am also indebted to Mr. Hallissy for mapping these areas on a |-inch Townland Index Map, from which the map on this page (which also shows the Reg. D. boundaries) was reproduced. With his permission I quote the following explanatory matter from his covering letter:—
district myself, I am satisfied that the boundaries are sufficiently accurate for all practical purposes. Unfor-tunately I cannot say the same for the remaining boun-daries. They are or more or less conjectural, having been drawn partly from my personal knowledge of the ground, and partly from inference based upon the dis-tribution of marl-holes, the run of the contours, notes on the original field maps, etc."
Confining our attention to the eight littoral Reg. D's traversed by marl, the map shows at a glance that the tuberculosis mortality rates are high where a large pro-portion of the area of the district lies over marl, and vice versa. For instance, Oulart, with a low mortality rate and a low proportion of marl area, lies between Crossabeg and Killenagh and Wells, with high rates and high propor-tions of marl area. The result is extremely striking when these proportions are expressed in figures. This was done roughly by drawing the boundaries on transparent paper, depositing the resulting map on 1-10-inch meshed squared paper and counting th£ squares. The following are the eight "marl " Reg. D.'s arranged in order of the proportion of marl area:—
Registrar's District
Crossabeg Broadway
Killenagh and Wells Wexford, rural Bridgetown Gorey Oulart Coolgreany
Approximate percentage of area on marl
94
9i 7i 52
49 43 35 32
Tuberculosis Mortality per
100,000, 1906-26
DIAGRAM 5.—PERCENTAGES OF AREA ON MARL AND TUBERCULOSIS MORTALITY RATES IN WEXFORD REGISTRAR'S DISTRICTS,
1906-26.
Percent
to-40V
°erceni of *ne&
&
r&te per (00,000
10
loo ISO 100 ISO 300
The Wexford rate is for the rural part (i.e., outside of Wexford U.D.) of the Reg. D. It will be seen that with the interesting exception of Broadway the mortality from tuberculosis follows exactly the same sequence as the pro-portion of area on marl, and as diagram 5 shows, the seven points graphing the two statistics almost lie on a straight line. Even if we could not account for the low Broadway rate, there could be no doubt that the marl has a dominat-ing influence on the mortality from tuberculosis in the lit-toral Reg. D. 's of Wexford.
That Broadway Reg. D. with a high proportion of the land lying on marl has a relatively low tuberculosis*mor-tality rate is probably due to the fact that here the marl is normally covered with from five to seven feet of drift containing many angular fragments of local rocks,* and therefore there is a better natural drainage. The valua-tion of the land in Broadway (£73 per 100 acres, crops and pasture, compared with £57 for all Wexford) is higher than in any other Wexford Reg. D. with the exception of New Ross and Wexford, both of which contain urban districts.
* Hallissy.—" On t h e Superficial Deposits of Co. Wexford."—The
VII.—MORTALITY FROM TUBERCULOSIS IN SAORSTAT TOWNS.
Table 4 shows the annual average rates of mortality from all forms of tuberculous disease during the twenty-one years 1906-26 in county boroughs and urban districts. In the compilation of these statistics deaths of persons which occurred in institutions situated within the boundaries of the towns but who were admitted from outside have been excluded. All the rates, therefore, understate the real mortality by an amount*which may, generally speaking, be presumed to be too small to affect the comparability of the statistics.
TABLE 4.—DEATHS FROM TUBERCULOSIS (ALL FORMS) IN
SAORSTAT COUNTY BOROUGHS AND URBAN DISTRICTS,
1906-26.
(Towns arranged in order of population m 1926. Institutional deaths of persons admitted from outside each town
boundary-Town
Dublin, C.B. ... Rathmmes and Rathgar Pembroke Blackrock Dun Laoghaire Dublin and 4 U.D.'s. Cork Limerick Waterford Galway Dundalk Drogheda Wexford Sligo Tralee Kilkenny Clonme] Bray Athlone Carlow Cobh Actual deaths in 21 years 2i,747 i,497 1,216 37O 676 25,506 5,49i 2,111 i,799 706 628 504 785 55o 635 5 7 i
482 268 367 327 442 Rate per 100,000 average popltn. per annum 333 183 185 185 178 297 337 258 3 i 7
245 2 2 0
1 9 0
319
2 3 2
2 9 0 264
238 156 233
2 2 6
275 Town Tipperary Enniscorthy Ennis Youghal Killarney Balhnasloe Dungarvan New Ross Tullamore Ballma Thurles Carrick-on-Suir Monaghan Mallow Arklow Nenagh Fermoy Castlebar Dalkey ... Howth Longford Navan Westport Athy Naas Birr are excluded). Actual deaths i n 21 years 268 349
2 2 8 2 9 0
349 136 244 3O4 346 244 154 34° ' 136 146 161 (a) 1 9 8 2 4 9 1 3 3 1 1 6
19 (b)
1 2 3 2 0 4 1 1 5 1 4 2
2 1 2 2 0 1
Rate per 100,000 average popltn. per annum
2 0 9 3 0 1 1 9 8 2 5 1 2 9 9 1 2 4 2 2 8
2 74 334 244 I57 3271 145 154 210 (a) 2 0 3 2 0 9
96 Mortality from Tuberculosis in Saofstdt fiireann
TABLE 4—Continued.
TOWN
Kilrush Cavan ... Wicklow Passage West . Cashel ... Listowel Clonakilty Kinsale Midleton Skibbereen Macroom Clones Buncrana
Actual deaths
i n
21 years 174
8 2 1 3 0
26 (c)
i n 198 1 3 1 234
144 155 1 2 5 66 36 (d)
Rate per
100,000
average popltn.
p e r annum
236 1 3 0 I Q 8
148 (c) 183 298 2 1 8 329
2 3 2 2 6 0 2 3 2 1 3 2
132 (d)
TOWN
Letterkenny Templemore Kells Killmey and
Bally brack. Carnckmacross Castleblayney ... Cootehill Bundoran Trim Belturbet Granard
Actual deaths
i n
21 years
9 0 59 82
79
68 48 39 12 (e) 52 38 35
Rate per
100,000
average popltn.
p e r annum
1 9 1 1 4 0 1 7 0
157
160
1 4 1
1 2 1
58 (e) 176 135 1 1 9
(a) 1911-26 ; (e) 1915-26.
The following are the twenty towns in which tuberculosis mortality exceeded 250 per 100,000 during the twenty-one years and the rates per 100,000:—Cork 337, Tullamore 334, Dublin 333, Kinsale 329, Carrick-on-Suir 327, Wexford 319, Watcrford 317, Enniscorthy 301, Killarney 299. Listowel 298, Tralee 290, Naas 277, Cobh"275, New Ross^/Kilkeimy 264, Skibbereen 260, Limerick 258, Birr 257, Navan 256, Youghal 251.
It will be noted that the three Wexford urban districts are amongst the number. It will also be noted that fourteen of the twenty towns are amongst the thirty-five largest and only six amongst the thirty-five smallest. There appears, therefore, on this rudimentary analysis, to be a relationship between size of town and mortality.
The following are the ten towns in which the rates during the twenty-one years did not exceed 150:—Granard 119, Cootehill 121, Ballinasloe 124, Cavan 130, Clones 132, Bel-turbet 135, Templemore 140, Castleblayney 141, Dalkey 144, Monaghan 145. It is extremely remarkable that six of the ten are situated in Cavan or Monaghan and that nine of the ten are inland towns.
97
only for the last few years, the following are the values of the coefficient of correlation between (a) the mortality rate from tuberculosis (all forms), and (b) percentage of persons living more than two persons per room; (c) persons per acre, and (d) the logarithm of the average population calculated for the remaining 63 towns. In the latter case the logarithm was used in preference to the absolute figure, on account of the unmanageably large variation in the magnitude of the latter. The following were the values of r:—
rab = + .29 (Housing).
r a c = -f .43 (Density of Population).
r a d = + .56 (Logarithm of Population).
It is remarkable that the most pronounced relationship is found between mortality from tuberculosis and population: the larger the town the more the tuberculosis. There is also a marked relationship between tuberculosis and density of population per acre, notwithstanding the fact that this latter statistic, as its wide range of variation from town to town shows, is very defective from the present point of view. It would appear that in many cases large areas of land outside the town proper are included in the area of the urban dis-trict. If the densities of the towns proper were available it is likely that a much higher coefficient would be obtained.
DIAGRAM 6.—MORTALITY FROM TUBERCULOSIS (ALL FORMS) AND HOUSING IN THE REGISTRARS7 DISTRICTS OF DUBLIN ClTY AND
IN THE URBAN DISTRICTS OF DUBLIN COUNTY, 1922-8.
7$
IS-98 Mortality from Tuberculosis in Saorstdt Eireann There is but little relationship between overcrowding and tuberculosis in Saorstat towns outside Dublin. Another striking result is that there is no correlation between density and overcrowding—in fact, rbc = + .08, so that the
correla-tion between tuberculosis and density and tuberculosis and housing are independent phenomena.
TABLE 5—MORTALITY FROM TUBERCULOSIS (ALL FORMS^ AND HOUSING IN THE REGISTRARS' DISTRICTS OF DUBLIN CITY AND IN THE URBAN DISTRICTS OF DUBLIN COUNTY, 1922-8.
City of Dublin
North City : No. i East ... No. i West ... No. 2 No. 3 Clontarf and
Howth (Pt.) Coolock and
Drumcondra (Pt.) Finglas and
Glasnevin (Pt.) South City, No. i , , , , , , 2 „ 3
>> }> >> 4
New Kilmainham
Tuber-culosis per
100,000
per annum
I Q 6 2 3 2 2 4 3 1 9 0
1 2 0
1 2 5
135
2 1 2
2 4 9 197 229 171
% living more
than 2 to a room
47 57 63 36 1 0 8
9
44
6 0 5 2
39
Urban Districts in Dublin County
Blackrock Dalkey
Dunlaoghaire ... Howth
Killmey and Bally brack. Pembroke Rathmines and
Rathgar.
Tuber-culosis per
100,000
per annum
1 5 0
1 2 1
144 8 2 1 5 2 1 4 0 1 4 2
% living more
than 2 to a
room
1 6 1 5 2 8
1 1
1 9 2 6 1 6
VIII.—OCCUPATIONAL MORTALITY.
The only statistics available on this matter are for the-Dublin Registration Area (i.e., the-Dublin City and the four adjoining urban districts) and these extend over a con-siderable period. Each of the Census abstracts of 1841, 1851, 1861 and 1871 show, in fair detail, the numbers of deaths by occupations and principal causes. The value of these statistics was considerably lessened by the curious fact that the numbers of persons living in Dublin were not tabulated by occupation at these remote Censuses, so that mortality rates could not be calculated.
p
sc 3 i I. n. 4 5 6 7 m. 8 9 10 11 12 13 IV. (less 15) H4 a 6 17 - 15Occupation or Social Position
Professional and Independent Middle Class
General body of officials Traders, business managers,
etc.
Others
Artisan Class and Petty Shop-^ keepers.
Working engineers, engravers, printers, wa+ dim akers, v lewellers.
~ Building and furnishing trades.
Clothing trades Foorl supply trades Other tiades Petty shopkeepers
General Service (except An'ny, police, posts, pubons? Cai drivers, vanmen Hankers, porters, laboureis, Domestic servants
Total (except workhouse inmates)
YFVRS 1901-10 Mortalit phtt (per 10 per an Crude (1) 102 171 107 120 104 249 270 234 236 180 301 184 291 212 27.i 305 129 226
y from f L1S1S i
0,000 lum) Standaid-lsed (2) 93 165 109 130 156 256 284 246 216 191 314 193 316 209 301 034 100 226 Moitahty from all causes (per 1,000 per annum) Standardised (3) 16 0 15.2 13 5 15.2 18 9 13 5 19.0 19 3 19.2 34.2 16.0 22.9 18.5 25.0 24 5 25.0 25.2 10.7 19.4 Percentage decline m phthisis mortality rates 1883-89 to 1908-14 (4) 41 44 44 62 44 30 44 34 19 46 27 13 30 44 30 29 27 31
The social or economic grade has a very considerable influence on mortality from phthisis, and in fact from the Registrar-General's grade I to grade 17 the standardised phthisis rate increases from 98 to 334. The range in the standardised mortality rates from all causes is not nearly so marked: from 13.5 to 25.2 per 1,000 population. As might be expected, the phthisis rate for domestic servants is more •closely akin to that of the grades in which they work than that to which they belong. Their general standardised mortality rate is also surprisingly low. The phthisis and general mortality rates for clerks are much higher than for others in their social grade. Comparing the rates in columns 2 and 3 we see that the proportion of deaths from phthisis to total deaths is highest in the clothing trades (10) and amongst engineers, etc. (8), and is lowest amongst the pro-iessional and independent classes.
in the quarter century which elapsed betAveen 1883-89 and .1908-14, generally speaking the greatest percentage declines have occurred in the higher grades, although within the grades the changes are irregular. The most substantial decline (62%) is in the families of traders, business mana-gers, etc. (5), and was least in the case of the clothing trades (10) with 19%. It will be noticed, however, that in all classes, without exception, considerable declines have occurred.
It has already been stated that mortality statistics of persons actually occupied are available for the years 1880 to 1882. Only in a few of the larger occupational groups were the deaths from phthisis sufficiently numerous in the three years to give any indications of how occupations affect mortality. The following were the occupations in which twenty deaths or more occurred in the three years.
DUBLIN REGISTRATION AREA 1880-2
Occupation
Bootmakers . . . Carpenters . . . Car, van drivers Clerks
Glaziers, <pamlors . . .
•Grocers, vintners and assistants Labourers
Milliners, dressmakers Pensioners . . . Police
Porters, messengers Printers . . . . . . Servants
Soldiers Tailors Teachers
No. of deaths ±rom phthisis
1880-2 3 2 3 0 48 1 3 0 3 i
2 2
194 65 4 2
2 0
66
3°
1 9 3 2 6 33 25
Rate per 100,000 population
p e r annum
3c 6
332 536 5 i 8 526 2 2 9 353 2 1 5 1,157
5 0 2 380 594 2 1 9 169 427 382
102 Mortality from Tuberculosis in Saorsidt Eireann For the reasons already explained, any deductions drawn from the last table must be tentative. It will suffice if it shows the necessity for an exhaustive enquiry into occupa-tional mortality for the whole Saorstat extending over a sufficient period of years to yield significant results.
IX.—SUMMARY.
The following are the more important points which emerge from this study:—
1. The Saorstat mortality rate in 1927 was the seventh worst on a list of twenty-four countries. Since before the European War tuberculosis has diminished in all countries for which statistics are available. The Saorstat rate of decline is well up to the, average.
2. The mortality from tuberculosis started to fall in 1902. The decline was arrested during the years of the European War, but recommenced in 1919. The annual aA^crage rate of decline since then is slower than before the Avar.
3. It is shown that the Saorstat age-type of tuberculosis is very different from what it is in other countries. Here the " young adult " type of disease predominates. There is also a considerable difference between the urban and rural types of disease within this country.
4. County rates during the past few years are analysed in detail. It is shown that all Ireland may be partitioned into four homogeneous tuberculosis zones: an castwn zone in which rates arc high, northern and southern zones in which rates arc medium, and <i .midland and western zone in which rates arc low.
5. The ravages of the disease arc worse in Wcxford than in any other Saorstat county. It is shown that the marl areas in Wexford exercise a dominating influence on the amount of tuberculosis in the littoral registrars' districts.
6. There is a high correlation between housing and tuber-culosis in Dublin City and in the urban districts of Dublin County. In other towns the correlation is not so marked. There is a high positive correlation between the tuberculosis mortality rate and the size of the town in Saorstat Eireann. 7. A brief enquiry into the occupational mortality from the disease in Dublin has shown that there is- a great dis-parity between the mortality rates in the richest and poorest classes. All classes have participated in the decline in mortality.
invaluable assistance in dealing with the relation of subsoil to tuberculosis in Wexford. My cordial thanks are also due to Mr. M. iD. McCarthy, B.A., of the Statistics Office, who, amongst other calculations, worked all the correla-tions, and to the officials of the General Register Office, whose advice in the use of, and guidance through, the official records was most useful to me.