UoW: Multi-task Learning Gaussian Process
for Semantic Textual Similarity
Miguel Rios
Research Group in Computational Linguistics University of Wolverhampton
Stafford Street, Wolverhampton, WV1 1SB, UK
Lucia Specia
Department of Computer Science University of Sheffield Regent Court, 211 Portobello,
Sheffield, S1 4DP, UK [email protected]
Abstract
We report results obtained by the UoW method in SemEval-2014’s Task 10 – Mul-tilingual Semantic Textual Similarity. We propose to model Semantic Textual Simi-larity in the context of Multi-task Learning in order to deal with inherent challenges of the task such as unbalanced performance across domains and the lack of training data for some domains (i.e. unknown domains). We show that the Multi-task Learning approach outperforms previous work on the 2012 dataset, achieves a ro-bust performance on the 2013 dataset and competitive results on the 2014 dataset. We highlight the importance of the chal-lenge of unknown domains, as it affects overall performance substantially.
1 Introduction
The task of Semantic Textual Similarity (STS) (Agirre et al., 2012) is aimed at measuring the degree of semantic equivalence between a pair of texts. Natural Language Processing (NLP) ap-plications such as Question Answering (Lin and Pantel, 2001), Text Summarisation (Lin and Hovy, 2003) and Information Retrieval (Park et al., 2005) rely heavily on the ability to measure semantic similarity between pairs of texts. The STS eval-uation campaign provides datasets that consist of pairs of sentences from different NLP domains such as paraphrasing, video paraphrasing, and ma-chine translation (MT) evaluation. The participat-ing systems are required to predict a graded simi-larity score from0to5, where a score of0means that the two sentences are on different topics and
This work is licensed under a Creative Commons At-tribution 4.0 International Licence. Page numbers and pro-ceedings footer are added by the organisers. Licence details: http://creativecommons.org/licenses/by/4.0/
a score of5means that the two sentences have ex-actly the same meaning.
Methods for STS are commonly based on com-puting various types of similarity metrics between the pair of sentences, where the similarity scores are used as features to train regression algorithms. B¨ar et al. (2012) use similarity metrics of vary-ing complexity. The range of features goes from simple string similarity metrics to complex vector space models. The method yielded the best av-erage results based on the official evaluation met-rics, despite not having achieved the best results in all individual domains. ˇSari´c et al. (2012) use a similar set up, extracting features from similarity metrics, where these features are based on word-overlap and syntax similarity. The method was among the best for domains related to paraphras-ing. It also achieved a high correlation between the training and test data. In contrast, for the ma-chine translation data the performance in the test set was lower than the one over the training data. A possible reason for the poor results on this do-main is the difference in length between the train-ing and test sentences, as in the test data the pairs tend to be short and share similar words. ˇSari´c et al. (2012) claim that these differences show that the MT training data is not representative of the test set given their choice of features.
Most of the participating systems in the STS challenges achieve good results on certain do-mains (i.e. STS datasets), but poor results on oth-ers. Even the most robust methods still show a big gap in performances for different datasets. In the second evaluation campaign of STS a new chal-lenge was proposed: domains for which no train-ing sets are provided, but only test sets. Heilman and Madnani (2013) propose to incorporate do-main adaptation techniques (Daum´e et al., 2010) for STS to generalise models to new domains. They add new features into the model, where the feature set contains domain specific features plus
general task features. The machine learning al-gorithm infers the extra weights of each specific domain and of the general domain. When an in-stance of a specific domain is to be predicted, only the copy of the features of that domain will be ac-tive; if the domain is unknown, the general fea-tures will be active. Severyn et al. (2013) pro-pose to use meta-classification to cope with do-main adaptation. They merge each pair into a sin-gle text and extract meta-features such as bag-of-words and syntactic similarity scores. The meta-classification model predicts, for each instance, its most likely domain based on these features.
A possible solution to alleviate unbalanced per-formances on different domains is to model STS in the context of Multi-task Learning (MTL). The motivation behind MTL is that by learning multi-ple related tasks simultaneously the model perfor-mance may improve compared to the case where the tasks are learnt separately. MTL is based on the assumption that related tasks can be clustered and inter-task correlations between tasks within the same cluster can be transferred.
We propose to model STS using MTL based on a state-of-the-art STS feature set (ˇSari´c et al., 2012). As algorithm we use a non-parametric Bayesian approach, namely Gaussian Processes (GP) (Rasmussen, 2006). We show that the MTL model outperforms previous work on the 2012 datasets and leads to robust performance on the 2013 datasets. On the STS 2014 challenge, our method shows competitive results.
2 Experimental Setting
We apply MTL to cope with the challenge of balanced performances across domains and un-known domains present in the STS datasets.
2.1 TakeLab Features
We use the features from one the top perform-ing system in STS 2012: the TakeLab1 system, which is publicly available. It extracts the follow-ing types of features:
N-gram overlap is the harmonic mean of the de-gree of matching between the first and second texts, and vice-versa. The overlap is com-puted for unigrams, bigrams, and trigrams.
WordNet-augmented word overlap is the par-tial WordNet path length similarity score
as-1http://takelab.fer.hr/sts/
signed to words that are not common to both texts.
Vector space sentence similarity is the repre-sentation of each text as a distributional vec-tor by summing the distributional (i.e., LSA) vectors of each word in the text and taking the cosine distance between these texts vectors.
Shallow NE similarity is the matching between Named Entities (NE) that indicates whether they were found in both texts.
Numbers overlap is an heuristic that penalises differences between numbers in texts. Altogether, these features make up a vector of 21 similarity scores.
2.2 Multi-task Gaussian Processes
Gaussian Processes (Rasmussen, 2006) is a Bayesian non-parametric machine learning frame-work based on kernels for regression and classifi-cation. In GP regression, for the inputsxwe want to learn a function f that is inferred from a GP prior:
f(x)∼GP(m(x), k(x, x0)), (1)
wherem(x)defines a 0 mean andk(x, x0)defines the covariance or kernel functions. In the single output case, the random variables are associated to a processf evaluated at different values of the inputx. In the multiple output case, the random variables are associated to different processes and evaluated at different values ofx.
We are interested in the intrinsic coregionaliza-tion model for GP. A coregionalizacoregionaliza-tion model is aheterotopicMTL model in which each output is associated with a different set of inputs. In our case the different set of inputs are the STS do-mains (i.e. datasets). The intrinsic coregionaliza-tion model (i.e. MTL-GP) is based on a separable multi-task kernel ( ´Alvarez et al., 2012) of the form
K(X, X) =B⊗k(X, X), (2)
where k(X, X) is a standard kernel over the in-put points and B is a positive semi-definite ma-trix encoding task covariances, called coregion-alization matrix. B is built from other matrices B =W W>+diag(k), whereW is a matrix that
(i.e. tasks) to behave independently. The repre-sentation of data points is augmented with task ids and given the id of a pair of data points the co-variance from the standard kernel between them is multiplied by a corresponding covariance from B, which modifies the data points’ covariance de-pending on whether they belong to the same task or different tasks.
The coregionalization matrix B allows us to control the amount of inter and intra task transfer of learning among tasks. Cohn and Specia (2013) propose different types of B matrices to model the problem of predicting the quality of machine translations. They developedBmatrices that rep-resent an explicit intra-task transfer to be a part of the parameterised kernel function. We use a de-faultB where the weights of the matrix are learnt along with the hyper-parameters by the GP tool.
For training our method we use the GPy toolkit2 with a combination of RBF and coregionalization kernels. The parameters used to build the core-gionalization matrix are the number of outputs to coregionalize and the rank of W. For example, in the 2012 training set, the number of outputs to coregionalize is 3, given that we have three tasks/domains. TheB matrix and the RBF kernel hyper-parameters are jointly optimised. Each in-stance of the training data is then augmented with the id of their corresponding task. During test-ing a new instance has to be matched to a specific task/domain id from the training data. In the case of an unknown test domain, we match it to a train-ing domain which is similar, given the description of the test dataset.
For the STS 2014 dataset, given the large num-ber of training instances, we train a sparse GP model within GPy. The main limitation of the GP model is the that memory demands grow O(n2), and the computational demands growO(n3), with nequals the number of training instances. Sparse methods (e.g. (Titsias, 2009)) try to overcome this limitation by constructing an approximation of the full model on a smaller set ofmsupport or induc-ing instances that allow the reduction of compu-tational demands toO(nm2). For the sparse GP we use the same combination of kernels as the full model, where we chose empirically the number of inducing instances m and the GP tool randomly selects the instances from the training data.
2https://github.com/SheffieldML/GPy
3 Results and Discussion
In what follows we show a comparison with previ-ous work on the STS 2012 and 2013 datasets, and the official results for English and Spanish STS 2014 datasets.
3.1 STS 2012 and STS 2013
For training we use the STS 2012 training datasets and we compare the results on the STS 2012 with publicly available systems and with the official Baseline, which is based on the cosine metric com-puted over word overlaps. The official evaluation metric is Pearson’s correlation. We match the un-known domain OnWN to MSRpar given that the domain of paraphrasing is that of news from the web, which potentially contains a broad enough vocabulary to cover OnWN.
Table 3.1 shows a comparison of the MTL-GP with previous work on the STS 2012 data, where our method outperforms them for most of the do-mains. Our method improves the results of Take-Lab with the same feature set. In other words, the transfer learning improves over (ˇSari´c et al., 2012), which is trained with a separate Support Vector Regression model for each domain. We note that we can only compare our method against the simpler version of TakeLab that is available. A different version using syntactic features was also proposed, where most results do not show a significant variation, except for an improvement of r=0.4683 in the SMTnews dataset. For the complete alternative results we refer the reader to (ˇSari´c et al., 2012).
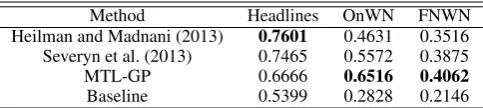
On the STS 2013 dataset, we compare our method with work based on domain adaptation and the official baseline. We use the 2012 data for training as no additional training data is provided in 2013. Table 3.1 shows all the possible match-ing combinations between the STS 2013 test sets and STS 2012 training sets. The best results are given by matching the STS 2013 test sets with the MSRvid domain, where all 2013 sets achieve their best results.
Method MSRpar MSRvid SMTeuroparl SMTnews OnWN ˇSari´c et al. (2012) 0.7343 0.8803 0.4771 0.3989 0.6797 B¨ar et al. (2012) 0.68 0.8739 0.5280 0.4937 0.6641
MTL-GP 0.7324 0.8877 0.5615 0.6053 0.7256
[image:4.595.76.289.658.730.2]Baseline 0.4334 0.2996 0.4542 0.3908 0.5864
Table 1: Comparison with previous work on the STS 2012 test datasets.
(Heilman and Madnani, 2013), domain adaptation is performed with the addition of extra features and the subsequent extra parameters to the model, where in the MTL-GP the transfer learning is done with the coregionalization matrix and does not de-pend on large amounts of data.
3.2 English STS 2014
The training dataset consists of the combination of each English training and test STS datasets from 2012 and 2013, which results in 7 domains. For testing, in our first run we matched similar do-mains with each other and the unknown domain with MSRpar. For our second run, we matched the unknown domains with a similar one. The domain matching (test/training) was done as fol-lows: deft-forum/MSRpar, deft-news/SMTnews, tweet-news/SMTnews and images/MSRvid. For our third run, the difference in matching is for deft-news/headlines and tweet-deft-news/headlines, where the other domains remain with the same match-ing. Table 3.2 shows the official STS 2014 results where our best method (i.e. run3) achieves rank 10.
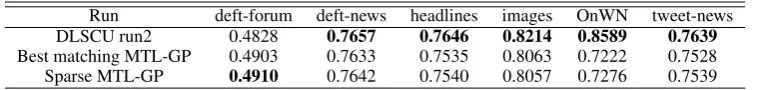
In Table 3.2, we show the comparison of the MTL-GP and the sparse MTL-GP with the best 2014 system (DLSCU run2). For both MTL meth-ods we match the 2014 domains with the train-ing domain headlines. For the sparse MTL-GP, we chose empirically a number m of 500 ran-domly induced points. For reference, the corre-lation of sparse MTL-GP with 50 points on deft-forum is r=0.4691 obtained in 0.23 hours, with 100 points, r=0.4895, with 500 points, r=0.4912, and with 1000 points, r=0.4911. The sparse
MTL-Test Train MSRvid MSRpar SMTeuroparl Headlines 0.6666 0.6595 0.5693
OnWN 0.6516 0.4635 0.4113
FNWN 0.4062 0.3217 0.2344
Table 2: Matching of new 2013 domains with 2012 training data.
GP with 500 points runs in 1.38 hours, compared to 2.39 hours for the full MTL-GP3. Addition-ally, the sparse version achieves similar results to the full model and very competitive performance compared to the best STS 2014 system. However, the result for OnWN is substantially lower than the best system. This result can be highly improved (r=0.7990) if the test set is matched with the cor-respondent training domain.
3.3 Spanish STS 2014
For the Spanish STS subtask we use both sim-ple and state-of-the-art (SoA) features to train the MTL-GP. The simple features are similarity scores from string metrics such as Levenshtein, Gotoh, Jaro, etc.4 The SoA similarity features come again from TakeLab. The training dataset consists of the combination of each English STS domains from 2012 and 2013 and the Spanish trial dataset with task-id matching each instance to a given domain. We represent the feature vectors with sparse fea-tures for the English and Spanish training datasets, where in English the pairs have simple and SoA features, and for Spanish, only the simple features. In other words, the feature vectors have the same number of features (34): 13 simple features and 21 SoA features. However, for Spanish the SoA fea-tures are set to 0 in training and testing. The moti-vation to use SoA and simple features in English is that the extra information will improve the transfer learning on the English domains and discriminate between the English domains and the Spanish do-main, which only contains simple features. For testing we only extracted the simple features; the SoA features were set to 0. For the coregionaliza-tion matrix we set the number of domains to be the English STS domains from 2012 and 2013, plus the Spanish trial, where the Spanish is treated as an additional domain, which results in 8 domains. In the first run of testing, we matched the test datasets to the Spanish domain, and in the second run we matched the datasets to the English MSRpar
Method Headlines OnWN FNWN Heilman and Madnani (2013) 0.7601 0.4631 0.3516 Severyn et al. (2013) 0.7465 0.5572 0.3875
MTL-GP 0.6666 0.6516 0.4062
[image:5.595.178.420.62.116.2]Baseline 0.5399 0.2828 0.2146
Table 3: Comparison between best matching MTL-GP (MSRvid) and previous work on the STS 2013 test datasets.
Run deft-forum deft-news headlines images OnWN tweet-news Weighted mean rank
UoW run1 0.3419 0.7512 0.7535 0.7763 0.7990 0.7368 0.7143 11
UoW run2 0.3419 0.5875 0.7535 0.7877 0.7990 0.6281 0.6817 17
UoW run3 0.3419 0.7634 0.7535 0.7877 0.7990 0.7529 0.7207 10
Table 4: Official English STS 2014 results.
main. Table 3.3 shows the official results for the Spanish subtask, where our method achieves com-petitive performance, placed 7 in the systems rank-ing. We only show the results for the first run as both runs achieved the same performance.
Run Wikipedia News Weighted
mean rank
UoW 0.7483 0.8001 0.7792 7
Table 6: Official Spanish STS 2014 results.
Table 3.3 shows the comparison of the best Spanish STS 2014 system (UMCC DLSI run2) against two different sparse MTL-GP matched with the Spanish trial with 500 inducing points. Sparse MTL-GP run1 uses the sparse features de-scribed above, while run2 uses a modification of the feature set consisting in specific features for each type of domain. For the English domains the simple features are set to 0, and for Spanish the SoA are still set to 0. The difference between sparse MTL-GP models is very small, where the use of all the features on the English domains im-proves the results. However, the performance of both models is still substantially lower than that of the best system.
Run Wikipedia News
UMCC DLSI run2 0.7802 0.8254 Sparse MTL-GP run1 0.7468 0.7959 Sparse MTL-GP run2 0.7380 0.7878
Table 7: Comparison of best system against sparse MTL-GP STS 2014 results.
4 Conclusions
We propose the use of MTL for STS. We show that MTL improves the results of one of the best STS systems, TakeLab. However, the
match-ing of an unknown domain durmatch-ing testmatch-ing proved a key challenge that affects performance signifi-cantly. Given the results of STS 2013 and 2014, our method tends to achieve best results when known/unknown domains are matched to the same training domains (i.e.MSRparfor 2013 and head-linesfor 2014). The sparse MTL-GP shows sim-ilar performance to the full GP model, but takes half the time to be trained. In the Spanish subtask, we train our method with English datasets and the Spanish trial data as an additional domain. For this subtask our method also shows competitive re-sults. Future work involves the automatic match-ing of unknown domains at test time via meta-classification (Severyn et al., 2013).
Acknowledgments
This work was supported by the Mexican National Council for Science and Technology (CONA-CYT), scholarship reference 309261, and by the QTLaunchPad (EU FP7 CSA No. 296347) project.
References
Eneko Agirre, Mona Diab, Daniel Cer, and Aitor Gonzalez-Agirre. 2012. Semeval-2012 task 6: A pilot on semantic textual similarity. InProceedings of the First Joint Conference on Lexical and Com-putational Semantics, SemEval ’12, pages 385–393, Stroudsburg, PA, USA.
Mauricio A. ´Alvarez, Lorenzo Rosasco, and Neil D. Lawrence. 2012. Kernels for vector-valued func-tions: A review. Found. Trends Mach. Learn., 4(3):195–266, March.
[image:5.595.94.508.161.205.2]Run deft-forum deft-news headlines images OnWN tweet-news DLSCU run2 0.4828 0.7657 0.7646 0.8214 0.8589 0.7639
[image:6.595.111.491.62.107.2]Best matching MTL-GP 0.4903 0.7633 0.7535 0.8063 0.7222 0.7528 Sparse MTL-GP 0.4910 0.7642 0.7540 0.8057 0.7276 0.7539
Table 5: Comparison between best matching MTL-GP (headlines), Sparse MTL-GP and best STS 2014 system.
Joint Conference on Lexical and Computational Se-mantics, SemEval ’12, pages 435–440, Stroudsburg, PA, USA.
Trevor Cohn and Lucia Specia. 2013. Modelling an-notator bias with multi-task gaussian processes: An application to machine translation quality estima-tion. In51st Annual Meeting of the Association for Computational Linguistics, ACL-2013, pages 32– 42, Sofia, Bulgaria.
Hal Daum´e, III, Abhishek Kumar, and Avishek Saha. 2010. Frustratingly easy semi-supervised domain adaptation. In Proceedings of the 2010 Workshop on Domain Adaptation for Natural Language Pro-cessing, DANLP 2010, pages 53–59, Stroudsburg, PA, USA.
Michael Heilman and Nitin Madnani. 2013. Henry-core: Domain adaptation and stacking for text simi-larity. In Second Joint Conference on Lexical and Computational Semantics (*SEM), pages 96–102, Atlanta, Georgia, USA, June.
Chin-Yew Lin and Eduard Hovy. 2003. Auto-matic evaluation of summaries using n-gram co-occurrence statistics. In Proceedings of the 2003 Conference of the North American Chapter of the Association for Computational Linguistics on Hu-man Language Technology - Volume 1, NAACL ’03, pages 71–78, Stroudsburg, PA, USA.
Dekang Lin and Patrick Pantel. 2001. Discovery of inference rules for question-answering. Nat. Lang. Eng., 7(4):343–360.
Eui-Kyu Park, Dong-Yul Ra, and Myung-Gil Jang. 2005. Techniques for improving web retrieval effec-tiveness. Inf. Process. Manage., 41(5):1207–1223. Carl Edward Rasmussen. 2006. Gaussian processes
for machine learning. MIT Press.
Aliaksei Severyn, Massimo Nicosia, and Alessandro Moschitti. 2013. ikernels-core: Tree kernel learning for textual similarity. In Second Joint Conference on Lexical and Computational Semantics (*SEM), pages 53–58, Atlanta, Georgia, USA, June.
Michalis Titsias. 2009. Variational Learning of Induc-ing Variables in Sparse Gaussian Processes. Inthe 12th International Conference on Artificial Intelli-gence and Statistics (AISTATS).
Frane ˇSari´c, Goran Glavaˇs, Mladen Karan, Jan ˇSnajder, and Bojana Dalbelo Baˇsi´c. 2012. Takelab: Systems