*SEM 2013 shared task: Semantic Textual Similarity
Eneko Agirre University of the Basque Country
Daniel Cer Stanford University [email protected]
Mona Diab George Washington University
Aitor Gonzalez-Agirre University of the Basque Country
Weiwei Guo Columbia University
Abstract
In Semantic Textual Similarity (STS), sys-tems rate the degree of semantic equivalence, on a graded scale from 0 to 5, with 5 be-ing the most similar. This year we set up two tasks: (i) a core task (CORE), and (ii) a typed-similarity task (TYPED). CORE is similar in set up to SemEval STS 2012 task with pairs of sentences from sources related to those of 2012, yet different in genre from the 2012 set, namely, this year we included newswire headlines, machine translation eval-uation datasets and multiple lexical resource glossed sets. TYPED, on the other hand, is novel and tries to characterize why two items are deemed similar, using cultural heritage items which are described with metadata such as title, author or description. Several types of similarity have been defined, including simi-lar author, simisimi-lar time period or simisimi-lar lo-cation. The annotation for both tasks lever-ages crowdsourcing, with relative high inter-annotator correlation, ranging from 62% to 87%. The CORE task attracted 34 participants with 89 runs, and the TYPED task attracted 6 teams with 14 runs.
1 Introduction
Given two snippets of text, Semantic Textual Simi-larity (STS) captures the notion that some texts are more similar than others, measuring the degree of semantic equivalence. Textual similarity can range from exact semantic equivalence to complete un-relatedness, corresponding to quantified values be-tween 5 and 0. The graded similarity intuitively cap-tures the notion of intermediate shades of similarity
such as pairs of text differ only in some minor nu-anced aspects of meaning only, to relatively impor-tant differences in meaning, to sharing only some details, or to simply being related to the same topic, as shown in Figure 1.
One of the goals of the STS task is to create a unified framework for combining several semantic components that otherwise have historically tended to be evaluated independently and without character-ization of impact on NLP applications. By providing such a framework, STS will allow for an extrinsic evaluation for these modules. Moreover, this STS framework itself could in turn be evaluated intrin-sically and extrinintrin-sically as a grey/black box within various NLP applications such as Machine Trans-lation (MT), Summarization, Generation, Question Answering (QA), etc.
STS is related to both Textual Entailment (TE) and Paraphrasing, but differs in a number of ways and it is more directly applicable to a number of NLP tasks. STS is different from TE inasmuch as it as-sumes bidirectional graded equivalence between the pair of textual snippets. In the case of TE the equiv-alence is directional, e.g. a car is a vehicle, but a ve-hicle is not necessarily a car. STS also differs from both TE and Paraphrasing (in as far as both tasks have been defined to date in the literature) in that, rather than being a binary yes/no decision (e.g.a ve-hicle is not a car), we define STS to be a graded sim-ilarity notion (e.g.a vehicleanda carare more sim-ilar thana wave anda car). A quantifiable graded bidirectional notion of textual similarity is useful for a myriad of NLP tasks such as MT evaluation, infor-mation extraction, question answering, summariza-tion, etc.
• (5) The two sentences are completely equivalent, as they mean the same thing.
The bird is bathing in the sink.
Birdie is washing itself in the water basin.
• (4) The two sentences are mostly equivalent, but some unimportant details differ.
In May 2010, the troops attempted to invade Kabul. The US army invaded Kabul on May 7th last year, 2010.
• (3) The two sentences are roughly equivalent, but some important information differs/missing.
John said he is considered a witness but not a suspect. ”He is not a suspect anymore.” John said.
• (2) The two sentences are not equivalent, but share some details.
They flew out of the nest in groups. They flew into the nest together.
• (1) The two sentences are not equivalent, but are on the same topic.
The woman is playing the violin.
The young lady enjoys listening to the guitar. • (0) The two sentences are on different topics.
John went horse back riding at dawn with a whole group of friends.
Sunrise at dawn is a magnificent view to take in if you wake up early enough for it.
Figure 1: Annotation values with explanations and examples for the core STS task.
In 2012 we held the first pilot task at SemEval 2012, as part of the *SEM 2012 conference, with great success: 35 teams participated with 88 sys-tem runs (Agirre et al., 2012). In addition, we held a DARPA sponsored workshop at Columbia Uni-versity1. In 2013, STS was selected as the official Shared Task of the *SEM 2013 conference. Ac-cordingly, in STS 2013, we set up two tasks: The core taskCORE, which is similar to the 2012 task; and a pilot task on typed-similarityTYPEDbetween semi-structured records.
For CORE, we provided all the STS 2012 data as training data, and the test data was drawn from related but different datasets. This is in contrast to the STS 2012 task where the train/test data were drawn from the same datasets. The 2012 datasets comprised the following: pairs of sentences from paraphrase datasets from news and video elic-itation (MSRpar and MSRvid), machine transla-tion evaluatransla-tion data (SMTeuroparl, SMTnews) and pairs of glosses (OnWN). The current STS 2013 dataset comprises the following: pairs of news head-lines, SMT evaluation sentences (SMT) and pairs of glosses (OnWN and FNWN).
The typed-similarity pilot task TYPED attempts
1
http://www.cs.columbia.edu/˜weiwei/ workshop/
to characterize, for the first time, thereasonand/or
typeof similarity. STS reduces the problem of judg-ing similarity to a sjudg-ingle number, but, in some appli-cations, it is important to characterize why and how two items are deemed similar, hence the added nu-ance. The dataset comprises pairs of Cultural Her-itage items from Europeana,2 a single access point to millions of books, paintings, films, museum ob-jects and archival records that have been digitized throughout Europe. It is an authoritative source of information coming from European cultural and sci-entific institutions. Typically, the items comprise meta-data describing a cultural heritage item and, sometimes, a thumbnail of the item itself.
Participating systems in the TYPED task need to compute the similarity between items, using the tex-tual meta-data. In addition to general similarity, par-ticipants need to score specific kinds of similarity, like similar author, similar time period, etc. (cf. Fig-ure 3).
The paper is structured as follows. Section 2 re-ports the sources of the texts used in the two tasks. Section 3 details the annotation procedure. Section 4 presents the evaluation of the systems, followed by the results of CORE and TYPED tasks. Section 6 draws on some conclusions and forward projections.
Figure 2: Annotation instructions for CORE task
year dataset pairs source
2012 MSRpar 1500 news
2012 MSRvid 1500 videos
2012 OnWN 750 glosses
2012 SMTnews 750 MT eval. 2012 SMTeuroparl 750 MT eval.
2013 HDL 750 news
2013 FNWN 189 glosses
2013 OnWN 561 glosses
2013 SMT 750 MT eval.
2013 TYPED 1500 Cultural Heritage items
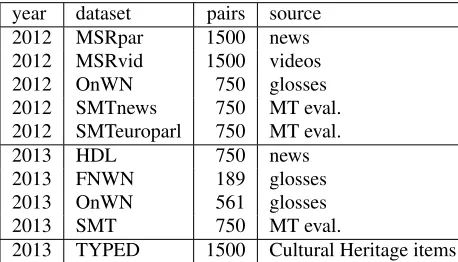
Table 1: Summary of STS 2012 and 2013 datasets.
2 Source Datasets
Table 1 summarizes the 2012 and 2013 datasets.
2.1 CORE task
The CORE dataset comprises pairs of news head-lines (HDL), MT evaluation sentences (SMT) and pairs of glosses (OnWN and FNWN).
For HDL, we used naturally occurring news head-lines gathered by the Europe Media Monitor (EMM) engine (Best et al., 2005) from several different news sources. EMM clusters together related news. Our goal was to generate a balanced data set across the
Figure 3: Annotation instructions for TYPED task
vs. machine translation. b. reference vs. Finite State Transducer (FST) generated translation (Dreyer and Marcu, 2012). c. machine translation vs. FST gen-erated translation. The HYTER data set is used in (Dreyer and Marcu, 2012).
The OnWN/FnWN dataset contains gloss pairs from two sources: OntoNotes-WordNet (OnWN) and FrameNet-WordNet (FnWN). These pairs are sampled based on the string similarity ranging from 0.4 to 0.9. String similarity is used to measure the similarity between a pair of glosses. The OnWN subset comprises 561 gloss pairs from OntoNotes 4.0 (Hovy et al., 2006) and WordNet 3.0 (Fellbaum, 1998). 370 out of the 561 pairs are sampled from the 110K sense-mapped pairs as made available from the authors. The rest, 291 pairs, are sampled from unmapped sense pairs with a string similarity rang-ing from 0.5 to 0.9. The FnWN subset has 189 manually mapped pairs of senses from FrameNet 1.5 (Baker et al., 1998) to WordNet 3.1. They are
ran-domly selected from 426 mapped pairs. In combi-nation, both datasets comprise 750 pairs of glosses.
2.2 Typed-similarity TYPED task
This task is devised in the context of the PATHS project,3 which aims to assist users in accessing digital libraries looking for items. The project tests methods that offer suggestions about items that might be useful to recommend, to assist in the inter-pretation of the items, and to support the user in the discovery and exploration of the collections. Hence the task is about comparing pairs of items. The pairs are generated in the Europeana project.
A study in the PATHS project suggested that users would be interested in knowing why the system is suggesting related items. The study suggested seven similarity types: similar author or creator, similar people involved, similar time period, similar
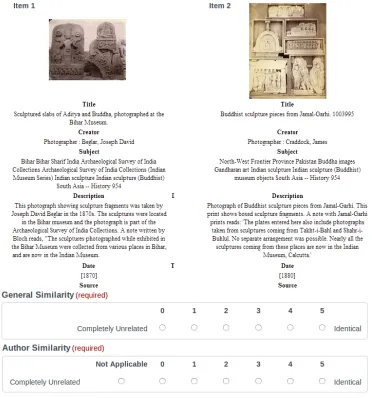
Figure 4: TYPED pair on our survey. Onlygeneralandauthorsimilarity types are shown.
tion, similar event or action, similar subject and sim-ilar description. In addition, we also includegeneral
similarity. Figure 3 shows the definition of each sim-ilarity type as provided to the annotators.
The dataset is generated in semi-automatically. First, members of the project manually select 25 pairs of items for each of the 7 similarity types (ex-cluding general similarity), totalling 175 manually selected pairs. After removing duplicates and clean-ing the dataset, we got 163 pairs. Second, we use these manually selected pairs as seeds to automat-ically select new pairs as follows: Starting from those seeds, we use the Europeana API to get similar items, and we repeat this process 5 times in order to diverge from the original items (we stored the
vis-ited items to avoid looping). Once removed from the seed set, we select the new pairs following two approaches:
• Distance 1: Current item and similar item.
• Distance 2: Current item and an item that is similar to a similar item (twice removed dis-tance wise)
This yields 892 pairs for Distance 1 and 445 of Distance 2. We then divide the data into train and test, preserving the ratios. The train data contains 82 manually selected pairs, 446 pairs with similarity distance 1 and 222 pairs with similarity distance 2. The test data follows a similar distribution.
Europeana API to access and extract the correspond-ing metadata in JSON format and a thumbnail. In addition, the textual fields which are relevant for the task are made accessible in text files, as follows:
• dcTitle: title of the item
• dcSubject: list of subject terms (from some vo-cabulary)
• dcDescription: textual description of the item
• dcCreator: creator(s) of the item
• dcDate: date(s) of the item
• dcSource: source of the item
3 Annotation
3.1 CORE task
Figure 1 shows the explanations and values for each score between 5 and 0. We use the Crowd-Flower crowd-sourcing service to annotate the CORE dataset. Annotators are presented with the detailed instructions given in Figure 2 and are asked to label each STS sentence pair on our 6 point scale using a dropdown box. Five sentence pairs at a time are presented to annotators. Annotators are paid 0.20 cents per set of 5 annotations and we collect 5 separate annotations per sentence pair. Annota-tors are restricted to people from the following coun-tries: Australia, Canada, India, New Zealand, UK, and US.
To obtain high quality annotations, we create a representative gold dataset of 105 pairs that are mually annotated by the task organizers. During an-notation, one gold pair is included in each set of 5 sentence pairs. Crowd annotators are required to rate 4 of the gold pairs correct to qualify to work on the task. Gold pairs are not distinguished in any way from the non-gold pairs. If the gold pairs are annotated incorrectly, annotators are told what the correct annotation is and they are given an explana-tion of why. CrowdFlower automatically stops low performing annotators – those with too many incor-rectly labeled gold pairs – from working on the task. The distribution of scores in the headlines HDL dataset is uniform, as in FNWN and OnWN, al-though the scores are slightly lower in FNWN and slightly higher in OnWN. The scores for SMT are not uniform, with most of the scores uniformly dis-tributed between 3.5 and 5, a few pairs between 2 and 3.5, and nearly no pairs with values below 2.
3.2 TYPED task
The dataset is annotated using crowdsourcing. The survey contains the 1500 pairs of the dataset (750 for train and 750 for test), plus 20 gold pairs for quality control. Each participant is shown 4 training gold questions at the beginning, and then one gold every 2 or 4 questions depending on the accuracy. If accu-racy dropped to less than 66.7% percent the survey is stopped and the answers from that particular an-notator are discarded. Each anan-notator is allowed to rate a maximum of 20 pairs to avoid getting answers from people that are either tired or bored. To ensure a good comprehension of the items, the task is re-stricted to only accept annotators from some English speaking countries: UK, USA, Australia, Canada and New Zealand.
Participants are asked to rate the similarity be-tween pairs of cultural heritage items from rang-ing from 5 to 0, followrang-ing the instructions shown in Figure 3. We also add a ”Not Applicable” choice for cases in which annotators are not sure or didn’t know. For those cases, we calculate the similarity score using the values of the rest of the annotators (if none, we convert it to 0). The instructions given to the annotators are the ones shown in Figure 3. Fig-ure 4 shows a pair from the dataset, as presented to annotators.
The similarity scores for the pairs follow a similar distribution in all types. Most of the pairs have a score between 4 and 5, which can amount to as much as 50% of all pairs in some types.
3.3 Quality of annotation
In order to assess the annotation quality, we measure the correlation of each annotator with the average of the rest of the annotators. We then averaged all the correlations. This method to estimate the quality is identical to the method used for evaluation (see Sec-tion 4.1) and it can be thus used as the upper bound for the systems. The inter-tagger correlation in the CORE dataset for each of dataset is as follows:
• HDL: 85.0%
• FNWN: 69.9%
• OnWN: 87.2%
• SMT: 65.8%
For the TYPED dataset, the inter-tagger correla-tion values for each type of similarity is as follows:
• Author: 73.1%
• People Involved: 62.5%
• Time period: 72.0%
• Location: 74.3%
• Event or Action: 63.9%
• Subject: 74.5%
• Description: 74.9%
In both datasets, the correlation figures are high, confirming that the task is well designed. The weak-est correlations in the CORE task are SMT and FNWN. The first might reflect the fact that some automatically produced translations are confusing or difficult to understand, and the second could be caused by the special style used to gloss FrameNet concepts. In the TYPED task the weakest correla-tions are for thePeople InvolvedandEvent or Action
types, as they might be the most difficult to spot.
4 Systems Evaluation
4.1 Evaluation metrics
Evaluation of STS is still an open issue. STS ex-periments have traditionally used Pearson product-moment correlation, or, alternatively, Spearman rank order correlation. In addition, we also need a method to aggregate the results from each dataset into an overall score. The analysis performed in (Agirre and Amig´o, In prep) shows that Pearson and averaging across datasets are the best suited com-bination in general. In particular, Pearson is more informative than Spearman, in that Spearman only takes the rank differences into account, while Pear-son does account for value differences as well. The study also showed that other alternatives need to be considered, depending on the requirements of the target application.
We leave application-dependent evaluations for future work, and focus on average weighted Pear-son correlation. When averaging, we weight each individual correlation by the size of the dataset. In addition, participants in the CORE task are al-lowed to provide a confidence score between 1 and 100 for each of their scores. The evaluation script down-weights the pairs with low confidence, follow-ing weighted Pearson.4 In order to compute sta-tistical significance among system results, we use
4http://en.wikipedia.org/wiki/Pearson_
product-moment_correlation_coefficient# Calculating_a_weighted_correlation
a one-tailed parametric test based on Fisher’s z-transformation (Press et al., 2002, equation 14.5.10).
4.2 The Baseline Systems
For the CORE dataset, we produce scores using a simple word overlap baseline system. We tokenize the input sentences splitting at white spaces, and then represent each sentence as a vector in the mul-tidimensional token space. Each dimension has 1 if the token is present in the sentence, 0 otherwise. Vector similarity is computed using the cosine sim-ilarity metric. We also run two freely available sys-tems, DKPro (Bar et al., 2012) and TakeLab ( ˇSari´c et al., 2012) from STS 2012,5and evaluate them on the CORE dataset. They serve as two strong contenders since they ranked 1st (DKPro) and 2nd (TakeLab) in last year’s STS task.
For the TYPED dataset, we first produce XML files for each of the items, using the fields as pro-vided to participants. Then we run named entity recognition and classification (NERC) and date de-tection using Stanford CoreNLP. This is followed by calculating the similarity score for each of the types as follows.
• General: cosine similarity of TF-IDF vectors of tokens from all fields.
• Author: cosine similarity of TF-IDF vectors for dc:Creator field.
• People involved, time period and location: cosine similarity of TF-IDF vectors of loca-tion/date/people recognized by NERC in all fields.
• Events: cosine similarity of TF-IDF vectors of verbs in all fields.
• Subject and description: cosine similarity of TF-IDF vectors of respective fields.
IDF values are calculated from a subset of the Europeana collection (Culture Grid collection). We also run a random baseline several times, yielding close to 0 correlations in all datasets, as expected.
4.3 Participation
Participants could send a maximum of three system runs. After downloading the test datasets, they had a maximum of 120 hours to upload the results. 34 teams participated in the CORE task, submitting 89
5
Team and run Head. OnWN FNWN SMT Mean # Team and run Head. OnWN FNWN SMT Mean # baseline-tokencos .5399 .2828 .2146 .2861 .3639 73 KnCe2013-all .3475 .3505 .1073 .1551 .2639 86 DKPro .7347 .7345 .3405 .3256 .5652 - KnCe2013-diff .4028 .3537 .1284 .1804 .2934 84 TakeLab-best .6559 .6334 .4052 .3389 .5221 - KnCe2013-set .0462 -.1526 .0376 -.0605 -.0397 90 TakeLab-sts12 .4858 .6334 .2693 .2787 .4340 - LCL Sapienza-ADW1 .6943 .4661 .3571 .3311 .4880 43 aolney-w3c3 .5248 .4701 .1777 .2744 .3986 67 LCL Sapienza-ADW2 .6520 .5280 .3598 .3681 .5019 32 BGU-1 .5075 .3252 .0768 .1843 .3181 81 LCL Sapienza-ADW3 .6205 .5108 .4462 .3838 .4996 34 BGU-2 .3608 .3777 -.0173 .0698 .2363 88 LIPN-tAll .7063 .6937 .4037 .3005 .5425 16 BGU-3 .3591 .3360 .0072 .2122 .2748 85 LIPN-tSp .5791 .7199 .3522 .3721 .5261 24 BUAP-RUN1 .5005 .2579 .1766 .2322 .3234 78 MayoClinicNLP-r1wtCDT .6584 .7775 .3735 .3605 .5649 6 BUAP-RUN2 .4860 .2872 .2082 .2117 .3216 79 MayoClinicNLP-r2CDT .6827 .6612 .3960 .3946 .5572 8 BUAP-RUN3 .4817 .2711 .2511 .1990 .3156 82 MayoClinicNLP-r3wtCD .6440 .8295 .3202 .3561 .5671 5 CFILT-1 .5336 .2381 .2261 .2906 .3531 75 NTNU-RUN1 .7279 .5952 .3215 .4015 .5519 9 CLaC-RUN1 .6774 .7667 .3793 .3068 .5511 10 NTNU-RUN2 .5909 .1634 .3650 .3786 .3946 68 CLaC-RUN2 .6921 .7366 .3793 .3375 .5587 7 NTNU-RUN3 .7274 .5882 .3115 .4035 .5498 12 CLaC-RUN3 .5276 .6495 .4158 .3082 .4755 47 PolyUCOMP-RUN1 .5176 .1517 .2496 .2914 .3284 77 CNGL-LPSSVR .6510 .6971 .1180 .2861 .4961 36 SOFTCARDINALITY-run1 .6410 .7360 .3442 .3035 .5273 23 CNGL-LPSSVRTL .6385 .6756 .1823 .3098 .4998 33 SOFTCARDINALITY-run2 .6713 .7412 .3838 .2981 .5402 18 CNGL-LSSVR .6552 .6943 .2016 .3005 .5086 30 SOFTCARDINALITY-run3 .6603 .7401 .3347 .2900 .5294 22 CPN-combined.RandSubSpace .6771 .5135 .3314 .3369 .4939 39 sriubc-System1† .6083 .2915 .2790 .3065 .4011 66 CPN-combined.SVM .6685 .5096 .3621 .3408 .4939 38 sriubc-System2† .6359 .3664 .2713 .3476 .4420 57 CPN-individual.RandSubSpace .6771 .5484 .3314 .2769 .4826 45 sriubc-System3† .5443 .2843 .2705 .3275 .3842 70 DeepPurple-length .6542 .5105 .2507 .2803 .4598 56 SXUCFN-run1 .6806 .5355 .3181 .3980 .5198 27 DeepPurple-linear .6878 .5105 .2693 .2787 .4721 50 SXUCFN-run2 .4881 .6146 .4237 .3844 .4797 46 DeepPurple-lineara .6227 .5105 .3265 .2952 .4607 55 SXUCFN-run3 .6761 .6481 .3025 .4003 .5458 14 deft-baseline .6532 .8431 .5083 .3265 .5795 3 SXULLL-1 .4840 .7146 .0415 .1543 .3944 69 deft-baseline2 .5706 .8111 .5503 .3325 .5495 13 UCam-A .5510 .3099 .2385 .1171 .3200 80 DLS@CU-char .3867 .2386 .3726 .3337 .3309 76 UCam-B .6399 .4440 .3995 .3400 .4709 53 DLS@CU-charSemantic .4669 .4165 .3859 .3411 .4056 64 UCam-C .4962 .5639 .1724 .3006 .4207 62 DLS@CU-charWordSemantic .4921 .3769 .4647 .3492 .4135 63 UCSP-NC‡ .1736 .0853 .1151 .1658 .1441 89 ECNUCS-Run1 .5656 .2083 .1725 .2949 .3533 74 UMBC EBIQUITY-galactus .7428 .7053 .5444 .3705 .5927 2 ECNUCS-Run2 .7120 .5388 .2013 .2504 .4720 51 UMBC EBIQUITY-ParingWords .7642 .7529 .5818 .3804 .6181 1
[image:8.612.71.544.58.484.2]ECNUCS-Run3 .6799 .5284 .2203 .3595 .4967 35 UMBC EBIQUITY-saiyan .7838 .5593 .5815 .3563 .5683 4 HENRY-run1 .7601 .4631 .3516 .2801 .4917 41 UMCC DLSI-1 .5841 .4847 .2917 .2855 .4352 58 HENRY-run2 .7645 .4631 .3905 .3593 .5229 26 UMCC DLSI-2 .6168 .5557 .3045 .3407 .4833 44 HENRY-run3 .7103 .3934 .3364 .3308 .4734 48 UMCC DLSI-3 .3846 .1342 -.0065 .2736 .2523 87 IBM EG-run2 .7217 .6110 .3364 .3460 .5365 19 UNIBA-2STEPSML .4255 .4801 .1832 .2710 .3673 71 IBM EG-run5 .7410 .5987 .4133 .3426 .5452 15 UNIBA-DSM PERM .6319 .4910 .2717 .3155 .4610 54 IBM EG-run6 .7447 .6257 .4381 .3275 .5502 11 UNIBA-STACKING .6275 .4658 .2111 .2588 .4293 61 ikernels-sys1 .7352 .5432 .3842 .3180 .5188 28 Unimelb NLP-bahar .7119 .3490 .3813 .3507 .4733 49 ikernels-sys2 .7465 .5572 .3875 .3409 .5339 21 Unimelb NLP-concat .7085 .6790 .3374 .3230 .5415 17 ikernels-sys3 .7395 .4228 .3596 .3294 .4919 40 Unimelb NLP-stacking .7064 .6140 .1865 .3144 .5091 29 INAOE-UPV-run1 .6392 .3249 .2711 .3491 .4332 59 Unitor-SVRegressor run1 .6353 .5744 .3521 .3285 .4941 37 INAOE-UPV-run2 .6390 .3260 .2662 .3457 .4319 60 Unitor-SVRegressor run2 .6511 .5610 .3580 .3096 .4902 42 INAOE-UPV-run3 .6468 .6295 .4090 .3047 .5085 31 Unitor-SVRegressor run3 .6027 .5489 .3269 .3192 .4716 52 KLUE-approach 1 .6521 .6507 .3996 .3367 .5254 25 UPC-AE .6092 .5679 -.1268 .2090 .4037 65 KLUE-approach 2 .6510 .6869 .4189 .3360 .5355 20 UPC-AED .4136 .4770 -.0852 .1662 .3050 83 UPC-AED T .5119 .6386 -.0464 .1235 .3671 72
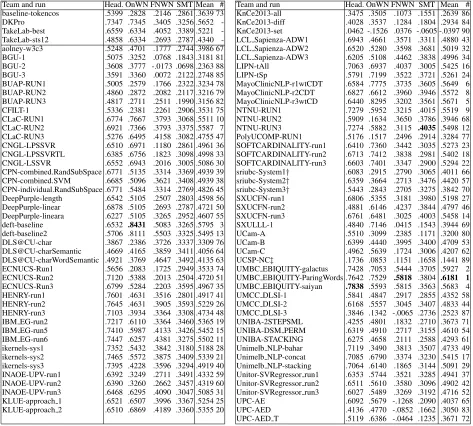
Table 2: Results on the CORE task. The first rows on the left correspond to the baseline and to two publicly available systems, see text for details. Note: †signals team involving one of the organizers,‡for systems submitting past the 120 hour window.
system runs. For the TYPED task, 6 teams partici-pated, submitting 14 system runs.6
Some submissions had minor issues: one team had a confidence score of 0 for all items (we re-placed them by 100), and another team had a few Not-a-Number scores for the SMT dataset, which we replaced by 5. One team submitted the results past the 120 hours. This team, and the teams that
in-6Due to lack of space we can’t detail the full names of
au-thors and institutions that participated.The interested reader can use the name of the runs in Tables 2 and 3 to find the relevant paper in these proceedings.
cluded one of the organizers, are explicitly marked. We want to stress that in these teams the organizers did not allow the developers of the system to access any data or information which was not available for the rest of participants. After the submission dead-line expired, the organizers published the gold stan-dard in the task website, in order to ensure a trans-parent evaluation process.
4.4 CORE Task Results
Team and run General Author People involved Time Location Event Subject Description Mean # baseline .6691 .4278 .4460 .5002 .4835 .3062 .5015 .5810 .4894 8 BUAP-RUN1 .6798 .6166 .0670 .2761 .0163 .1612 .5167 .5283 .3577 14 BUAP-RUN2 .6745 .6093 .1285 .3721 .0163 .1660 .5094 .5546 .3788 13 BUAP-RUN3 .6992 .6345 .1055 .1461 .0000 -.0668 .3729 .5120 .3004 15 BUT-1 .3686 .7468 .3920 .5725 .3604 .2906 .2270 .5882 .4433 9 ECNUCS-Run1 .6040 .7362 .3663 .4685 .3844 .4057 .5229 .6027 .5113 5 ECNUCS-Run2 .6064 .5684 .3663 .4685 .3844 .4057 .5563 .6027 .4948 7 PolyUCOMP-RUN1 .4888 .6940 .3223 .3820 .3621 .1625 .3962 .4816 .4112 12 PolyUCOMP-RUN2 .4893 .6940 .3253 .3777 .3628 .1968 .3962 .4816 .4155 11 PolyUCOMP-RUN3 .4915 .6940 .3254 .3737 .3667 .2207 .3962 .4816 .4187 10 UBC UOS-RUN1† .7256 .4568 .4467 .5762 .4858 .3090 .5015 .5810 .5103 6 UBC UOS-RUN2† .7457 .6618 .6518 .7466 .7244 .6533 .7404 .7751 .7124 4 UBC UOS-RUN3† .7461 .6656 .6544 .7411 .7257 .6545 .7417 .7763 .7132 3 Unitor-SVRegressor lin .7564 .8076 .6758 .7090 .7351 .6623 .7520 .7745 .7341 2 Unitor-SVRegressor rbf .7981 .8158 .6922 .7471 .7723 .6835 .7875 .7996 .7620 1
Table 3: Results on TYPED task. The first row corresponds to the baseline. Note:†signals team involving one of the organizers.
each dataset is given, followed by the mean cor-relation (the official measure), and the rank of the run. The baseline ranks 73. The highest correla-tions are for OnWN (84%, by deft) and HDL (78%, by UMBC), followed by FNWN (58%, by UMBC) and SMT (40%, by NTNU). This fits nicely with the inter-tagger correlations (respectively 87, 85, 70 and 65, cf. Section 3). It also shows that the systems get close to the human correlations in the OnWN and HDL dataset, with bigger differences for FNWN and SMT.
The result of the best run (by UMBC) is signif-icantly different (p-value <0.05) than all runs ex-cept the second best. The second best run is only significantly different to the runs ranking 7th and below, and the third best to the 14th run and be-low. The difference between consecutive runs was not significant. This indicates that many system runs performed very close to each other.
Only 13 runs included non-uniform confidence scores. In 10 cases the confidence value allowed to improve performance, sometimes as much as .11 absolute points. For instance, SXUCFN-run3 im-proves from .4773 to .5458. The most notable ex-ception is MayoClinicNLP-r2CDT, which achieves a mean correlation of .5879 instead of .5572 if they provide uniform confidence values.
The Table also shows the results of TakeLab and DKPro. We train the DKPro and TakeLab-sts12 models on all the training and test STS 2012 data. We additionally train another variant sys-tem of TakeLab, TakeLab-best, where we use tar-geted training where the model yields the best
per-formance for each test subset as follows: (1) HDL is trained on MSRpar 2012 data; (2) OnWN is trained on all 2012 data; (3) FnWN is trained on 2012 OnWN data; (4) SMT is trained on 2012 SM-Teuroparl data. Note that Takelab-best is an upper bound, as the best combination is selected on the test dataset. TakeLab-sts12, TakeLab-best, DKPro rank as 58th, 27th and 6th in this year’s system sub-missions, respectively. The different results yielded from TakeLab depending on the training data sug-gests that some STS systems are quite sensitive to the source of the sentence pairs, indicating that do-main adaptation techniques could have a role in this task. On the other hand, DKPro performed ex-tremely well when trained on all available training, with no special tweaking for each dataset.
4.5 TYPED Task Results
Acron yms Distrib utional memory Distrib utional thesaurus Monolingual corpora Multilingual corpora Opinion and Sentiment T ables of paraphrases W ikipedia W iktionary W ord embeddings W ordNet Correference Dependenc y parse Distrib utional similarity KB Similarity LD A Lemmatizer Le xical Substitution Logical inference Metaphor or Meton ymy Multiw ord recognition Named Entity recognition POS tagger R OUGE package Scoping Search engine Semantic Role Labeling String similarity
Syntax Textual
entailment T ime and date resolution T ree k ernels W ord Sense Disambiguation
aolney-w3c3 x x x
BGU-1 x x x x x x x
BGU-2 x x x x x x x
BGU-3 x x x x x x x
CFILT-APPROACH x x x x x
CLaC-Run1 x x x x x x x x
CLaC-Run2 x x x x x x x x
CLaC-Run3 x x x x x x x x
CNGL-LPSSVR x x x x x
CNGL-LPSSVRTL x x x x x
CNGL-LSSVR x x x x x
CPN-combined.RandSubSpace x x x x x x x x
CPN-combined.SVM x x x x x x x x
CPN-individual.RandSubSpace x x x x x x x x
DeepPurple-length x x x x x x x
DeepPurple-linear x x x x x x x
DeepPurple-lineara x x x x x x x
deft-baseline x x x x
deft-baseline x x x x x x
DLS@CU-charSemantic x x x x
DLS@CU-charWordSemantic x x x x x x
DLS@CU-charWordSemantic x x x
ECNUCS-Run1 x x x x x x x
ECNUCS-Run2 x x x x x x x
ECNUCS-Run3 x x x x x x x
HENRY-run1 x x x x x x x x x
HENRY-run2 x x x x x x x x
IBM EG-run2 x x x x x x
IBM EG-run5 x x x x x x
IBM EG-run6 x x x x x
ikernels-sys1 x x x x x x x x x x x
ikernels-sys2 x x x x x x x x x x x
ikernels-sys3 x x x x x x x x x x x
INAOE-UPV-run1 x x x x x x x INAOE-UPV-run2 x x x x x x x INAOE-UPV-run3 x x x x x x x
KLUE-approach 1 x x x x x x x
KLUE-approach 2 x x x x x x
KnCe2013-all x x x x x x x x
KnCe2013-div x x x x x x x x
KnCe2013-div x x x x x x x x
LCL Sapienza-ADW1 x x x
LCL Sapienza-ADW2 x x x
LCL Sapienza-ADW3 x x x
LIPN-tAll x x x x x x x x x x
LIPN-tSp x x x x x x x x x x
MayoClinicNLP-r1wtCDT x x x x x x x x x x x x
MayoClinicNLP-r2CDT x x x x x x x x x x x x
MayoClinicNLP-r3wtCD x x x x x x x x x x x x
NTNU-RUN1 x x x x x x x x x x x x x x x x x x x x x x x NTNU-RUN2 x x x x x x x x x x x x x x x x x x x x x x x NTNU-RUN3 x x x x x x x x x x x x x x x x x x x x x x x
PolyUCOMP-RUN1 x x x x
SOFTCARDINALITY-run1 x
SOFTCARDINALITY-run2 x x x
SOFTCARDINALITY-run3 x x x
SXUCFN-run1 x x x
SXUCFN-run2 x x x
SXUCFN-run3 x x x
SXULLL-1 x x
UCam-A x x x x
UCam-B x x x x
UCam-C x x x x
UCSP-NC x x x x x
UMBC EBIQUITY-galactus x x x x x x x
UMBC EBIQUITY-ParingWords x x x x x x
UMBC EBIQUITY-saiyan x x x x x x x
UMCC DLSI-1 x x x x x x x x x x
UMCC DLSI-2 x x x x x x x x x x
UMCC DLSI-3 x x x x x x x x x
UNIBA-2STEPSML x x x x x x x x x x x
UNIBA-DSM PERM x x x x x x
UNIBA-STACKING x x x x x x x x x x x
Unimelb NLP-bahar x x
Unimelb NLP-concat x x x x x x x x x x
Unimelb NLP-stacking x x x x x x x x x x
Unitor-SVRegressor run1 x x x x x x
Unitor-SVRegressor run2 x x x x x x
Unitor-SVRegressor run3 x x x x x x
Total 11 2 12 54 12 5 11 36 7 3 54 3 3 48 40 2 67 14 3 3 10 24 55 3 3 4 9 6 34 9 13 6 6
[image:10.612.139.476.52.681.2]types could be too low for practical use.
5 Tools and resources used
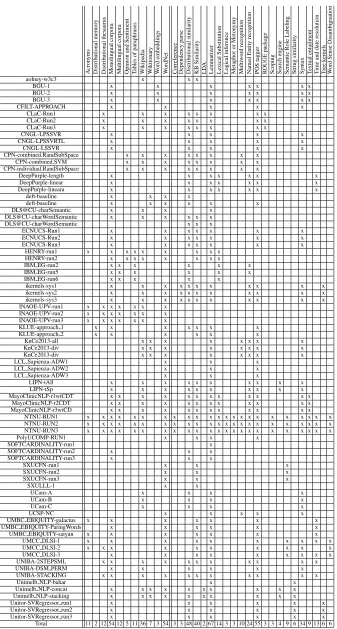
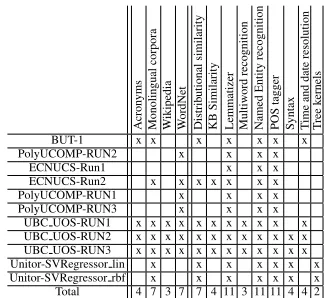
The organizers asked participants to submit a de-scription file, making special emphasis on the tools and resources that were used. Tables 4 and 5 show schematically the tools and resources as reported by some of the participants for the CORE and TYPED tasks (respectively). In the last row, the totals show that WordNet and monolingual corpora were the most used resources for both tasks, followed by Wikipedia and the use of acronyms (for CORE and TYPED tasks respectively). Dictionaries, multilin-gual corpora, opinion and sentiment analysis, and lists and tables of paraphrases are also used.
For CORE, generic NLP tools such as lemmati-zation and PoS tagging are widely used, and to a lesser extent, distributional similarity, knowledge-based similarity, syntactic analysis, named entity recognition, lexical substitution and time and date resolution (in this order). Other popular tools are Semantic Role Labeling, Textual Entailment, String Similarity, Tree Kernels and Word Sense Disam-biguation. Machine learning is widely used to com-bine and tune components (and so, it is not men-tioned in the tables). Several less used tools are also listed but are used by three or less systems. The top scoring systems use most of the resources and tools listed (UMBC EBIQUITY-ParingWords,
MayoClinicNLP-r3wtCD). Other well ranked sys-tems like deft-baseline are only based on distribu-tional similarity. Although not mentioned in the descriptions files, some systems used the publicly available DKPro and Takelab systems.
For the TYPED task, the most used tools are lem-matizers, Named Entity Recognizers, and PoS tag-gers. Distributional and Knowledge-base similarity is also used, and at least four systems used syntactic analysis and time and date resolution.7
6 Conclusions and Future Work
We presented the 2013 *SEM shared task on Seman-tic Textual Similarity.8 Two tasks were defined: a
7
For a more detailed analysis, the reader is directed to the papers in this volume.
8All annotations, evaluation scripts and system outputs are
available in the website for the task9. In addition, a collabora-tively maintained site10, open to the STS community, contains
Acron yms Monolingual corpora W ikipedia W ordNet Distrib utional similarity KB Similarity Lemmatizer Multiw ord recognition Named Entity recognition POS tagger
Syntax Time
and date resolution T ree k ernels
BUT-1 x x x x x x x
PolyUCOMP-RUN2 x x x x
ECNUCS-Run1 x x x
ECNUCS-Run2 x x x x x x x
PolyUCOMP-RUN1 x x x x
PolyUCOMP-RUN3 x x x x
[image:11.612.344.506.55.204.2]UBC UOS-RUN1 x x x x x x x x x x x UBC UOS-RUN2 x x x x x x x x x x x x UBC UOS-RUN3 x x x x x x x x x x x x Unitor-SVRegressor lin x x x x x x x Unitor-SVRegressor rbf x x x x x x x Total 4 7 3 7 7 4 11 3 11 11 4 4 2
Table 5: TYPED task: Resources and tools used by the systems that submitted a description file. Leftmost columns correspond to the resources, and rightmost to tools, in alphabetic order.
core task CORE similar to the STS 2012 task, and a new pilot on typed-similarity TYPED. We had 34 teams participate in both tasks submitting 89 system runs for CORE and 14 system runs for TYPED, in total amounting to a 103 system evaluations. CORE uses datasets which are related to but different from those used in 2012: news headlines, MT evalua-tion data, gloss pairs. The best systems attained correlations close to the human inter tagger corre-lations. The TYPED task characterizes, for the first time, the reasons why two items are deemed simi-lar. The results on TYPED show that the training data provided allowed systems to yield high corre-lation scores, demonstrating the practical viability of this new task. In the future, we are planning on adding more nuanced evaluation data sets that in-clude modality (belief, negation, permission, etc.) and sentiment. Also given the success rate of the TYPED task, however, the data in this pilot is rel-atively structured, hence in the future we are inter-ested in investigating identifying reasons why two pairs of unstructured texts as those present in CORE are deemed similar.
Acknowledgements
We are grateful to the OntoNotes team for sharing OntoNotes to WordNet mappings (Hovy et al. 2006). We thank Lan-guage Weaver, INC, DARPA and LDC for providing the SMT data. This work is also partially funded by the Spanish Ministry of Education, Culture and Sport (grant FPU12/06243). This
work was partially funded by the DARPA BOLT and DEFT pro-grams.
We want to thank Nikolaos Aletras, German Rigau and Mark Stevenson for their help designing, annotating and col-lecting the typed-similarity data. The development of the typed-similarity dataset was supported by the PATHS project (http://paths-project.eu) funded by the European Community’s Seventh Framework Program (FP7/2007-2013) under grant agreement no. 270082. The tasks were partially financed by the READERS project under the CHIST-ERA framework (FP7 ERA-Net). We thank Europeana and all contributors to Euro-peana for sharing their content through the API.
References
Eneko Agirre and Enrique Amig´o. In prep. Exploring evaluation measures for semantic textual similarity. In Unpublished manuscript.
Eneko Agirre, Daniel Cer, Mona Diab, and Aitor Gonzalez-Agirre. 2012. Semeval-2012 task 6: A pilot on semantic textual similarity. In *SEM 2012: The First Joint Conference on Lexical and Computa-tional Semantics – Volume 1: Proceedings of the main conference and the shared task, and Volume 2: Pro-ceedings of the Sixth International Workshop on Se-mantic Evaluation (SemEval 2012), pages 385–393, Montr´eal, Canada, 7-8 June. Association for Compu-tational Linguistics.
Collin F. Baker, Charles J. Fillmore, and John B. Lowe. 1998. The berkeley framenet project. InCOLING ’98 Proceedings of the 17th international conference on Computational linguistics - Volume 1.
Daniel Bar, Chris Biemann, Iryna Gurevych, and Torsten Zesch. 2012. Ukp: Computing semantic textual sim-ilarity by combining multiple content simsim-ilarity mea-sures. In Proceedings of the 6th International Work-shop on Semantic Evaluation, in conjunction with the 1st Joint Conference on Lexical and Computational Semantics.
Clive Best, Erik van der Goot, Ken Blackler, Tefilo Garcia, and David Horby. 2005. Europe media monitor -system description. InEUR Report 22173-En, Ispra, Italy.
Markus Dreyer and Daniel Marcu. 2012. Hyter: Meaning-equivalent semantics for translation evalua-tion. InHuman Language Technologies: Conference of the North American Chapter of the Association of Computational Linguistics.
Christiane Fellbaum. 1998. WordNet: An Electronic Lexical Database. MIT Press.
Eduard Hovy, Mitchell Marcus, Martha Palmer, Lance Ramshaw, and Ralph Weischedel. 2006. Ontonotes: The 90% solution. InProceedings of the Human Lan-guage Technology Conference of the North American Chapter of the ACL.
W.H. Press, S.A. Teukolsky, W.T. Vetterling, and B.P. Flannery. 2002. Numerical Recipes: The Art of Sci-entific Computing V 2.10 With Linux Or Single-Screen License. Cambridge University Press.
Matthew Snover, Bonnie Dorr, Richard Schwartz, Lin-nea Micciulla, and John Makhoul. 2006. A study of translation edit rate with targeted human annotation. InProceedings of Association for Machine Translation in the Americas.