Proceedings of the NAACL HLT 2010 Student Research Workshop, pages 7–12,
On Automated Evaluation of Readability of Summaries:
Capturing Grammaticality, Focus, Structure and Coherence
Ravikiran Vadlapudi
Language Technologies Research Center IIIT Hyderabad
Rahul Katragadda
Language Technologies Research Center IIIT Hyderabad
rahul [email protected]
Abstract
Readability of a summary is usually graded manually on five aspects of readability: gram-maticality, coherence and structure, focus,
referential clarityandnon-redundancy. In the context of automated metrics for evaluation of summary quality, content evaluations have been presented through the last decade and continue to evolve, however a careful exami-nation of readability aspects of summary qual-ity has not been as exhaustive. In this paper we explore alternative evaluation metrics for ‘grammaticality’ and ‘coherence and struc-ture’ that are able to strongly correlate with manual ratings. Our results establish that our methods are able to perform pair-wise rank-ing of summaries based on grammaticality, as strongly as ROUGE is able to distinguish for content evaluations. We observed that none of the five aspects of readability are indepen-dent of each other, and hence by addressing the individual criterion of evaluation we aim to achieve automated appreciation of readability of summaries.
1 Introduction
Automated text summarization deals with both the problem of identifying relevant snippets of informa-tion and presenting it in a pertinent format. Auto-mated evaluation is crucial to automatic text sum-marization to be used both to rank multiple partic-ipant systems in shared tasks1, and to developers whose goal is to improve the summarization sys-tems. Summarization evaluations help in the cre-ation of reusable resources and infrastructure; it sets up the stage for comparison and replication of re-sults by introducing an element of competition to produce better results (Hirschman and Mani, 2001).
1
The summarization tracks at Text Analysis Conference (TAC) 2009, 2008 and its predecessors at Document Under-standing Conferences (DUC).
Readability or Fluency of a summary is categor-ically measured based on a set of linguistic qual-ity questions that manual assessors answer for each summary. The linguistic quality markers are: gram-maticality, Non-Redundancy, Referential Clarity, Focus and Structure and Coherence. Hence read-ability assessment is a manual method where ex-pert assessors give a rating for each summary on the Likert Scale for each of the linguistic quality markers. Manual evaluation being time-consuming and expensive doesn’t help system developers — who appreciate fast, reliable and most importantly automated evaluation metric. So despite having a sound manual evaluation methodology for readabil-ity, there is an need for reliable automatic metrics.
While studying the coherence patterns in student essays, (Higgins et al., 2004) identified that gram-matical errors affect the overall expressive quality of the essays. In this paper, due to the lack of an ap-propriate baseline and due to the interesting-ness of the above observation we use metrics for grammat-icality as a baseline measure forstructure and co-herence. Focus of a summary, is the only aspect of readability that relies to a larger extent on the content of the summary. In this paper, we use Recall Ori-ented Understudy of Gisting Evaluation (ROUGE) (Lin, 2004) based metrics as one of the baselines to capturefocusin a summary.
2 Summary Grammaticality
Grammaticality of summaries, in this paper, is de-fined based on the grammaticality of its sentences, since it is more a sentence level syntactic property. A sentence can either be grammatically correct or grammatically incorrect. The problem of grammati-cal incorrectness should not occur in summaries be-ing evaluated because they are generated mostly by extract based summarization systems.
But as the distribution of grammaticality scores in Table 1 shows, there are a lot of summaries that obtain very low scores. Hence, We model the prob-lem of grammaticality as “how suitable or accept-able are the sentence structures to be a part of a summary?”.
The acceptance or non acceptance of sentence structures varies across reviewers because of vari-ous factors like usage, style and dialects. Hence, we define a degree to which a sentence structure is ac-ceptable to the reviewers, this is called thedegree of acceptancethroughout this paper.
Grammaticality Score 1 2 3 4 5 Percentage Distribution (in %) 10 13 15 37 25
Table 1: Percentage distribution of grammaticality scores in system summaries
In this paper, the degree of acceptance of sen-tence structures is estimated using language mod-els trained on a corpus of human written sum-maries. Considering the sentence structures in ref-erence summaries as the best accepted ones (with highest degree of acceptance), we estimate the de-gree of acceptance of sentences in system gener-ated summaries by quantifying the amount of sim-ilarity/digression from the references using the
lan-guage models.
The structure of the sentences can be represented by sequences of parts-of-speech (POS) tags and chunk tags. Our previous observations (Vadlapudi and Katragadda, 2010) show that the tagset size plays an important role in determining the degree of acceptance. In this paper, we combine the two features of a sentence — the POS-tag sequence and chunk-tag sequence — to generate the POS-Chunk-tag training corpus.
Some aspects of grammatical structure are well identifiable at the level of POS tags, while some other aspects (such as distinguishing between appos-itives and lists for eg.) need the power of chunk tags, the combination of these two tag-sequences provides the power of both.
Hence, the following approaches use probabilis-tic models, learned on POS tag corpus and POS-Chunk tag corpus, in 3 different ways to determine the grammaticality of a sentence.
2.1 Enhanced Ngram model
As described in our previous work, the Ngram model estimates the probability of a sentence to be grammatically acceptable with respect to the corpus using language models. Sentences constructed us-ing frequent grammar rules would have higher prob-ability and are said to have a well accepted sentence structure. The grammaticality of a summary is com-puted as
G(Sum) =AV G(P(Seqi)) ;P(Seqi) = log(n
v u u t
n Y
j=1 P(Kj))
P(Kj) =P(tj−2tj−1tj) P(t1t2t3) =λ1∗P(t3|t1t2) +λ2∗P(t3|t2) +λ3∗P(t3)
whereG(Sum)is grammaticality score of a sum-marySumandG(Si)is grammaticality of sentence Si which is estimated by the probability (P(Seqi)) of its POS-tag sequence (Seqi). P(Kj) is proba-bility of POS-tag trigram Kj which is tj−2tj−1tj
and ∀tj, tj ∈ P OS tags. The additional tags t−1,t0 andtn+1 are the beginning-of-sequence and
harmonic meanare experimented and based on our experiments, we found geometric mean perform-ing better than the other two averagperform-ing techniques. All the results reported in this paper are based on geometric mean. The above procedure estimates grammaticality of sentence using its POS tags and we call this run ‘Ngram (POS)’. A similar proce-dure is followed to estimate grammaticality using its Chunk tags (language models trained on POS-chunk-tag training corpus). The corresponding run is called ‘Ngram (POS-Chunk)’ in the results.
2.2 Multi-Level Class model
In this model, we view the task of scoring grammati-cality as a n-level classification problem. Grammat-icality of summaries is manually scored on a scale of 1 to 5, which means the summaries are classi-fied into 5 classes. We assume that each sentence of the summary is also rated on a similar scale which cumulatively decides to which class the summary must belong. In our approach, sentences are classi-fied into 5 classes on the basis of frequencies of un-derlying grammar rules (trigram) by defining class boundaries on frequencies. Hence, the cumulative score of the rules estimate the score of grammatical-ity of a sentence and inturn the summary.
Similar to (Vadlapudi and Katragadda, 2010), tri-grams are classified into 5 classesC1, C2, C3, C4
andC5 and each class is assigned a score on a
sim-ilar scale (∀jscore(Cj) = j) and class boundaries are estimated using the frequencies of trigrams in the training corpus. The most frequent trigram, for example, would fall into class C5. POS-Class
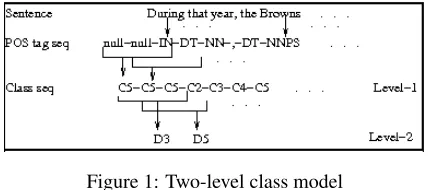
[image:3.612.78.295.569.664.2]se-quences are generated from POS-tag sese-quences us-ing class boundaries as shown in Figure 1. This is the first level of classification.
Figure 1: Two-level class model
Like the first level of classification, a series of classifications are performed upto ‘k’ levels. At each level we apply the scoring method described below to evaluate the grammaticality of summaries. We
observed that from 3rd level onwards the structural dissimilarity disappears and the ability to distinguish different structures is lost. Hence, we report on the second level of classification, that captures the gram-matical acceptability of summaries very well, and Figure 1 explains the two level classification.
G(Si) =AV G(H(Cw1), H(Cw2), ...., H(Cwn)) (1)
AVG is the average of H(Cwi), where w1, w2, . . . wnare class trigrams,Cwiis the class into which class trigramwifalls into andH(Cwi) is score as-signed to the classCwi. TheAV Gis computed us-ing geometric mean and this run is referred as ‘Class (POS 2 level)’ in the results.
Similar to above approach, the grammaticality of a sentence can also be estimated using POS-Chunk tag sequence and POS-POS-Chunk Class training data, and the corresponding run is referred as ‘Class (POS-Chunk 2 level)’.
2.3 Hybrid Model
As would be later seen in Table 2, theNgram (POS) and Class (POS 2 level) runs are able to distin-guish various systems based on grammaticality. We also note that these runs are able to very finely distinguish the degree of grammaticality at sum-mary level. This is a very positive result, one that shows the applicability of applying these methods to any test summaries in this genre. To fully uti-lize these methods we combine the two methods by a linear combination of their scores to form a ‘hybrid model’. As seen with earlier approaches, both the POS-tag sequences and POS-Chunk-tag se-quences could be used to estimate the grammatical-ity of a sentence, and hence the summary. These two runs are called ‘Hybrid (POS)’ and ‘Hybrid (POS-Chunk)’, respectively.
3 Structure and Coherence
such related words spanning a unit of text. Lexi-cal cohesion along with presuppositions and impli-cations with world knowledge achieves coherence in texts. Hence,coherenceis what makes text semanti-cally meaningful, and in this paper, we also attempt to automate the evaluation of the “structure and co-herence” of summaries.
We capture the structure or lexical cohesion of a summary by constructing a lexical chain that spans the summary. The relation between entities (noun phrases) in adjacent sentences could be of type center-reference (pronoun reference or reiteration), or based on semantic relatedness (Morris and Hirst, 1991). A center-reference relation exists if an en-tity in a sentence is a reference to center in adjacent sentence. Identifying centers of reference expres-sions can be done using a co-reference resolution tool. Performance of co-reference resolution tools in summaries, being evaluated, is not as good as their performance on generic texts. Semantic relatedness relation cannot be captured by using tools like Word-net because they are not very exhaustive and hence are not effective. We use a much richer knowledge base to define this relation – Wikipedia.
Coherence of a summary is modelled by its struc-ture and content together. Strucstruc-ture is capstruc-tured by lexical chains which also give information about fo-cus of each sentence which inturn contribute to the topic focus of the summary. Content presented in the summary must be semantically relevant to the topic focus of the summary. If the content presented by each sentence is semantically relevant to the fo-cus of the sentence, then it would be semantically relevant to the topic focus of the summary. As the foci of sentences are closely related, a prerequisite for being a part of a lexical chain, the summary is said to be coherent. In this paper, the semantic relat-edness of topic focus and content is captured using Wikipedia as elaborated in Section 3.1 of this paper.
3.1 Construction of lexical chains
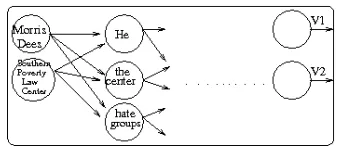
In this approach, we identify the strongest lexical chain possible which would capture the structure of the summary. We define this problem of finding the strongest possible lexical chain as that of finding the best possible parts-of-speech tag sequence for a sen-tence using the Viterbi algorithm shown in (Brants, 2000). The entities (noun phrases) of each sentence
are the nodes and transition probabilities are defined as relatedness score (Figure 2). The strongest lex-ical chain would have the highest score than other possible lexical chains obtained.
Consider sentence Sk with entity set (e11, e12, e13, . . . e1n) and sentenceSk+1 with entity set (e21, e22,e23,. . . e2m). Sentences SkandSk+1 are said
to be strongly connected if there exists entitiese1i∈ Skande2j ∈Sk+1 that are closely related. e1i and e2jare considered closely related if
• e2jis a pronoun reference of the centere1i
• e2jis a reiteration ofe1i
• e2jande1iare semantically related
Pronoun reference In this approach, we resolve the reference automatically by finding more than one possible center for the reference expression us-ing Wikipedia. Since the summaries are generated from news articles, we make a fair assumption that related articles are present in Wikipedia. We en-sure that the correct center is one among the pos-sible centers through which Sk+1 and Sk+2 might
be strongly connected. Entities withquery hits ra-tio≥λare considered as possible centers and entity e2j is replaced by entities that act as the possible centers. Since the chain with the identified correct center is likely to have the highest score, our final lexical chain would contain the correct center.
Query hit ratio=Query hits(e1iand e2j) Query hits(e1i)
[image:4.612.341.512.625.698.2]Reiteration Generally, an entity with a determiner can be treated as reiteration expression but not vice versa. Therefore, we check whethere2j is actually a reiteration expression or not, using query hits on Wikipedia. If Query hits (e2j) ≥ β then we con-sider it to be a reiteration expression. A reiterating expression of anamed entityis generally a common noun that occurs in many documents. After identify-ing a reiteration expression we estimate relatedness using semantic relatedness approach.
Semantic relatedness By using query hits over Wikipedia we estimate thesemantic relatedness of two entities. Such an approach has been previously attempted in (Strube and Ponzetto, 2006). Based on our experiments on grammaticality 2.2, classifying into 5 classes is better suited for evaluation tasks, hence we follow suit and classifysemantic related-nessinto 5 classes. These classes indicate how se-mantically related the entities are. Each class is as-signed a value that is given to the hits which fall into the class. For example, ifquery hitslie in the range (γ1,γ2) or if query hit ratio is ≥ξ then it falls into
class k and is assigned a score equal to k.
Now that we have computed semantic connect-edness between adjacent sentences using the meth-ods explained above, we identify the output node with maximum score (node V2 in Figure 2). This node with best score is selected and by backtack-ing the Viterbi path we generate the lexical chain for the summary. The constantsλ, γ1, γ2andξare
deter-mined based on empirical tuning.
3.2 Coherence
We estimate coherence of the summary by estimat-ing how the sentences stick together and the seman-tic relevance of their collocation. In a sentence, the semantic relatedness of entities with the focus esti-mates score for the meaningfulness of the sentence, and the average score of all the sentences estimates the coherence of the summary.
C(Summary) = Σ N i=1G(si)
N
G(si) =
Σkj=1−1H(Q(F and eij))
k
Where C(Summary) is the coherence of sum-mary Summary, and G(si) is the semantic relat-edness of a sentence si inSummary, while Q(q)
denotes the number of query hits of query q. F is the focus ofsi andeij is an entity insi, andH(Q)
is the score of class into which query falls.
4 Evaluation
This paper deals with methods that imitate manual evaluation metric for grammaticality and structure and coherenceby producing a score for each sum-mary. An evaluation of these new summarization evaluation metricsis based on how well the system rankings produced by them correlate with manual
evaluations. We use 3 types of correlation evalu-ations — Spearman’s Rank Correlation, Pearson’s Correlation and Kendall’s Tau — each describing some aspect of ordering problems.
We used reference summaries from TAC 2008, 2009 for the reference corpus and the experiments described were tested on DUC 2007 query-focused multi-document summarization datasets which have 45 topics and 32 system summaries for each topic apart from 4 human reference summaries.
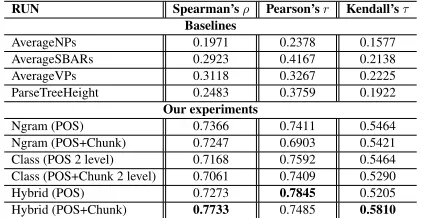
Table 2 shows the system level correlations of our approaches to grammaticality assessment with that of human ratings. We have used four base-line approaches: AverageNPs, AverageVPs, Aver-ageSBARs and AverageParseTreeHeight. Our ap-proaches constitute of the following runs: Ngram (POS), Ngram (POS-Chunk), Class (POS 2 level), Class (POS-Chunk 2 level), Hybrid (POS), Hybrid (POS-Chunk).
RUN Spearman’sρ Pearson’sr Kendall’sτ
Baselines
AverageNPs 0.1971 0.2378 0.1577 AverageSBARs 0.2923 0.4167 0.2138 AverageVPs 0.3118 0.3267 0.2225 ParseTreeHeight 0.2483 0.3759 0.1922
Our experiments
[image:5.612.320.531.340.449.2]Ngram (POS) 0.7366 0.7411 0.5464 Ngram (POS+Chunk) 0.7247 0.6903 0.5421 Class (POS 2 level) 0.7168 0.7592 0.5464 Class (POS+Chunk 2 level) 0.7061 0.7409 0.5290 Hybrid (POS) 0.7273 0.7845 0.5205 Hybrid (POS+Chunk) 0.7733 0.7485 0.5810
Table 2: System level correlations of automated and man-ual metrics for grammaticality.
RUN Spearman’sρ Pearson’sr Kendall’sτ
Experiments
Ngram (POS) 0.4319 0.4171 0.3165
Ngram (POS+Chunk) 0.4132 0.4086 0.3124
Class (POS 2 level) 0.3022 0.3036 0.2275 Class (POS+Chunk 2 level) 0.2698 0.2650 0.2015 Hybrid (POS) 0.3652 0.3483 0.2747
[image:5.612.320.532.486.556.2]Hybrid (POS+Chunk) 0.3351 0.3083 0.2498
Table 3: Summary level correlations of automated and manual met-rics forgrammaticality.
RUN Spearman’sρ Pearson’sr Kendall’sτ
Baselines
Human Grammaticality rating 0.5546 0.6034 0.4152
Ngram(POS) 0.3236 0.4765 0.2229
Experiments
Our coherence model 0.7133 0.5379 0.5173
Table 4:System level correlations of automated and manual metrics forcoherence.
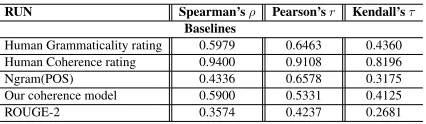
RUN Spearman’sρ Pearson’sr Kendall’sτ Baselines
Human Grammaticality rating 0.5979 0.6463 0.4360 Human Coherence rating 0.9400 0.9108 0.8196
Ngram(POS) 0.4336 0.6578 0.3175
Our coherence model 0.5900 0.5331 0.4125
[image:6.612.79.292.70.132.2]ROUGE-2 0.3574 0.4237 0.2681
Table 5:System level correlations of automated and manual metrics forfocus
best performing system for grammaticality are used as baselines forstructure and coherenceassessment. Again, like we previously mentioned, focuscan be easily characterized using structure and coherence, and to an extent the grammatical well-formedness. Also thefocus of a summary is also dependent on content of the summary. Hence, we use ROUGE-2, manual rating for grammaticality, manual rating for coherence, and our approaches to both grammat-icalityand structure and coherenceas baselines as shown in Table 5.
5 Discussion and Conclusion
In this paper, we addressed the problem of identi-fying thedegree of acceptanceof grammatical for-mations at sentence level using surface features like Ngrams probabilities (in Section 2.1), and trigrams based class Ngrams (in Section 2.2) and a hybrid model using both Ngram and Class model (in Sec-tion 2.3), on the POS-tag sequences and POS-chunk-tag sequences which have produced impressive re-sults improving upon our previous work.
Our approaches have produced high correlations to human judgment on grammaticality. Results in Table 2 show that the Hybrid approach on the POS-Chunk tag sequences outperforms all the other ap-proaches. Our approaches to grammaticality assess-ment have performed decently at pair-wise ranking of summaries, shown by correlations of the order of 0.4 for many runs. This correlation is of the same order as that of similar figure for content evaluations using ROUGE and Basic Elements.
Table 4 shows that our approach to the ‘structure and coherence’ assessment outperforms the base-lines set and has an impressive correlation with man-ual ratings. From Table 5 we found that grammati-cality is a good indicator of focus while we also ob-serve that structure and coherence forms a strong alternative tofocus.
The focus of this paper was on providing a com-plete picture on capturing the grammaticality as-pects of readability of a summary using relatively
shallow features as POS-tags and POS-Chunk-tags. We used lexical chains to capturestructure and co-herenceof summaries, whose performance also cor-related with focusof summaries. None of the five aspects of readability are completely independent of each other, and by addressing the individual criteria for evaluation we aim to achieve overall appreciation of readability of summary.
References
Regina Barzilay and Mirella Lapata. 2005. Modeling local coherence: An entity-based approach. InACL. Thorsten Brants. 2000. Tnt: a statistical part-of-speech
tagger. In Proceedings of the sixth conference on Applied natural language processing, pages 224–231, Morristown, NJ, USA. Association for Computational Linguistics.
Jieun Chae and Ani Nenkova. 2009. Predicting the fluency of text with shallow structural features: Case studies of machine translation and human-written text. In EACL, pages 139–147. The Association for Com-puter Linguistics.
Rudolf Flesch. 1948. A new readability yardstick. Jour-nal of Applied Psychology, 32:221–233.
M.A.K Halliday and Ruqayia Hasan. 1976. Longman publishers.
Derrick Higgins, Jill Burstein, Daniel Marcu, and Clau-dia Gentile. 2004. Evaluating multiple aspects of co-herence in student essays. InHLT-NAACL 2004: Main Proceedings, pages 185–192, Boston, Massachusetts, USA, May 2 - May 7. Association for Computational Linguistics.
Lynette Hirschman and Inderjeet Mani. 2001. Evalua-tion.
Chin-Yew Lin. 2004. ROUGE: A Package for Automatic Evaluation of Summaries. Inthe proceedings of ACL Workshop on Text Summarization Branches Out. ACL. Jane Morris and Graeme Hirst. 1991. Lexical cohesion computed by thesaural relations as an indicator of the structure of text. Comput. Linguist., 17(1):21–48. Andrew Mutton, Mark Dras, Stephen Wan, and Robert
Dale. 2007. Gleu: Automatic evaluation of sentence-level fluency. InACL. The Association for Computer Linguistics.
Emily Pitler and Ani Nenkova. 2008. Revisiting read-ability: A unified framework for predicting text qual-ity. InEMNLP, pages 186–195. ACL.
Michael Strube and Simone Paolo Ponzetto. 2006. Wikirelate! computing semantic relatedness using wikipedia. In21. AAAI / 18. IAAI 2006. AAAI Press, july.