Interactive Annotation Learning with Indirect Feature Voting
Shilpa Arora and Eric Nyberg
Language Technologies Institute Carnegie Mellon University Pittsburgh, PA 15213, USA {shilpaa,ehn}@cs.cmu.edu
Abstract
We demonstrate that a supervised annotation learning approach using structured features derived from tokens and prior annotations per-forms better than a bag of words approach. We present a general graph representation for automatically deriving these features from la-beled data. Automatic feature selection based on class association scores requires a large amount of labeled data and direct voting can be difficult and error-prone for structured fea-tures, even for language specialists. We show that highlighted rationales from the user can be used for indirect feature voting and same performance can be achieved with less labeled data.We present our results on two annotation learning tasks for opinion mining from prod-uct and movie reviews.
1 Introduction
Interactive Annotation Learning is a supervised ap-proach to learning annotations with the goal of min-imizing the total annotation cost. In this work, we demonstrate that with additional supervision per ex-ample, such as distinguishing discriminant features, same performance can be achieved with less anno-tated data. Supervision for simple features has been explored in the literature (Raghavan et al., 2006; Druck et al., 2008; Haghighi and Klein, 2006). In this work, we propose an approach that seeks super-vision from the user on structured features.
Features that capture the linguistic structure in text such as n-grams and syntactic patterns, referred to as structured features in this work, have been found to be useful for supervised learning of annota-tions. For example, Pradhan et al. (2004) show that
using features like syntactic path from constituent to predicate improves performance of a semantic parser. However, often such features are “hand-crafted” by domain experts and do not generalize to other tasks and domains. In this work, we propose a general graph representation for automatically ex-tracting structured features from tokens and prior an-notations such as part of speech, dependency triples, etc. Gamon (2004) shows that an approach using a large set of structured features and a feature selec-tion procedure performs better than an approach that uses a few “handcrafted” features. Our hypothesis is that structured features are important for super-vised annotation learning and can be automatically derived from tokens and prior annotations. We test our hypothesis and present our results for opinion mining from product reviews.
Deriving features from the annotation graph gives us a large number of very sparse features. Fea-ture selection based on class association scores such as mutual information and chi-square have often been used to identify the most discriminant features (Manning et al., 2008). However, these scores are calculated from labeled data and they are not very meaningful when the dataset is small. Supervised feature selection, i.e. asking the user to vote for the most discriminant features, has been used as an al-ternative when the training dataset is small. Ragha-van et al. (2006) and Druck et al. (2008) seek feed-back on unigram features from the user for docu-ment classification tasks. Haghighi and Klein (2006) ask the user to suggest a few prototypes (examples) for each class and use those as features. These ap-proaches ask the annotators to identify globally
evant features, but certain features are difficult to vote on without the context and may take on very different meanings in different contexts. Also, all these approaches have been demonstrated for uni-gram features and it is not clear how they can be extended straightforwardly to structured features.
We propose an indirect approach to interactive feature selection that makes use of highlighted ra-tionales from the user. A rationale (Zaidan et al., 2007) is the span of text a user highlights in support of his/her annotation. Rationales also allow us to seek feedback on features in context. Our hypothe-sis is that with rationales, we can achieve same per-formance with lower annotation cost and we demon-strate this for opinion mining from movie reviews.
In Section 2, we describe the annotation graph representation and motivate the use of structured features with results on learning opinions from prod-uct reviews. In Section 3, we show how rationales can be used for identifying the most discriminant features for opinion classification with less training data. We then list the conclusions we can draw from this work, followed by suggestions for future work.
2 Learning with Structured Features
In this section, we demonstrate that structured fea-tures help in improving performance and propose a formal graph representation for deriving these fea-tures automatically.
2.1 Opinions and Structured Features
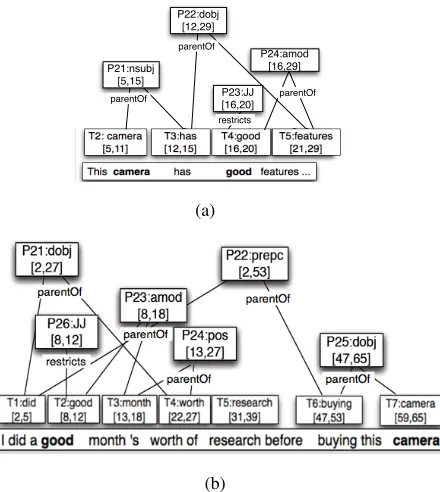
Unigram features such as tokens are not sufficient for recognizing all kinds of opinions. For example, a unigram featuregoodmay seem useful for identi-fying opinions, however, consider the following two comments in a review: 1)This camera hasgood fea-turesand 2)I did agoodmonth’s worth of research before buying this camera. In the first example, the unigram good is a useful feature. However, in the second example,goodis not complementing the camera and hence will mislead the classifier. Struc-tured features such as part-of-speech, dependency relations etc. are needed to capture the language structure that unigram features fail to capture.
2.2 Annotation Graph and Features
We define the annotation graph as a quadruple:G=
(N, E,Σ, λ), whereN is the set of nodes,E is the set of edges E ⊂ N ×N, Σ = ΣN ∪ΣE is a
set of labels for nodes and edges. λ is the label-ing functionλ:N ∪E → Σ, that assigns labels to nodes and edges. In this work, we define the set of labels for nodes, ΣN as tokens, part of speech and
dependency annotations and set of labels for edges,
ΣE as relations,ΣE ={leftOf,parentOf,restricts}.
TheleftOf relation is defined between two adjacent nodes. TheparentOf relation is defined between the dependency type and its attributes. For example, for the dependency triple ‘nsubj perfect camera’, there is aparentOf relation between the dependency type ‘nsubj’ and tokens ‘perfect’ and ‘camera’. The re-strictsrelation exists between two nodesaandbif their textual spans overlap completely andarestricts howbis interpreted. For a word with multiple senses therestrictsrelation between the word and its part of speech, restricts the way the word is interpreted, by capturing the sense of the word in the given context. The Stanford POS tagger (Toutanova and Manning, 2000) and the Stanford parser (Klein and Manning, 2003) were used to produce the part of speech and dependency annotations.
Features are defined as subgraphs, G0 =
(N0, E0,Σ0, λ0)in the annotation graphG, such that N0⊆N,E0 ⊂N0×N0andE0 ⊆E,Σ0= Σ0
N∪Σ0E
whereΣ0
N ⊆ΣN andΣ0E ⊆ΣEandλ0 :N0∪E0 →
Σ0. For a bag of words approach that only uses
to-kens as features, Σ0
N = T, where T is the token
vocabulary andE =φandΣE =φ(whereφis the
null set). We define thedegreeof a feature subgraph as the number of edges it contains. For example, the unigram features are the feature subgraphs with no edges i.e. degree= 0.Degree−1features are the feature subgraphs with two nodes and an edge. In this paper, we present results for feature subgraphs withdegree= 0anddegree= 1.
differ-entiate between these two examples; structured fea-tures like dependency relation subgraphs can capture this linguistic distinction between the two examples.
[image:3.612.320.536.55.127.2] [image:3.612.81.301.120.366.2]P24:amod [16,29]
P23:JJ [16,20] P22:dobj
[12,29]
P21:nsubj [5,15]
restricts parentOf
parentOf
parentOf
(a)
(b)
Figure 1: The figure shows partial annotation graphs for two examples. Only some of the nodes and edges are shown for clarity. Spans of nodes in brackets are the character spans.
2.3 Experiments and Results
The dataset we used is a collection of 244 Amazon’s customer reviews (2962 comments) for five products (Hu and Liu, 2004). A review comment is annotated as an opinion if it expresses an opinion about an as-pect of the product and the asas-pect is explicitly men-tioned in the sentence. We performed 10-fold cross validation (CV) using the Support Vector Machine (SVM) classifier in MinorThird (Cohen, 2004) with the default linear kernel and chi-square feature se-lection to select the top 5000 features. As can be seen in Table 1, an approach usingdegree−0 fea-tures, i.e. unigrams, part of speech and dependency triples together, outperforms using any of those fea-tures alone and this difference is significant. Us-ing degree − 1 features with two nodes and an edge improves performance further. However, using degree−0features in addition todegree−1features does not improve performance. This suggests that when using higher degree features, we may leave out the features with lower degree that they subsume.
Features Avg F1 Outperforms unigram [uni] 65.74 pos,dep pos-unigram [pos] 64 dep dependency [dep] 63.18
-degree-0 [deg-0] 67.77 uni,pos,dep
degree-1 [deg-1] 70.56 uni,pos,dep,deg-0, deg-* (deg-0 + deg-1) [deg-*] 70.12 uni,pos,dep,deg-0 Table 1: The table reports the F-measure scores averaged over ten cross validation folds. The value in bold in theAvg F1column is the best performing feature combination. For each feature combination in the row,outperformscolumn lists the feature combinations it outperforms, with significant differences highlighted in bold (paired t-test withp <
0.05considered significant).
3 Rationales & Indirect Feature voting
We propose an indirect feature voting approach that uses user-highlighted rationales to identify the most discriminant features. We present our results on Movie Review data annotated with rationales.
3.1 Data and Experimental Setup
The data set by Pang and Lee (2004) consists of 2000 movie reviews (1000-pos, 1000-neg) from the IMDb review archive. Zaidan et al. (2007) provide rationales for 1800 reviews (900-pos, 900-neg). The annotation guidelines for marking rationales are de-scribed in (Zaidan et al., 2007). An example of a
rationale is: “the movie is so badly put together
that even the most casual viewer may notice the mis-erable pacing and stray plot threads”. For a test dataset of 200 reviews, randomly selected from 1800 reviews, we varied the training data size from 50 to 500 reviews, adding 50 reviews at a time. Training examples were randomly selected from the remain-ing 1600 reviews. Durremain-ing testremain-ing, information about rationales is not used.
We used tokens1, part of speech and dependency triples as features. We used the KStem stemmer (Krovetz, 1993) to stem the token features. In or-der to compare the approaches at their best perform-ing feature configuration, we varied the total num-ber of features used, choosing from the set: {1000, 2000, 5000, 10000, 50000}. We used chi-square
feature selection (Manning et al., 2008) and the SVM learner with default settings from the Minor-third package (Cohen, 2004) for these experiments. We compare the following approaches:
Base Training Dataset (BT D): We train a model from the labeled data with no feature voting.
1filtering the stop words using the stop word list: http:
Rationale annotated Training Dataset (RT D): We experimented with two different settings for in-direct feature voting: 1) only using features that overlap with rationales (RT D(1,0)); 2) features from rationales weighted twice as much as features from other parts of the text (RT D(2,1)). In general, R(i, j) describes an experimental condition where features from rationales are weighted i times and other features are weightedj times. In Minorthird, weighing a feature two times more than other fea-tures is equivalent to that feature occurring twice as much.
Oracle votedTraining Data (OTD):In order to compare indirect feature voting to direct voting on features, we simulate the user’s vote on the features with class association scores from a large dataset (all 1600 documents used for selecting training doc-uments). This is based on the assumption that the class association scores, such as chi-square, from a large dataset can be used as a reliable discriminator of the most relevant features. This approach of sim-ulating the oracle with large amount of labeled data has been used previously in feature voting (Ragha-van et al., 2006).
3.2 Results and Discussion
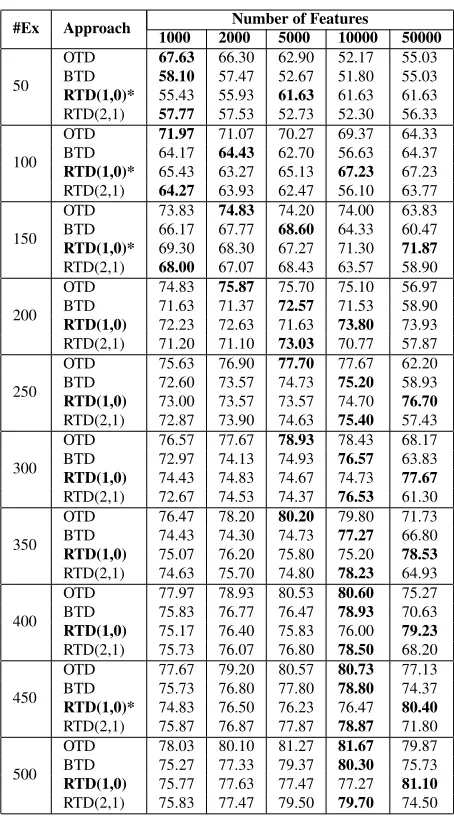
In Table 2, we present the accuracy results for the four approaches described in the previous section. We compare the best performing feature configura-tions for three approaches -BT D, RT D(1,0)and RT D(2,0). As can be seen,RT D(1,0)always per-forms better thanBT D. As expected, improvement with rationales is greater and it is significant when the training dataset is small. The performance of all approaches converge as the training data size in-creases and hence we only present results up to train-ing dataset size of500examples in this paper.
Since our goal is to evaluate the use of rationales independently of how many features the model uses, we also compared the four approaches in terms of the accuracy averaged over five feature configura-tions. Due to space constraints, we do not include the table of results. On averageRT D(1,0) signif-icantly outperforms BT D when the total training dataset is less than 350examples. When the train-ing data has fewer than400 examples,RT D(1,0) also significantly outperformsRT D(2,1).
OT D with simulated user is an approximate
up-#Ex Approach 1000 2000Number of Features5000 10000 50000
50
OTD 67.63 66.30 62.90 52.17 55.03 BTD 58.10 57.47 52.67 51.80 55.03 RTD(1,0)* 55.43 55.93 61.63 61.63 61.63 RTD(2,1) 57.77 57.53 52.73 52.30 56.33
100
OTD 71.97 71.07 70.27 69.37 64.33 BTD 64.17 64.43 62.70 56.63 64.37 RTD(1,0)* 65.43 63.27 65.13 67.23 67.23 RTD(2,1) 64.27 63.93 62.47 56.10 63.77
150
OTD 73.83 74.83 74.20 74.00 63.83 BTD 66.17 67.77 68.60 64.33 60.47 RTD(1,0)* 69.30 68.30 67.27 71.30 71.87 RTD(2,1) 68.00 67.07 68.43 63.57 58.90
200
OTD 74.83 75.87 75.70 75.10 56.97 BTD 71.63 71.37 72.57 71.53 58.90 RTD(1,0) 72.23 72.63 71.63 73.80 73.93 RTD(2,1) 71.20 71.10 73.03 70.77 57.87
250
OTD 75.63 76.90 77.70 77.67 62.20 BTD 72.60 73.57 74.73 75.20 58.93 RTD(1,0) 73.00 73.57 73.57 74.70 76.70 RTD(2,1) 72.87 73.90 74.63 75.40 57.43
300
OTD 76.57 77.67 78.93 78.43 68.17 BTD 72.97 74.13 74.93 76.57 63.83 RTD(1,0) 74.43 74.83 74.67 74.73 77.67 RTD(2,1) 72.67 74.53 74.37 76.53 61.30
350
OTD 76.47 78.20 80.20 79.80 71.73 BTD 74.43 74.30 74.73 77.27 66.80 RTD(1,0) 75.07 76.20 75.80 75.20 78.53 RTD(2,1) 74.63 75.70 74.80 78.23 64.93
400
OTD 77.97 78.93 80.53 80.60 75.27 BTD 75.83 76.77 76.47 78.93 70.63 RTD(1,0) 75.17 76.40 75.83 76.00 79.23 RTD(2,1) 75.73 76.07 76.80 78.50 68.20
450
OTD 77.67 79.20 80.57 80.73 77.13 BTD 75.73 76.80 77.80 78.80 74.37 RTD(1,0)* 74.83 76.50 76.23 76.47 80.40 RTD(2,1) 75.87 76.87 77.87 78.87 71.80
500
[image:4.612.313.540.53.461.2]OTD 78.03 80.10 81.27 81.67 79.87 BTD 75.27 77.33 79.37 80.30 75.73 RTD(1,0) 75.77 77.63 77.47 77.27 81.10 RTD(2,1) 75.83 77.47 79.50 79.70 74.50 Table 2: Accuracy performance for four approaches, five feature con-figurations and increasing training dataset size. Accuracy reported is averaged over five random selection of training documents for three ran-domly selected test datasets. The numbers in bold in a row represents the best performing feature configuration for a given approach and train-ing dataset size. The approach in bold represents the best performtrain-ing approach amongBT D,RT D(1,0)andRT D(2,1)for a given train-ing dataset size. ‘*’ indicates significant improvement in performance overBT D(paired t-test withp <0.05considered significant).
per bound for rationale based approaches. It tells us how far we are from direct supervision on struc-tured features. On average,OT Dsignificantly out-performedRT D(1,0)for training data size of100,
150, 400, 450 and 500 examples but not always. As can be seen from Table 2, difference between OT D and RT D(1,0) reduces with more training data, since with more data and hence more rationales we get better feature coverage.
ask-ing the user to label rationales. However, there is an additional cost associated with the rationales. It is important to evaluate how much total annotation cost rationales can save us while achieving the de-sired performance. In Figure 2, we compare the number of training examples an approach needs to achieve a given level of performance. As can be seen, RT D(1,0)needs fewer training examples to achieve the same performance asBT D. The differ-ence is large initially when the total number of train-ing examples is small (50forRT D(1,0)and150for BT Dto achieve a performance between66−67).
Figure 2: The Figure shows the number of examples needed by the two approaches,RT D(1,0)andBT D, to achieve an accuracy in the given range.
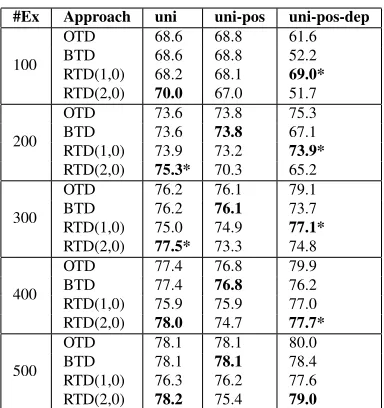
Comparison with Zaidan et al. (2007): Zaidan et al. (2007) conclude that using only features from rationales performs worse than both: 1) using all the features in the documents, and 2) using features that do not overlap with the rationales. The results pre-sented in this paper seem to contradict their results. However, they only experimented with unigram fea-tures and only one approach to using feafea-tures from rationales,RT D(1,0)and notRT D(2,1). In order to compare our work directly with theirs, we exper-imented with an equivalent set of unigram features. In Table 3, we present the results using same num-ber of total features (17744) as Zaidan et al. (2007). As can be seen from the table, when only unigram features are used,RT D(2,1)outperformsBT Dbut RT D(1,0)performs worse than BT D. Thus, our results are consistent with (Zaidan et al., 2007) i.e. using unigram features only from the rationales does not boost performance.
From Table 3, we also analyze the improvement in performance when part of speech and depen-dency features are used in addition to the unigram features i.e. using all degree− 0 subgraph
fea-#Ex Approach uni uni-pos uni-pos-dep
100
OTD 68.6 68.8 61.6 BTD 68.6 68.8 52.2 RTD(1,0) 68.2 68.1 69.0* RTD(2,0) 70.0 67.0 51.7
200
OTD 73.6 73.8 75.3 BTD 73.6 73.8 67.1 RTD(1,0) 73.9 73.2 73.9* RTD(2,0) 75.3* 70.3 65.2
300
OTD 76.2 76.1 79.1 BTD 76.2 76.1 73.7 RTD(1,0) 75.0 74.9 77.1* RTD(2,0) 77.5* 73.3 74.8
400
OTD 77.4 76.8 79.9 BTD 77.4 76.8 76.2 RTD(1,0) 75.9 75.9 77.0 RTD(2,0) 78.0 74.7 77.7*
500
OTD 78.1 78.1 80.0 BTD 78.1 78.1 78.4 RTD(1,0) 76.3 76.2 77.6 RTD(2,0) 78.2 75.4 79.0
Table 3: The Table reports accuracy for four approaches in a setting similar to (Zaidan et al., 2007). Accuracy reported is averaged over ten random selection of training documents for two randomly selected test datasets.The numbers in bold are the best amongBT D,RT D(1,0),
RT D(2,1)for a given feature combination. ‘*’ highlights the signif-icant improvement in performance over BTD (using paired t-test, with
p <0.05considered significant).
tures. For RT D(1,0), adding these features im-proves performance for all data sizes with signifi-cant improvement for dataset size of300and500 ex-amples. RT D(1,0)also significantly outperforms BT D when all three features are used. For direct voting on features (OT D), a significant improve-ment with these structured features is seen when the training dataset size is greater than 200examples. For BT D and RT D(2,1) approaches, there is no significant improvement with these additional fea-tures. In the future, we plan to investigate further the benefit of using higher degree subgraph features for opinion mining from the movie review data.
[image:5.612.78.292.216.358.2]Table 4, RT D(1,0) outperforms BT D in captur-ing the important features when the datasize set is small (<300) and this difference is significant. Be-yond300examples, as the data size increases,BT D outperforms RT D(1,0). This implies that the ra-tionales alone are able to capture the most relevant features when the dataset is small.
100 200 300 400 500 600 700 RO 47.70 53.80 57.68 59.54 62.13 60.86 61.56 TO 31.22 44.43 52.98 60.57 64.61 67.10 70.39 Table 4: Weighted F-measure performance comparison of ranked list of features fromRT D(1,0)&OT D(RO)andBT D&OT D(T O). Results are averaged over ten random selections of the training data for a randomly selected test dataset. Significant differences are highlighted in bold (paired t-test withp <0.05considered significant).
4 Conclusion and Future Work
In this work, we demonstrated that using structured features boosts performance of supervised annota-tion learning. We proposed a formal annotaannota-tion graph representation that can be used to derive these features automatically. However, the space of pos-sible feature subgraphs can grow very large with more prior annotations. Standard feature selection techniques based on class association scores are less effective when the dataset is small. Feature voting from the user for identifying the relevant features is limited to simple features. Supplementary input from the user in terms of highlighted rationales can be used instead to prune the feature space. The pro-posed approach is general and can be applied to a variety of problems and features.
In this work, we presented our results with degree − 0 and degree − 1 feature subgraphs. We will extend our algorithm to automatically ex-tract higher degree features from the annotation graph. For the rationale annotated training data (RT D(i, j)), we experimented with two possible values for i andj. We aim to learn these weights empirically using a held out dataset. Rationales are associated with an additional cost per example and hence two approaches, with and without the ratio-nales, are not directly comparable in terms of the number of examples. In the future, we will conduct an annotation experiment with real users to evaluate the usefulness of rationales in terms of clock time.
Acknowledgments
We would like to thank Dr. Carolyn P. Rose for her help with statistical analysis of the results. We
would also like to thank all the anonymous review-ers for their helpful comments.
References
Cohen W. Minorthird: Methods for Identifying Names and Ontological Relations in Text using Heuristics for
Inducing Regularities from Data. 2004. (http://
minorthird.sourceforge.net/).
Druck G., Mann G. and McCallum A.Learning from la-beled features using generalized expectation criteria.
In Proceedings of the ACM SIGIR, 2008.
Michael Gamon. 2004. Sentiment classification on cus-tomer feedback data: noisy data, large feature vectors, and the role of linguistic analysis. In Proceedings of COLING, 2005.
Haghighi A. and Klein D. Prototype-driven learning for
sequence models. In Proceedings of the NAACL HLT
2006.
Minqing Hu and Bing Liu. 2004.Mining and
Summariz-ing Customer Reviews. In Proc. of the ACM SIGKDD
International Conference on Knowledge Discovery & Data Mining.
Klein D. and Manning C. Accurate Unlexicalized Pars-ing.In Proceedings of ACL 2003.
Krovetz R. Viewing Morphology as an
Infer-ence Process. http://ciir.cs.umass.edu/
pubfiles/ir-35.pdf
Manning C., Raghavan P. and Sch¨utze H.Introduction to
Information Retrieval. Cambridge University Press.
2008.
Nenkova A. and Passonneau R. Evaluating Content
Se-lection In Summarization: The Pyramid Method. In
Proceedings of HLT-NAACL 2004.
Pang B. and Lee L. “A Sentimental Education: Sen-timent Analysis Using Subjectivity Summarization
Based on Minimum Cuts” In Proceedings of the ACL,
2004.
Sameer S. Pradhan, Wayne Ward, Kadri Hacioglu, James H. Martin, Daniel Jurafsky. 2004. Shallow
Seman-tic Parsing using Support Vector Machines. In
Pro-ceedings of HLT/NAACL-2004,Boston, MA, May 2-7, 2004
Raghavan H., Madani O. and Jones R. Active Learning
with Feedback on Both Features and Instances.
Jour-nal of Machine Learning Research, 2006.
Toutanova K. and Manning C.Enriching the Knowledge Sources Used in a Maximum Entropy Part-of-Speech
Tagger. In Proceedings of EMNLP/VLC-2000.
Zaidan O., Eisner J. and Piatko C. Using ”annotator ra-tionales” to improve machine learning for text
catego-rization. In Proceedings of NAACL-HLT 2007.
Zaidan O. and Eisner J. Modeling Annotators: A Genera-tive Approach to Learning from Annotator Rationales.