Read my points: Effect of animation type when speech-reading from
EMA data
Kristy James University of Groningen
Saarland University
Martijn Wieling University of Groningen
The Netherlands
Abstract
Three popular vocal-tract animation paradigms were tested for intelligibility when displaying videos of pre-recorded Electromagnetic Articulography (EMA) data in an online experiment. EMA tracks the position of sensors attached to the tongue. The conditions were dots with tails (where only the coil location is presented), 2D animation (where the dots are connected to form 2D representations of the lips, tongue surface and chin), and a 3D model with coil locations driving facial and tongue rigs. The 2D anima-tion (recorded in VisArtico) showed the highest identification of the prompts.
1 Introduction
Electromagnetic Articulography (EMA) is a pop-ular vocal-tract motion capture technique used increasingly for second language learning and speech therapy purposes. In this situation, an in-structor aids the subject to reach a targeted vocal tract configuration by showing them a live aug-mented visualization of the trajectories of (some of) the subject’s articulators, alongside a targeted configuration.
Current research into how subjects respond to this training uses a variety of different visualiza-tions: Katz et al. (2010) and Levitt et al. (2010) used a ‘mouse-controlled drawing tool’ to indicate target areas as circles on the screen, with the for-mer displaying an ‘image of [the] current tongue position’, the latter displaying a ‘tongue trace’. Suemitsu et al. (2013) displayed a mid-sagittal representation of the tongue surface as a spline be-tween three sensors along the tongue, as well as showing a palate trace and lip coil positions and targets as circles. Katz and Mehta (2015) used
a 3D avatar with a transparent face mesh, pink tongue rig, including colored shapes that lit when touched as targets.
For audiovisual feedback scenarios the optimal manner of presenting the stimuli has not yet been explicitly studied, but rather the experiments have reflected recent software developments. Mean-while, different tools (Tiede, 2010; Ouni et al., 2012) have emerged as state of the art software for offline processing and visualization. The claim that subjects make gains in tongue gesture aware-ness only after a practice period with the visualiza-tion (Ouni, 2011) underlies the need for research into how EMA visualizations can best be pre-sented to subjects in speech therapy or L2-learning settings.
The main inspiration for this work is the find-ing of Badin et al. (2010) that showfind-ing normally-obscured articulators (as opposed to a full face, with and without the tongue) has a positive effect on the identification of VCV stimuli. An estab-lished body of research already focuses on qutifying the intelligibility-benefit or realism of an-imated talking heads, ideally as compared to a video-realistic standard (Ouni et al., 2007; Cosker et al., 2005). However, as the articulators that researchers/teachers wish to present to their sub-jects in the aforementioned scenario are generally outside the line of sight, these evaluation meth-ods cannot be directly applied to intra-oral visu-alizations. We aim to fill this gap by comparing commonly-used EMA visualizations to determine which is most intelligible,1hoping this may guide future research into the presentation of EMA data in a visual feedback setting.
1This word-identification task differs from the most
com-mon speech-training usage whereby a learner’s attention is drawn to the difference between a live animation of their movements and some reference placement or movement.
2 Method
In this experiment, animations of eighteen CVC English words were presented in silent conditions to participants of differing familiarity levels with vocal tract animations in an online survey; sub-jects were asked to identify the word in a forced-choice paradigm (a minimal pair of the prompt could also be chosen) and later give qualitative feedback about their experience speech-reading from the different systems.2
2.1 Participants
Participants were recruited through promotion on social media, university mailing lists, on the inter-net forumReddit and onLanguage Log. In sum, 136 complete responses were collected, with three of these excluded for breaking the experiment over several days. We analyze the results of all 84 na-tive English speakers. Participants had varying levels of previous exposure to vocal tract anima-tions: of those analysed 43% had seen such ani-mations before, 25% had no exposure, 25% had studied some linguistics but not seen such anima-tions, and 6% considered themselves experts in the topic.
2.2 Stimuli
The prompts presented were nine minimal pairs of mono-syllabic CVC words spoken by a single British female speaker recorded for the study of Wieling et al. (2015).
Three of the pairs differed in the onset conso-nant, three in the vowel, and three in the coda con-sonant. Care was taken that the pairs had a signif-icant difference in place or manner that would be visible in the EMA visualization.
In order to compare the animations, they were standardized as follows: a frontal view was pre-sented on the left half of the screen, a mid-sagittal
2The experimental design also collected data about
whether subjects could perceive differences between the competing animation paradigms, for a separate research question.
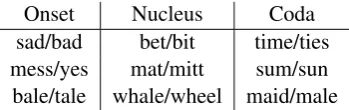
[image:2.595.73.248.670.725.2]Onset Nucleus Coda sad/bad bet/bit time/ties mess/yes mat/mitt sum/sun bale/tale whale/wheel maid/male
Table 1: Prompt minimal pairs, by location of dif-ference.
view with the lips to the left on the right half. No waveform or labeling information was dis-played. Lip coils were green, tongue coils red and chin/incisor coils blue. Where surfaces were shown, lips were pink, and tongues were red. A palate trace, made using each tool’s internal con-struction method, was displayed in black. A white or light grey background was used.
The animations were produced as follows: Dots with tails were produced using functions from Mark Tiede’s MVIEW package (Tiede, 2010), with an adapted video-production script for the standardizations mentioned above. 2D anima-tionswere produced from VisArtico (Ouni et al., 2012), using the internal video-production pro-cesses. 3D animations were produced using a simulated real-time animation of the data in Ematoblender (James, 2016), which manipulates an adapted facial rig from MakeHuman in the Blender Game Engine. See Figure 1 for examples of the three types of visualizations.
2.3 Procedure
This experiment was hosted on the platform Sur-veyGizmo. Firstly the EMA data was explained and participant background information was col-lected. This included information about previous exposure to linguistics studies and vocal tract vi-sualizations. A brief training session followed, in which participants saw four prompts covering a wide range of onset and coda consonants in all three animation systems. They were free to play these animations as many times as they wished.
Subsequently, subjects were presented with two silent animations. The animations were either matching or non-matching (minimal pair) stim-uli, which were displayed as HTML5 videos in web-friendly formats. They were controlled only by separate ‘Play’ buttons below each video. For each of these animations the subject was presented with four multiple choice options (one correct, one minimal pair, one randomly chosen pair, with the items and order retained across both questions). They were also asked to rate whether they believed the two stimuli to be the same word or not.
an-(a) Dots with tails (b) 2D graphics (c) 3D graphics
Figure 1: Different animation paradigms tested.
sum time sad bet whale bad mat bale sun male tale mess yes ties mitt bit maid wheel
3D Dots 2D
Visualization system
Prompt
0.00 0.25 0.50 0.75 1.00
[image:3.595.321.513.191.308.2]Mean Score
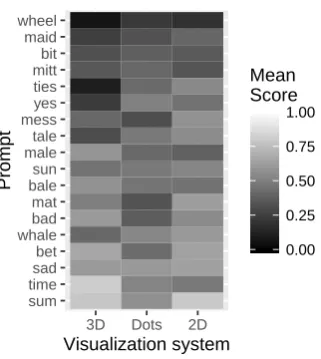
Figure 2: Prompt variability by animation type. Lighter colors indicate a better response.
swer was revealed) was also measured. After each three questions they were asked to rate their con-fidence at guessing the prompts’ identities. Then after twelve questions they were asked to comment about their strategies. Finally, they could complete another six questions, or skip to the concluding qualitative questions.
3 Data Analysis
The prompt identification task yielded a bino-mial dataset based on the correctness of the iden-tification. The random assignment of prompt pairs to system combinations led to an unbalanced dataset, which motivated the use of generalized linear mixed-effects regression models (GLMMs) for analysis (Bates et al., 2015). Random inter-cepts and slopes were included if they improved the model in a model comparison procedure.
In order to take into account the variability in subject responses, random intercepts for subject were included. Similarly, random intercepts were included for each prompt. The prompt variability was quite extensive and is visualized in Figure 2.
ID model (Intercept) −0.26(0.14)
SYSM −0.08(0.11)
SYSV 0.27(0.11)∗
AIC 3261.90
Num. obs. 2486
Num. groups: RESPID 83 Num. groups: PROMPT 18
∗∗∗p <0.001,∗∗p <0.01,∗p <0.05
Table 2: Coefficient, standard error and signifi-cance and of fixed effects for the mixed model of the identification dataset. 2D animations (SYSV) improve identification significantly over the base-line (3D animations). Table created with texreg (Leifeld, 2013).
4 Results
The resulting model for the identification data in-cluded random intercepts for the subject, random intercepts for the prompt (with a random slope for the match-mismatched condition), and a fixed ef-fect for the system, shown in Table 2. The 2D ani-mation was significantly better-identified than the 3D animation. The Dots animation was slightly (but not significantly) less well-performing than the 3D animation.
Even within the most intelligible system (2D graphics), it is evident that there is much variabil-ity in how well participants are able to identify the various prompts (see Figure 2). A generalized lo-gistic mixed-effects regression model was fitted to analyze the effects of onset and coda consonants and the nuclear vowel in the prompts.
[image:3.595.80.241.196.376.2]vowel. In contrast, a stimulus with the vowel /i/ was much less well recognized. As the vowel ne-cessitates greater movements of especially the lips than consonants, it makes sense that the type of vowel is an important predictor. Given that we only had a limited number of stimuli, including the onset or coda together with the nucleus did not help predict the recognition of the stimulus.
The hypothesized effect on the identification score of question number and time spent watch-ing the videos (a learnwatch-ing effect was expected) was not borne out in the results. Though many sub-jects improved over time, others worsened, which could be attributed to fatigue or boredom during the long experiment. Similarly, including the sub-jects’ previous experience with linguistics and vo-cal tract visualizations did not significantly im-prove the model.
5 Discussion
5.1 Identification strategies
The model’s identification of the ease of inter-preting 2D animations was reflected in partici-pants’ comments about the strategies they used for speech-reading. The frequency with which these strategies were mentioned is shown in Table 3.
Strategy Frequency
Lip aperture/shape 71 Mimic the animation 56 Tongue placement/movement 48 Tongue-palate contact/distance 25 Knowledge of phonetics 21 Deduce using answer options 15
Tongue timing 7
Start/end position 5
Counting syllables/gestures 3
Vowel length 2
Visualize someone else 1
Table 3: Identification strategy frequency by num-ber of mentions over all participants.
One participant (ID 1233) summed up the par-ticular difficulty of the ‘dots with tails’ system suc-cinctly: “In the ones with lips and tongue, I spoke each of the possible answers myself and tried to envision how closely my own lips and tongue re-sembled the videos. In the one with just dots, I was purely guessing.”
5.2 Pitfalls of the 3D animation
Whereas it might seem somewhat surprising that the 3D animation did not result in (significantly) better recognition over the simplest representation (dots with tails), participants’ comments highlight some possible causes.
Firstly, the colors of the lips and tongue were similar, which was especially problematic in the front view of this experiment. Though the color choices were made based on VisArtico’s color scheme, the 2D animation avoids this problem by excluding the tongue from the frontal view.
Secondly, participants expressed that they would have liked to see teeth and a facial expres-sion in the 3D animation. They also commented that they expected more lip-rolling movement. In-deed, seeing a more realistic avatar with these cru-cial elements missing may have been somewhat unnatural-looking.
Some linguistically-experienced participants also indicated that they expected a detailed 3D avatar to also indicate nasality, the place where the soft and hard palates meet, or ‘what the throat is doing’. Unfortunately, this information is not available using EMA data.
Finally, many subjects commented that they found the 3D animation ‘too-noisy’ and preferred the ‘clean’ and ‘clearer’ 2D option.3 Subjects’ de-scriptions of their personal identification strategies indicates that they often used lip-reading strate-gies, and that this was easier in 2D where the lip shape was clear, and there was no difficulty with any color contrasts from the tongue. While the graphics quality of the 3D system was not as clear as for the other systems, the setup is similar to the 3D state of the art such as reported in Katz et al. (2014).4
5.3 Additional observations
Though the speaker and analyzed participants all identified themselves as English native speak-ers, two American participants noted that they
3Due to a combination of video capture technique and
data streaming rate (the 3D system was recorded with real-time processing) the frame rate of the 3D system was lower than the other systems. Consequently, some participants also commented they wished for smoother 3D animations.
4The shapes of the tongue and lips in the 3D animation are
perceived the British speaker as having a for-eign/German accent. Several participants men-tioned that their main tactic was mimicking the speaker saying the answer options (and in doing so mimicking their interpretation of the speaker’s accent), which they on occasion found difficult. This underlines the usefulness of using dialect-appropriate trajectories for the speech-reader.
In this experiment, all animations were based on EMA recordings from a single speaker in one recording session. In general usage however, the differing coil placement for each subject and recording session may also affect the identification ability. Other visualization methods (e.g., cine-radiography or MRI) give a high-dimensional pic-ture of the vocal tract and avoid these problems. However, these technologies are not practical for real-time speech training due to their health-risk and cost, respectively. One strategy to compensate for this problem when creating the animations is to use photos of the coil placement during recording to manually specify the offset from the intended placement on the articulator. For example, VisAr-tico allows the user to specify whether the lip coils were placed close to or above/below the lip open-ing.
6 Conclusion
In sum, the simplicity and clarity of 2D graphi-cal animations is preferable for subjects to iden-tify silent animations of EMA data. The features of the most successful animation paradigm sug-gest that future EMA-animations should include both indications of lip and tongue surface shape. If used, 3D models should ensure that they pro-vide clear and clean demonstrations, in which the edges of the articulators (particularly in the frontal view) can easily be distinguished.
References
Pierre Badin, Yuliya Tarabalka, Fr´ed´eric Elisei, and G´erard Bailly. 2010. Can you ‘read’ tongue move-ments? Evaluation of the contribution of tongue dis-play to speech understanding. Speech Communica-tion, 52(6):493–503.
Douglas Bates, Martin M¨achler, Ben Bolker, and Steve Walker. 2015. Fitting linear mixed-effects mod-els using lme4. Journal of Statistical Software, 67(1):1–48.
Blender. https://www.blender.org/. Ac-cessed: 2016-04-14.
Darren Cosker, Susan Paddock, David Marshall, Paul L Rosin, and Simon Rushton. 2005. Toward percep-tually realistic talking heads: Models, methods, and mcgurk. ACM Transactions on Applied Perception (TAP), 2(3):270–285.
Kristy James. 2016. Watch your tongue and read my lips: a real-time, multi-modal visualisation of ar-ticulatory data. Master’s thesis, Saarland Univer-sity/University of Groningen.
William F Katz and Sonya Mehta. 2015. Visual feed-back of tongue movement for novel speech sound learning.Frontiers in human neuroscience, 9. William F Katz, Malcolm R McNeil, and Diane M
Garst. 2010. Treating apraxia of speech (AOS) with EMA-supplied visual augmented feedback. Aphasi-ology, 24(6-8):826–837.
WF Katz, Thomas F Campbell, Jun Wang, Eric Farrar, J Coleman Eubanks, Arvind Balasubramanian, Bal-akrishnan Prabhakaran, and Rob Rennaker. 2014. Opti-speech: A real-time, 3D visual feedback sys-tem for speech training. InProc. Interspeech. r/languagelearning.https://www.reddit.com/
r/languagelearning/. Accessed:
2016-04-14.
Philip Leifeld. 2013. texreg: Conversion of statisti-cal model output in R to LATEX and HTML tables. Journal of Statistical Software, 55(8):1–24.
June S Levitt and William F Katz. 2010. The effects of EMA-based augmented visual feedback on the En-glish speakers´acquisition of the Japanese flap: a per-ceptual study. stroke, 4:5.
Mark Liberman. 2016. Language Log.
http://languagelog.ldc.upenn.edu/ nll/?p=24223. Accessed: 2016-04-14.
MakeHuman Open Source tool for making 3D characters. http://www.makehuman.org/ download.php. Accessed: 2016-02-09.
Slim Ouni, Michael M Cohen, Hope Ishak, and Do-minic W Massaro. 2007. Visual contribution to speech perception: measuring the intelligibility of animated talking heads. EURASIP Journal on Au-dio, Speech, and Music Processing, 2007(1):3–3. Slim Ouni, Lo¨ıc Mangeonjean, and Ingmar Steiner.
2012. VisArtico: a visualization tool for artic-ulatory data. In 13th Annual Conference of the International Speech Communication Association-InterSpeech 2012.
Slim Ouni. 2011. Tongue Gestures Awareness and Pronunciation Training. In ISCA, editor, 12th An-nual Conference of the International Speech Com-munication Association - Interspeech 2011, Flo-rence, Italy, August. (accepted).
SurveyGizmo. http://www.surveygizmo. com/. Accessed: 2015-11-13.
Atsuo Suemitsu, Takayuki Ito, and Mark Tiede. 2013. An electromagnetic articulography-based articula-tory feedback approach to facilitate second language speech production learning. InProceedings of Meet-ings on Acoustics, volume 19, page 060063. Acous-tical Society of America.
Mark Tiede. 2010. MVIEW: Multi-channel visual-ization application for displaying dynamic sensor movements. unpublished.