1
CITE THIS MANUSCRIPT AS FOLLOWS: 2
3
Garzón E., Cano M., O’Kelly B.C. and Sánchez-Soto P.J. (2015) Phyllite clay–cement
4
composites having improved engineering properties and material applications. Applied Clay
5
Sciences, Volume 114, Issue September 2015, pages 229–233.
6
http://dx.doi.org/10.1016/j.clay.2015.06.006 7
www.sciencedirect.com/science/article/pii/S0169131715002185 8
9
Free access to the published article until 9th August 2015 provided at the following link:
10
http://authors.elsevier.com/a/1REKocTCBolz9 11
12 13 14 15 16
PHYLLITE CLAY–CEMENT COMPOSITES HAVING IMPROVED
17
ENGINEERING PROPERTIES AND MATERIAL APPLICATIONS
18 19
E. Garzóna,*, M. Canoa, Brendan C. O’Kellyb, P.J. Sánchez–Sotoc 20
21 22
a
Department of Engineering, High Politechnic College, University of Almería, La Cañada de San 23
Urbano s/n, 04120-Almería, Spain. 24
d
Department of Civil, Structural and Environmental Engineering, Trinity College Dublin, Dublin, 25
Ireland. 26
c
Institute of Materials Science of Sevilla (ICMS), Joint Center of the Spanish National Research 27
Council (CSIC) and University of Sevilla (US), c/Américo Vespucio 49, 41092-Sevilla, Spain. 28
29
*Corresponding author, Phone number: + 34 950 015529 30
E-mail address: [email protected] (E. Garzón) 31
32 33 34
Journal of Applied Clay Sciences, manuscript CLAY7235 35
36
Revised version prepared 18th May 2015 37
Final version published online: 20th June 2015 38
ABSTRACT
40 41 42
Phyllite clays contain clay minerals (chlorite, illite and mixed-layer illite smectite), quartz and 43
feldspars. In this experimental laboratory study, new composites of phyllite clay and cement (5, 7 44
and 9 wt%) were prepared and tested to determine their Atterberg limits, dry density and optimum 45
water content for modified Proctor (MP) compaction, California Bearing ratio, swelling potential 46
after soakage in water, unconfined compressive strength (UCS) and water-permeability coefficient. 47
From the mixes investigated, the composite with 5 wt% cement was deemed most suitable for certain 48
construction material applications, having a plasticity index of 10.5%, maximum dry density of 2.17 49
Mg/m3 and optimum water content of 8% for MP compaction (undergoing no swelling under 50
soakage), a UCS of 0.74 MPa, and very low permeability coefficient value of 7.4 x 10⁻¹¹ m/s. 51
Potential material applications for these new composites include for building construction, roofs, and 52
flexible pavements. 53
54
Keywords:cement, compaction, permeability, phyllites, plasticity, strength 55
56 57 58
Highlights
59 60
First report on stabilization of clay phyllites using cement 61
Effect of 5–9 wt% cement on engineering properties of clay phyllites 62
Most suitable stabilization achieved for phyllite clay with 5 wt% cement 63
64 65 66 67
1. Introduction
68 69
Phyllite clays are rocks (metamorphosed to a low extent) of slate clay materials having an 70
abundance of fine-grained phyllosilicates, which gives them an unctuous feel and the existence of 71
preferential cleavage makes them easily breakable into thin sheets (Adom-Asamoah and Owusu-72
Afrifa, 2010; Garzón et al., 2009a; Oliva-Urcia et al., 2010; Ramamurthy et al., 1993; Valera et al., 73
2002). Phyllite clays can range in color from beige to violet and from reddish to grey and black. 74
Although found in several parts of the world, phyllite clays are predominant in the Almería and 75
Granada provinces (Andalusia region, southeast Spain) (Alcántara-Ayala, 1999; Garzón et al., 76
2009b; Lonergan and Platt, 1995), forming a band of Permo-Triassic materials, along with slates and 77
marble. In recent years, a few publications have reported on different applications of phyllite clays in 78
materials technology; e.g. as a filler in plastic (Valera et al., 2002) and concrete (Adom-Asamoah 79
and Owusu-Afrifa, 2010; Ramamurthy et al., 1993) products. In southeast Spain, phyllite clays have 80
been used as raw materials for some specific applications on account of their compaction properties 81
and very low permeability, including: as covering and to waterproof roofs and the central area of 82
ponds, core material in zoned dams and also for urban waste landfill applications (Garzón et al., 83
2009a, 2009b, 2010). In this instance, for flat roof applications, typically several layers of clay 84
phyllites are placed and compacted on a cane matting base, which is supported by a framework of 85
wooden beams. For gable or hip roof applications, the compacted phyllite clay layers are typically 86
covered by clay brick tiles or slate leaves. From previous work by the authors, compacted phyllite 87
clays sourced from the Almería and Granada provinces (Spain) do not undergo significant swelling 88
ability (Garzón et al., 2009a, 2009b, 2010). However, the expansivity of these phyllite clays at low 90
applied stress limits certain applications; e.g. as a road subgrade material. 91
92
The improvement and (or) stabilization of clayey materials by the addition of cementing 93
agents (e.g. cement or lime) in order to obtain superior engineering properties/performance is a well-94
established technology. The proper design of clayey soil–cement composites includes careful 95
identification of the soil characteristics and an experimental testing programme aimed at identifying 96
an appropriate cementing agent and mix proportion to achieve the required properties/performance 97
for the composite material. Composite materials having attributes superior to those of the raw soil, 98
but produced at similar relative cost, are attractive alternatives for soil material applications, such as 99
Construction and Building Materials, Soil Engineering, and Civil, Structural and Environmental 100
Engineering. Different methods have been reported in the literature on the use of some industrial 101
additives or wastes as cementing agents to improve the properties/performance of raw clayey 102
materials (Arabi and Wild, 1986; Ayuso 1982; Bell, 1996; Gidley and Sack, 1984), laterites (Osula, 103
1996), soil (Attom and Shariff, 1998; Bell, 1996; Miller and Azad, 2000), clayey soil (Kolias et al., 104
2004; Yong and Ouhadi 2007), residual soil (Basha et al., 2005), and expansive clay/soil (Al-Rawas 105
et al., 2005; Ayuso, 1982; Seco et al., 2011). For instance, among the industrial waste materials 106
investigated in these studies were burned olive waste (Attom and Shariff, 1998), cement kiln dust 107
(Miller and Azad, 2000), fly ash (Kolias et al., 2005; Seco et al., 2011), rice husk ash (Basha et al., 108
2005), rice husk fly ash (Seco et al., 2011), artificial pozzolan (Al-Rawas et al., 2005), and coal 109
bottom ash, natural gypsum and aluminatum filler (Seco et al., 2011). 110
111
Regarding clay–cement composites, Chang et al. (2007) studied the material properties of 112
Portland cement paste with nano-montmorillonite additive. They reported that the composites 113
comprising 0.6% and 0.4% of montmorillonite by weight of cement produced the optimum values 114
for compressive strength and the permeability coefficient, respectively, with an increase in 115
compressive strength of ~13% and a decrease in the permeability coefficient of ~50% produced. 116
Hakamy et al. (2014) studied the characteristics of hemp fabric (HF) reinforced clay–cement 117
composites. They reported an optimum replacement of ordinary Portland cement with 1 wt% clay 118
decreased the porosity and significantly increased the density, flexural strength and fracture 119
toughness of HF-reinforced nanocomposite. Potential building applications include the construction 120
of sandwich panels, ceilings, roofing sheets, on-ground floors and concrete tiles. Wei and Meyer 121
(2014) reported the partial replacement of Portland cement by a combination of metakaolin and clay 122
(1, 3 and 5 wt%) in sisal fiber-reinforced cement composites enhanced mechanical properties. 123
124
However, we found no published work in the literature concerning the engineering or 125
hydraulic properties of composites prepared using phyllite clays and cement additive. The present 126
investigation reports an original experimental laboratory study on phyllite clay–cement composites 127
undertaken by the authors to examine the improvement in selected engineering properties compared 128
with the phyllite clay material itself. 129
130 131
2. Experimental
132 133
In the present investigation, selected phyllite clay samples, sourced from Berja (Almería, 134
Spain), and white cement (CEM V/A 32.5 N/mm2 (EN 197-1: CEN, 2000)) were used. In its natural 135
state, the phyllite clay material had a very low gravimetric water content ranging 1–2% (mean of 136
1.8%), a void ratio (volume of voids to volume of solids) of ~0.39, and a dry density of 2.03 Mg/m3 137
(Garson et al., 2010). The sampled phyllite clay material was oven dried at 105–110ºC to constant 138
the fraction passing < 125 μm aperture sieve. Using this size fraction of the phyllite clay, batches 140
comprising 0, 5, 7 and 9 wt% cement were prepared for geotechnical index, compaction, unconfined 141
compressive strength (UCS) and permeability testing. In preparing the composite materials, the 142
phyllite clay and cement were dry mixed for a 1 h period to achieve homogeneity. 143
144
As part of the present investigation, the sampled phyllite clay was characterized by X-ray 145
fluorescence (XRF), X-ray diffraction (XRD) and thermogravimetry. A sample was taken through 146
successive quartering, crushed, lightly ground, sieved to obtain the fraction passing the 63 μm 147
aperture sieve (No. 230 ASTM sieve), oven dried at 105–110ºC for a 24 h period, and then allowed 148
to cool in a desiccator to ambient laboratory temperature. Aliquots of dried material (1–2 g) were 149
then gently ground using an agate mortar for further analysis. For the XRF analysis, an Axios 150
spectrometer (PANanalytical B.V., Germany) was used; with the experimental test conditions, 151
standard certified materials and data processing required previously reported by Garzón et al. 152
(2009a). For the XRD analysis, an X´PERT PRO X-ray diffractometer (PANanalytical B.V., 153
Germany), was used at 36 kV and 26 mA settings, with Ni-filtered CuKα radiation and graphite 154
monochromator. Oven-dried phyllite clay sub-samples were gently ground in an agate mortar and a 155
random-oriented powder mount specimen prepared for XRD testing (Niskanen, 1964; Sánchez-Soto 156
et al., 1993). The XRD instrument, with X’Celerator detector, had the following settings: 2θ range of 157
3–70º; step size of 0.03º (2θ); scan speed of 0.05/240 (2θ/s); counting time of 240 s; divergence slit 158
of ½ (º2θ) and antiscatter slit of ¼ (º2θ). The identification of crystalline phases, according to the 159
files by the Joint Committee for Powder Diffraction Standards, was performed using the software 160
provided by the equipment. 161
162
The phyllite clay and the composites of phyllite clay andcement were characterized by their 163
liquid limit (LL), plastic limit (PL) and plasticity index (PI) values, which were determined in 164
accordance with standard sample preparation and testing procedures (ASTM D4318, 2005). 165
Modified Proctor (MP) compaction tests and California Bearing Ratio (CBR) tests were performed 166
over a range of compaction water contents in accordance with the sample preparation and testing 167
procedures given in ASTM (2014). From the MP data, the optimum water content for compaction, 168
and corresponding maximum dry density value, of the phyllite clay and composite materials were 169
determined. The CRB test method is used to evaluate the potential strength of subgrade, subbase, and 170
base course materials, for use in the design of road and airfield pavements. CBR values were 171
determined by measuring the force required to cause the CBR plunger to penetrate at a specified rate 172
into MP compacted specimens which had been allowed to soak in a water bath for 4 d. The swelling 173
potential of the MP compacted specimens was determined from the measured longitudinal 174
dimensional change of the compacted soil cylinders under soakage (ASTM, 2014). Unconfined 175
compression tests (ASTM, 2013) and water-permeability testing under constant confining stress and 176
controlled-gradient conditions in the triaxial cell were performed on MP compacted specimens (50 177
mm in diameter by 100 mm long) of the phyllite clay and the composites of phyllite clayandcement; 178
these specimens having been allowed to cure in a wet chamber for a 7 d period before performing 179
these tests). 180
181
Finally, the thicknesses (E, in cm) of the flexible pavement required for road work 182
construction using the phyllite clay and its cement composites were calculated using Peltier’s 183
equation (Dal-Ré, 1994): 184
185
E = (100 + 150P1/2)/(I + 5) (1)
186 187
where P is the maximum wheel load (tonne), estimated at 3 tonne, and I is the CBR value, 188
190 191
3. Results and discussion
192 193
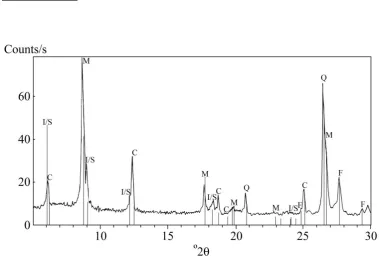
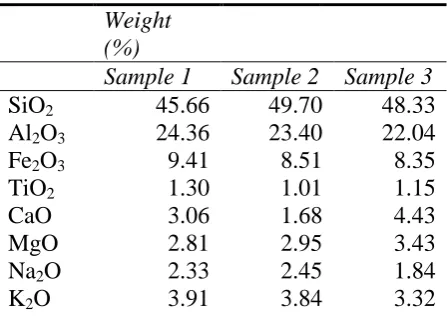
XRF analysis of the raw phyllite clay samples is reported in Table 1 and XRD in Figure 1. 194
From the latter, the mineralogical composition of this material, which had a 6.8% loss in dry mass 195
after a 1 h ignition period at 1000ºC, was identified as chlorite and illite (main clay minerals), quartz 196
with some minor aluminosilicates, potassium feldspar, and an interstratified phase which was 197
identified as mixed-layer illite smectite or possible chlorite smectite. Iron oxide was also detected as 198
a minor component. This mineralogical composition agreed with the chemical composition reported 199
in Table 1. The amount of SiO2 is associated with the presence of quartz and silicates (illite, chlorite, 200
feldspars and interstratified phase). The content of CaO and MgO can be mainly related to the 201
chlorite identified by XRD. The alkaline elements (sodium and potassium) are associated with illite 202
and feldspar because these silicates contain potassium. The 6.8% loss in dry mass on ignition is 203
consistent with the presence of phyllosilicates having structural OH groups, which are lost by termal 204
treatment at 1000oC. 205
206
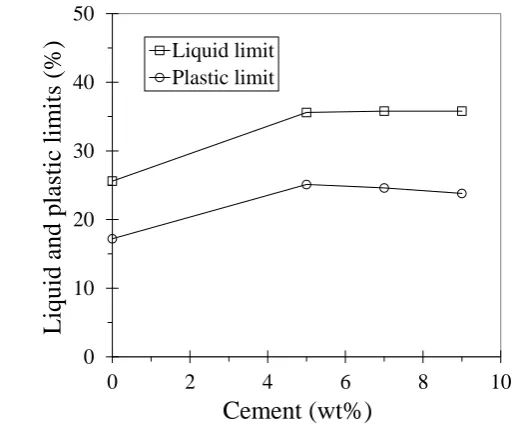
Figure 2 presents the measured LL, PL, and PI (defined as the numeric difference between 207
the LL and PL) values for the phyllite clay and the composites of phyllite clayand cement in their 208
remolded state. For the range of 5–9 wt% cement investigated, the addition of cement produced a 209
step increase in the LL (from 26% to 36%) and the PL (from 17% to 24–25%) (Fig. 2a). This had the 210
effect of producing an apparent approximately linear increase in PI (from 8.4% to 12%) with 211
increasing cement content over the range 0–9 wt% cement (see Fig. 2b). Further, this caused a 212
change in plasticity characterization, from low plasticity (LL < 35%) for the phyllite clay, to 213
intermediate plasticity (LL = 35–50%) for the composites with 5, 7 and 9 wt% cement. This behavior 214
is influenced by the presence of a relative high proportion of clay minerals (chlorite and illite) and 215
the mixed layer in the raw phyllite clay. Hence, the addition of up to 9 wt% cement does not appear 216
effective in reducing the sensitivity of the phyllite clay to water content variation (Bell, 1996; Kolias 217
et al., 2004; Young and Ouhadi, 2007). 218
219
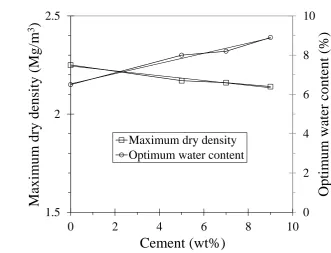
Referring to Fig. 3, MP compactive effort produced quite high maximum dry densities, which 220
were greater than that of the in-situ phyllite clay material (2.03 Mg/m3, Garson et al. (2010)). The 221
MP maximum dry density reduced slightly, and approximately linearly, with increasing cement 222
content; from 2.25 Mg/m3 for the phyllite clay to 2.14 Mg/m3 for the composite with 9 wt% cement. 223
Further, the addition of cement produced a moderate (and again an approximately linear) increase in 224
the optimum water content for MP compaction; from 6.5% for the phyllite clay to 9% for the 225
composite with 9 wt% cement (Fig. 3). This behavior is consistent with that reported previously for 226
other clayey materials, expansive clays and soils (Al-Rawas et al., 2005; Ayuso, 1982; Basha et al., 227
2005; Kolias et al., 2004; Osula, 1996; Yong and Ouhadi, 2007). The slight reduction in maximum 228
dry density values for the clay–cement composites, compared with the phyllite clay, may be 229
explained by the lower density of the cement additive and the higher rigidity of the soil skeleton 230
produced for the composite materials. The moderate increase in the optimum water content is 231
consistent with the increase in plasticity caused by the addition of cement (Fig. 2b). These changes 232
can be associated with a pozzolanic reaction (i.e. chemical reaction between the clay minerals 233
present in the test materials), as occurs with related clay materials (Al-Rawas et al., 2005; Arabi and 234
Wild, 1986; Ayuso, 1982; Basha et al., 2005; Gidley and Sack, 1984; Kolias et al., 2004; Miller and 235
Azad, 2000; Osula, 1996; Seco et al., 2011; Yong and Ouhadi, 2007). In the present study, clay 236
minerals (chlorite and illite) are the main components of the phyllite clay investigated. 237
Referring to Table 2, the CBR values of the composites with 5–9 wt% cement were 239
significantly greater, 36–50% at 100% MP and 15–32% at 95% MP, compared with the 240
corresponding values for the phyllite clay of2.5% and 1.7% respectively. Yong and Ouhadi (2007) 241
proposed a mechanistic model on wetted-state instability of road bases founded on natural and 242
cement-stabilized clayey soils containing phyllosilicates (illite, chlorite and kaolinite), palygorskite 243
(attapulgite), and other minerals including quartz, gypsum, arcanite, thendernite, calcite, and 244
dolomite. Because of the palygorskite present, the clayey material they investigated had some very 245
unique features, with the formation of a transformation product of this fibrous silicate increasing the 246
swelling potential. In the present investigation, the phyllite clay had a measured swelling value of 247
3.6%, whereas the composites with 5–9 wt% cement additive did not experience any swelling under 248
soakage (Table 2). The swelling behavior of phyllite clay is associated with its mineralogical 249
composition (particularly that of the clay minerals), with the zero swelling potential for the 250
composite materials most likely due to the pozzolanic reaction with the 5–9 wt% cement additive. 251
252
Compared with the phyllite clay, the required thickness E of the road pavement necessary to 253
support vehicular traffic provoked by a linear work (Eq. 1) was significantly lower for the composite 254
with 5 wt% cement (see Table 2). Further, based on the limited available data, a general trend of a 255
modest reduction in the pavement thickness occurred with increasing cement content over the range 256
5 to 9 wt% cement investigated. Hence, the addition of cement to phyllite clays for road construction 257
would allow considerable reductions in overall costs. 258
259
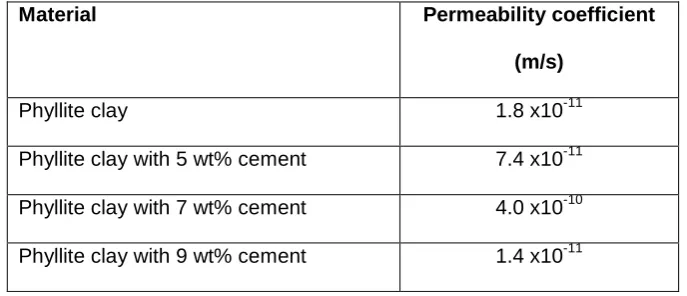
Table 3 lists the measured permeability coefficient values for the MP compacted test 260
materials which were of the order of 10-10 to 10-11 m/s, indicating extremely low permeability. The 261
permeability coefficient values of the composites with 5 and 7 wt% cement were approximately an 262
order of magnitude greater than that measured for the phyllite clay and the composite with 9 wt% 263
cement. 264
265
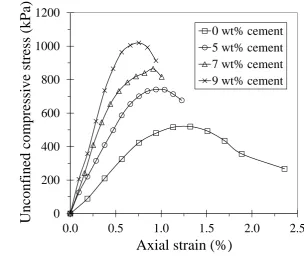
Figure 4a presents unconfined compressive stress against axial strain plots for the different 266
test materials. The UCS increased approximately linearly in value with cement content (Fig. 4b), 267
mobilizing 1.02 MPa for the composite with 9 wt% cement, approximately twice that for the phyllite 268
clay (0.52 MPa). These strength values are in broad agreement with the range reported by Dal-Ré 269
(1994) for expansive soils stabilized with cement for use in earth construction. The stiffness 270
(Young’s modulus) was also found to increase with increasing cement content (Fig. 4a); e.g. the 271
composite with 9 wt% cement was three times stiffer than the phyllite clay. However, the test 272
materials were quite brittle, with the axial specimen strain corresponding to the UCS reducing from 273
1.3% (phyllite clay) to 0.75% (composite with 9 wt% cement) (Fig. 4b). 274
275
The results of this experimental study indicate that a relatively low addition of cement can 276
produce significantly higher UCS values (0.74 MPa for 5 wt% cement), compared with the raw 277
phyllite clay (0.52 MPa). On this basis, ‘green ceramic bodies’ (e.g. bricks and tiles) can be produced 278
at relatively low additional cost using ground phyllite clay with 5–9 wt% cement addition. This was 279
demonstrated in the laboratory by depositing phyllite clay–cement mixtures into 330 x 330 x 16 mm 280
(for bricks) and 280 x 280 x 14 mm (for tiles) molds, consolidating, curing for a 7 d period, and de-281
molding. Using a conventional laboratory press and moderate values of confining pressure, bricks 282
and tiles of different shapes can be manufactured for ready-to-use applications (particularly as 283
impermeabilization products having moderate compressive strength), without the need for firing. 284
However, the PI range (Fig. 2a) is not sufficient for processing of these composite materials by 285
extrusion techniques. Other potential material applications include for building construction, flexible 286
pavements, and road sub-base and sub-grade construction. 287
289
4. Summary and conclusions
290 291
This study reported a new class of composite prepared using phyllite clay and cement 292
additive at 5, 7 and 9 wt%, which has improved engineering properties over the raw phyllite clay. 293
For 5 wt% cement, the composite material had a plasticity index of 10.5%, a maximum dry density 294
of 2.17 Mg/m3 and an optimum water content of 8% for MP compaction, an unconfined compression 295
strength of 0.74 MPa, and very low permeability coefficient value of 7.4 x 10⁻¹¹ m/s. 296
Potential material applications include for building construction, roofs, pavements, and road 297
sub-base and sub-grade construction. For instance, bricks and tiles can be manufactured using 298
ground phyllite clay and cement additive, conventional pressing and a curing period of 7 d, before 299
use in-service. In such instances, pyllite clay–cement composites have the potential for use as a low-300
cost alternative when they are available locally, such as in the Andalusia region, Spain. Further 301
research on the use of phyllite clays in the preparation of mortars and concrete (cement matrix 302
composites) for specific material applications is underway and will be the subject of future reports. 303
304 305
Acknowledgements
306 307
The financial support of Andalusia Regional Government to this investigation through Research 308
Groups RNM and TEP 204 is kindly acknowledged. 309
310 311
References
312 313
Adom-Asamoah, M., Owusu-Afrifa, R., 2010. A study of concrete properties using phyllite as coarse 314
aggregates. Materials and Design 31(9), 4561–4566. 315
Alcántara-Ayala, I., 1999. The Torvizcón, Spain landslide of February 1996: the role of lithology in 316
a semi-arid climate. Geofísica Internacional 38(3), 1–10. 317
Al-Rawas, A.A., Hago, W., Al-Sarni, H., 2005. Effect of lime, cement and Sarooj (artificial 318
pozzolan) on the swelling potential of an expansive soil from Oman. Building and 319
Environment 40(5), 681–687. 320
Arabi, M., Wild, S., 1986. Microstructural development in cured soil-lime composites. Materials 321
Science 21(2), 497–503. 322
ASTM, 2005. D4318-05: Standard Test Methods for Liquid Limit, Plastic Limit, and Plasticity Index 323
of Soils. ASTM International, West Conshohocken, PA, USA. 324
ASTM, 2013. D2166M-13: Standard Test Method for Unconfined Compressive Strength of Cohesive 325
Soil. ASTM International, West Conshohocken, PA, USA. 326
ASTM, 2014. D1883-14: Standard Test Method for California Bearing Ratio (CBR) of Laboratory-327
Compacted Soils. ASTM International, West Conshohocken, PA, USA. 328
Attom, M.F., Al-Shariff, M.M., 1998. Soil stabilization with burned olive waste. Applied Clay 329
Science 13(3), 219–230. 330
Ayuso, J., 1982. Efectividad de la cal y el cemento en el control de la expansividad de la arcilla 331
(Effectiveness of lime and cement in controlling the expansion of clay), Boletín de Información 332
del Laboratorio de Carreteras y Geotecnia 152, 3–11, (in Spanish). 333
Basha, E.A., Hashim, R., Mahmud, H.B., Muntohar, A.S., 2005. Stabilization of a residual soil with 334
rice husk ash and cement. Construction and Building Materials 19(6), 448–453. 335
Bell, F.G., 1996. Lime stabilization of clay minerals and soils. Engineering Geology 42(4), 223–237. 336
CEN, 2000. EN 197-1, 2000: Cement - Part 1: Composition, Specifications and Conformity Criteria 337
T.C., 2007. Material properties of portland cement paste with nano-montmorillonite. Materials 339
Science 42(17), 7478–7487.Dal-Ré, R., 1994. Caminos Rurales: Proyecto y Construcción, 1st 340
edn., Ediciones Mundi-Prensa, Madrid, Spain. 341
Garzón, E., García-Rodríguez, I.G., Ruiz-Conde, A., Sánchez-Soto, P.J., 2009a. Phyllites used as 342
waterproofing layer materials for greenhouses crops in Spain: multivariate statistical analysis 343
to their classification based on X-ray fluorescence analysis. X-Ray Spectrometry 38(5), 429– 344
438. 345
Garzón, E., García-Rodríguez, I.G., Ruiz-Conde, A., Sánchez-Soto, P.J., 2009b. Aplicación de 346
Sistemas de Información Geográfica (SIG) en la prospección y caracterización de materias 347
primas de interés en Cerámica y Vidrio (Application of Geographic Information Systems (GIS) 348
in the search for and characterization of raw materials of interest in ceramics and glass). 349
Boletín de la Sociedad Española de Cerámica y Vidrio 48(1), 39–44 (in Spanish). 350
Garzón, E., Sánchez-Soto, P.J., Romero, E., 2010. Physical and geotechnical properties of clay 351
phyllites. Applied Clay Science 48(3), 307–318. 352
Gidley, J.S., Sack, W.S., 1984. Environmental aspects of waste utilization in construction. 353
Environmental EngIneering, ASCE 110(6), 1117–1133. 354
Hakamy, A., Shaikh, F.U.A., I.M. Low, I.M., 2014. Characteristics of hemp fabric reinforced 355
nanoclay–cement nanocomposites. Cement and Concrete Composites 50(July 2014), 27–35. 356
Kolias, S., Kasselori, V., Karahalios, A., 2004. Stabilization of clayey soils with high calcium fly ash 357
and cement. Cement and Concrete Composites 27(2), 301–313. 358
Lonergan, L., Platt, J.P., 1995. The Malaguide-Alpujarride boundary: a major extensional contact in 359
the Internal Zone of eastern Betic Cordillera, SE Spain. Structural Geology 17(2), 1655–1671. 360
Miller, G.A., Azad, S., 2000. Influence of soil type on stabilization with cement kiln dust. 361
Construction and Building Materials 14(2), 89–97. 362
Niskanen, E., 1964. Reduction of orientation effects in the quantitative X-ray diffraction analysis of 363
kaolin minerals. American Mineralogist 49(May/June), 705–714. 364
Oliva-Urcia, B., Rahl, J.M., Schleicher, A.M., Parés, J.M., 2010. Correlation between the anisotropy 365
of the magnetic susceptibility, strain and X-ray Texture Goniometry in phyllites from Crete, 366
Greece. Tectonophysics 486(1–4), 120–131. 367
Osula, D.O.A., 1996. A comparative evaluation of cement and lime modification of laterite. 368
Engineering Geology 42(1), 71–81. 369
Ramamurthy, T., Venkatappa, G.R., Singh, J., 1993. Engineering behaviour of phyllites. Engineering 370
Geology 33(3), 209–225. 371
Sánchez-Soto, P.J., Macías, M., Pérez-Rodríguez, J.L., 1993. Effects of mechanical treatment on X-372
ray diffraction line broadening in pyrophyllite. Journal of the American Ceramics Society 373
76(1), 180–184. 374
Seco, A., Ramírez, F., Miqueleiz, L., García, B., 2011. Stabilization of expansive soils for use in 375
construction. Applied Clay Science 51(3), 348–352. 376
Valera, T.S., Ribeiro, A.P., Valenzuela-Díaz, F.R., Yoshiga, A., Ormanji, W., Toffoll, S.M., 2002. 377
The effect of phyllite as a filler for PVC plastisols. In: Proceedings of the 60th Annual 378
Technical Conference of the Society of Plastics Engineers (ANTEC 2002), San Francisco, CA, 379
USA. vol. 3, pp. 3949–3953. 380
Wei, J., Meyer, C., 2014. Sisal fiber-reinforced cement composite with Portland cement substitution 381
by a combination of metakaolin and nanoclay. Materials Science 49(21), 7604–7619. 382
Yong, N., Ouhadi, V.R., 2007. Experimental study on instability of bases on natural and 383
9
FOUR Figures
385 386 387 388
389 390 391
Figure 1. XRD diagram of clay phyllite sample. Note: C, chlorite; F, feldspar; I/S, 392
[image:9.595.70.450.85.346.2]10 0
10 20 30 40 50
0 2 4 6 8 10
Liqui
d
and pl
ast
ic
li
m
it
s (%
)
Cement (wt%)
Liquid limit Plastic limit
394
(a) Liquid and plastic limits. 395
396 397
0
5 10 15 20
0 2 4 6 8 10
Pl
as
ti
ci
ty
in
de
x
Cement (wt%)
398
[image:10.595.82.339.88.300.2](b) Plasticity index. 399
11 401
0 2 4 6 8 10
1.5 2 2.5
0 2 4 6 8 10
Optim
um
water
cont
ent
(%
)
Maxim
um
dry densit
y
(Mg/
m
3
)
Cement (wt%)
Maximum dry density Optimum water content [image:11.595.77.409.96.349.2]402
12 0
200 400 600 800 1000 1200
0.0 0.5 1.0 1.5 2.0 2.5
Unconf
ine
d com
pre
ssi
ve st
re
ss
(kPa)
Axial strain (%)
0 wt% cement 5 wt% cement 7 wt% cement 9 wt% cement
404
(a)
Unconfined compressive stress (in kPa) against axial strain. 4050 0.5 1 1.5
0 0.2 0.4 0.6 0.8 1 1.2 1.4
0 2 4 6 8 10
Axial
str
ai
n
at
UC
S
(%
)
UC
S
(M
Pa)
Cement (wt%)
Unconfined compressive strength Strain at failure
406
(b)
Unconfined compressive strength (UCS, in MPa) and corresponding axial strain for 407different cement content. 408
[image:12.595.79.384.86.350.2]409
13
THREE Tables
411 412 413 414 415
Table 1. Chemical analysis by X-ray fluorescence. Note: P2O5 < 0.1%; MnO < 0.08%.
416 417
Weight (%)
Sample 1 Sample 2 Sample 3
SiO2 45.66 49.70 48.33
Al2O3 24.36 23.40 22.04
Fe2O3 9.41 8.51 8.35
TiO2 1.30 1.01 1.15
CaO 3.06 1.68 4.43
MgO 2.81 2.95 3.43
Na2O 2.33 2.45 1.84
K2O 3.91 3.84 3.32
[image:13.595.68.292.167.331.2]418 419 420 421 422 423
Table 2. Results of CBR and swelling tests and calculated road pavement thickness (refer to
424
Eq. 1). Note: E1 and E2, thicknesses of the road pavement required based on measured CBR 425
values for 100% and 95% of MP maximum dry density, respectively, determined in 426
accordance with ASTM (2014). 427
Test material
CBR at 100% MP
(%)
CBR at 95% MP
(%)
Swelling
(%)
E1
(cm)
E2
(cm)
Phyllite clay 2.5 1.7 3.6 48.0 53.7
Phyllite clay with 5 wt% cement 43 15 0 8 18
Phyllite clay with 7 wt% cement 50 28 0 7 11
Phyllite clay with 9 wt% cement 36 32 0 9 10
14 429
[image:14.595.76.420.208.356.2]430 431
Table 3. Evolution of permeability coefficient for MP compacted phyllite clay samples with
432
addition of cement. 433
Material Permeability coefficient
(m/s)
Phyllite clay 1.8 x10⁻¹¹
Phyllite clay with 5 wt% cement 7.4 x10⁻¹¹
Phyllite clay with 7 wt% cement 4.0 x10⁻¹⁰
Phyllite clay with 9 wt% cement 1.4 x10⁻¹¹ 434
435 436 437 438
END