YSDA Participation in the WMT’16 Quality Estimation Shared Task
Anna Kozlova1,2 Mariya Shmatova2 Anton Frolov2
{voron13e02,mashashma,anton-fr}@yandex-team.ru
1Yandex School of Data Analysis, 11/2 Timura Frunze St., Moscow 119021, Russia 2Yandex, 16 Leo Tolstoy St., Moscow 119021, Russia
Abstract
This paper describes Yandex School of Data Analysis (YSDA) submission for WMT2016 Shared Task on Quality Esti-mation (QE) / Task 1: Sentence-level pre-diction of post-editing effort. We solve the problem of quality estimation by using a machine learning approach, where we try to learn a regressor from feature space to HTER score. By enriching the baseline features with the syntactical features and additional translation system based fea-tures, we achieve Pearson correlation of 0.525 on the test set.
1 Introduction
The WMT’16 QE has included the sentence level sub-task. The goal is to predict the amount of ef-fort required to post-edit machine-translated sen-tences. For this task the organizers provide a parallel corpus of English-German sentences ob-tained via some machine translation system, as well as corresponding manually post-edited ref-erence sentences. The amount of post-editing is measured by edit-distance rate HTER (Snover et al., 2006) between the system’s translation and the reference translation. HTER scores were com-puted by TER1software.
Our system extracts numerical features from sentences and uses a machine learning approach to predict HTER score. In addition to the baseline features we include syntactic features.
We also found that HTER scores have a long tailed distribution. More than 60% of examples have HTER score less than 30, at the same time the maximum value (on provided data) is 150, but there are only few sentences getting such high score. This observation led us to an idea first to
1
http://www.cs.umd.edu/˜snover/tercom/
predict BLEU (which is currently the most pop-ular metric for evaluation in MT (Papineni et al., 2002).
The paper is structured as follows: Section 2 describes analysis of provided data, Section 3 con-tains machine learning setup and features details, Section 4 summarizes and discusses the results.
2 Data analysis
The main goal of this task is to predict HTER score given source sentence and corresponding translation. The corpus contains HTER scores greater than 100 (in this task we use HTER * 100%, so the values should be in the range from 0 to 100). Organizers advised to clip scores at 100.
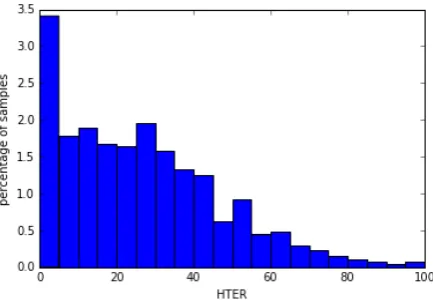
[image:1.595.312.529.468.618.2] [image:1.595.366.467.662.744.2]To analyze the data set we plotted the distribu-tion of HTER (based on capped train data) (see Figure 1 and distribution statistics in Table 1).
Figure 1: HTER distribution for train data
HTER BLEU mean 25.79 0.61
std 20.59 0.24
min 0.0 0.07
25% 9.10 0.42 50% 23.08 0.60 75% 38.46 0.80 max 100.0 1.0
Table 1: Statistics of HTER and BLEU for train data
The plot demonstrates that more than 3% of all examples have score equal to 0. This distribution has sample median of 23 and a long tail. There-fore, the problem is to predict this tail by a few number of examples.
Motivated by this statistics we computed BLEU score, using translation and post-edited variant as a reference. We found that HTER and BLEU have a high Pearson correlation (-0.8423), while BLEU distribution is much easier to predict. Comparison of distributions can be found in Table 1.
According to our experiments, modified 2-gram precision (Papineni et al., 2002) has the best Pear-son correlation with HTER (-0.943). For this rea-son we decided also to use modified 2-gram preci-sion to simplify prediction problem.
3 Model description
This section describes the regression algorithm used to predict HTER score and features details.
3.1 Algorithms
We use SVR with RBF-kernel from scikit-learn toolkit2 for both regressors (BLEU and modified
2-gram precision), where C andγ were found by
grid search on cross-validation. Then we use lin-ear kernel SVR to combine predictions from the previous stage to predict target HTER.
3.2 Features
Along with the provided baseline features (Section 3.2.1), we extracted our own features:
• syntactically motivated features (Section
3.2.2)
• web-scaled language model features (Section
3.2.3)
• pseudo-reference and back-translation fea-tures (Section 3.2.4)
• miscellaneous features (Section 3.2.5)
• combinations of described above features
(Section 3.2.6)
3.2.1 Baseline features
The next 17 baseline features were provided by or-ganizers (Bojar et al., 2015):
1. number of tokens in the source sentence 2. number of tokens in the target sentence
2http://scikit-learn.org/
3. average source token length 4. LM probability of source sentence 5. LM probability of target sentence
6. number of occurrences of the target word within the target hypothesis (averaged for all words in the hypothesis - type/token ratio) 7. average number of translations per source
word in the sentence (as given by IBM 1 table thresholded such that prob(t|s)>0.2)
8. average number of translations per source word in the sentence (as given by IBM 1 ta-ble thresholded such that prob(t|s) > 0.01)
weighted by the inverse frequency of each word in the source corpus
9. percentage of unigrams in quartile 1 of fre-quency (lower frefre-quency words) in a corpus of the source language (SMT training corpus) 10. percentage of unigrams in quartile 4 of fre-quency (higher frefre-quency words) in a corpus of the source language
11. percentage of bigrams in quartile 1 of fre-quency of source words in a corpus of the source language
12. percentage of bigrams in quartile 4 of fre-quency of source words in a corpus of the source language
13. percentage of trigrams in quartile 1 of fre-quency of source words in a corpus of the source language
14. percentage of trigrams in quartile 4 of fre-quency of source words in a corpus of the source language
15. percentage of unigrams in the source sen-tence seen in a corpus (SMT training corpus) 16. number of punctuation marks in the source
sentence
17. number of punctuation marks in the target sentence
3.2.2 Syntactically motivated features
We decided to use morphosyntactical information, that can be extracted from source and translation sentences.
The intuition is the more syntactically complex the source sentence is, the more corrections during post-editing are needed.
Firstly, the features based on syntactic tree structure for source and translation were extracted:
• tree width, i.e. how many dependencies the root has
• maximum tree depth, i.e. maximum number
of dependency levels in the tree
• average depth of the tree
• proportion of internal nodes in the tree
Secondly, the information obtained from POS-tags and dependency roles (for both: source and trans-lation) was used:
• number of verbs
• number of verbs with dependent subjects • number of nouns
• number of subjects
• whether the sentence begins with a verb (in-dicator feature)
• number of conjunctions
• whether the German polite imperative is used
as a translation for the simple English imper-ative (‘F¨ugen Sie’ for ‘Add’).
Thirdly, source-side syntactic features were ex-tracted:
• number of relative clauses (the more relative clauses the sentence has, the poorer the trans-lation is likely to be)
• number of attributive clauses
Due to the parser’s imperfection, it is also use-ful to inform the machine learning algorithm how confident we are that the sentence is parsed cor-rectly. We use parsing scores for source and trans-lation as additional features, as well as their differ-ence, bearing the following observation in mind: it is more difficult to parse poorly translated sen-tence and a large difference is likely to be an indi-cator that more corrections will be required during post-editing.
3.2.3 Additional resources
It is well known that the performance of SMT sys-tems heavily relies on the quality of their language models. We used in-house web-scale language models containing hundreds of millions ngrams to make the following features:
• Web LM probability for source and
transla-tion
• Web LM probability for translation with splitted compounds
• Web LM probability for translation without punctuation
• percentage of rare words in translated
sen-tence – for each word we calculate Web LM probability and count percentage of words with weights lower than certain threshold. Threshold was chosen empirically by as-sumption, that terms, compounds, foreign and other rare words have lower probability. About 30% of all unique words in train set were marked as rare.
3.2.4 Pseudo-references and back-translations
Another set of features was obtained by using translations from additional online translation sys-tem3. For our purposes we generated two types of
translations:
• pseudo-references for source sentence
• back-translations (Shigenobu, 2007) for ma-chine translation
For both types of translation we calculated fol-lowing features:
• BLEU
• modified 1-gram precision
• modified 2-gram precision
• modified 3-gram precision
• modified 4-gram precision
• brevity penalty
3.2.5 Miscellaneous features
We propose to use some information, which can be obtained from plain text:
• number of quotation marks – an odd number of quotations in the translation often indicates incorrect translation
• number of words ending with hyphen –
a possible indicator of sentence complex-ity and, sometimes, errors (“Pinsel- Pop-upmen¨u” should be “Pinsel-PopPop-upmen¨u” or “ ¨Uberschriften- und eine Liste” should be “ ¨Uberschrift und einer Liste”)
• whether the sentence contains an url address • number of untranslated words
Some features were based on data provided for the QE sub-task 2 “Word and phrase-level QE” – word-level alignments between source and trans-lation sentences:
• mean number of alignments for each source word
• maximum number of alignments for each
source word
• number of unaligned words in translation
3.2.6 Feature combinations
Also we decided to use additional features, which were combined from ones described earlier. For example, if source part had 2 quotations, and translation has 3, we decided to indicate it some-how. For these reason we added differences be-tween following features:
• number of punctuation marks in source and translation sentences
• number of quotations in source and
transla-tion sentences
• LM probabilities of source and translation sentences
• Web LM probabilities of source and
transla-tion sentences
• Web LM probabilities of translation before and after compounds splitting
• Web LM probabilities of source sentence and
translation with splitted compounds
• Web LM probabilities of source sentence and translation without punctuation
• number of words in source and translation sentences
4 Experiments and Results
4.1 Preprocessing
Taking into consideration domain specifics of the data, i.e. large amount of URLs, file names, as well as presence of compounds in German, we make a simple preprocessing by applying the fol-lowing rules:
• replace URLs and file names with a single dummy token
• split German compounds with compound
splitting algorithm similar to (Koehn and Knight, 2003)
• remove redundant punctuation from provided
machine translations
4.2 Feature selection
We applied the following popular feature selection algorithms to detect weak features:
• removing features with low variance
• univariate feature selection
Due to this analysis, two baseline features were removed: “percentage of unigrams in quartile 1 of frequency (lower frequency words) in a cor-pus of the source language (SMT training corcor-pus)” and “percentage of trigrams in quartile 1 of fre-quency of source words in a corpus of the source language”.
4.3 Feature scaling
Since features have different nature, fea-ture normalization is needed. Every feature was scaled with the following transformation
x = x−stdmean(x)(x), where mean is the feature’s
mean value and std is its standard deviation.
Mean and std for each feature were extracted from train set. After this procedure every feature has zero mean and a standard deviation of 1.
4.4 Evaluation
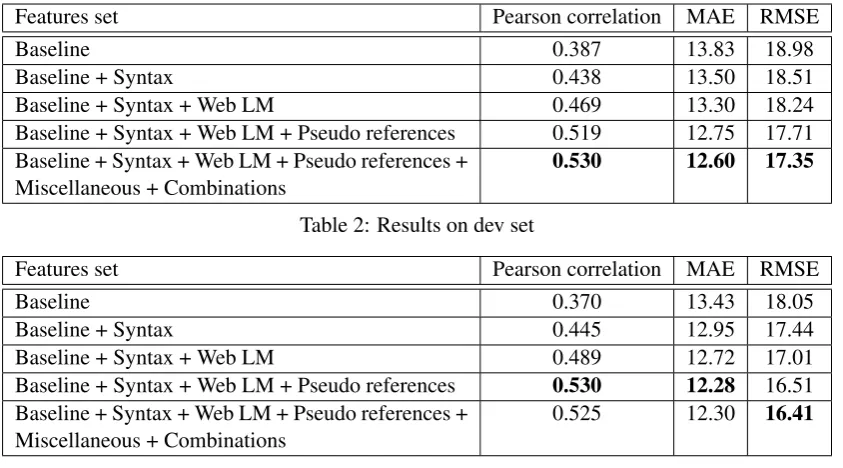
Features set Pearson correlation MAE RMSE
Baseline 0.387 13.83 18.98
Baseline + Syntax 0.438 13.50 18.51
Baseline + Syntax + Web LM 0.469 13.30 18.24 Baseline + Syntax + Web LM + Pseudo references 0.519 12.75 17.71 Baseline + Syntax + Web LM + Pseudo references +
Miscellaneous + Combinations 0.530 12.60 17.35 Table 2: Results on dev set
Features set Pearson correlation MAE RMSE
Baseline 0.370 13.43 18.05
Baseline + Syntax 0.445 12.95 17.44
Baseline + Syntax + Web LM 0.489 12.72 17.01 Baseline + Syntax + Web LM + Pseudo references 0.530 12.28 16.51 Baseline + Syntax + Web LM + Pseudo references +
Miscellaneous + Combinations
[image:5.595.90.512.61.295.2]0.525 12.30 16.41
Table 3: Results on test set
4.5 Results
Results on dev and test sets can be found in Ta-bles 2 and 3 respectively. All experiments have the same preprocessing setup. Since BLEU ranges from 0 to 1, we clip predicted values to fit into this interval. Predicted HTER is also clipped to fit into [0, 100] interval.
Feature set names are as follows:
1. Baseline features contains provided 17 fea-tures. For the next experiments we used 15 baseline features, which remained after fea-ture selection.
2. Syntax features use syntactical information about sentences (Section 3.2.2).
3. Web LMfeatures are additional resource fea-tures (Section 3.2.3).
4. Pseudo references features use informa-tion from pseudo-references and back-translations (Section 3.2.4).
5. Miscellaneous + Combinations features in-clude miscellaneous information from sen-tences and features combinations (Sec-tion 3.2.5, Sec(Sec-tion 3.2.6).
So the experiments described above led to sig-nificant improvement of classifier’s quality. The most noticeable increase was achieved by imple-menting syntactically motivated features. This re-sult is related to the fact that sentences with com-plex syntactical structure are difficult to translate. Moreover, syntax of poorly translated sentences is
harder to parse, leading to less confident parsing scores.
Adding features based on pseudo-references also improves the quality of our model. Those cases, where translations differ from pseudo-references, are likely to be complex for MT. Back-translation features were also helpful for checking out whether the original meaning was lost during translation.
It is worth noting, that optimal features for the test set and the dev set differ. The best model has been chosen according to the dev set, so some ad-justment to this set could occur. Despite it there are only 1000 sentences in the dev set and this could be insufficient for obtaining adequate esti-mation.
4.6 Feature importances
After model training we calculated the most infor-mative features using Random Forest (Breiman, 2001) algorithms:
• modified 2-gram precision for pseudo-reference (Pseudo references)
• percentage of trigrams in quartile 4 of fre-quency of source words in a corpus of the source language (Baseline)
• LM probability of source sentence (Baseline)
• difference between syntactical parser scores
of source and machine translation (Syntax)
• percentage of bigrams in quartile 4 of fre-quency of source words in a corpus of the source language (Baseline)
• BLEU for back-translation (Pseudo
refer-ences)
• difference between LM probability of source and translation (Combinations)
• Web LM probability of machine translation
(Web LM)
• average number of translations per source word in the sentence (as given by IBM 1 table thresholded such that prob(t|s)>0.2) ( Base-line)
4.7 Discussion
While analyzing results we found some MT-sentences, that receive small scores from our algo-rithm (predicted HTER – pHTER) and at the same time have large HTER scores.
There are cases, where the editor attempts to broaden the context rather than to minimize the number of corrections. For example, while the original translation is valid and no corrections are needed, it is completely rewritten by the editor:
SRC: Complete the dialog box . MT: F¨ullen Sie das Dialogfeld .
PE: Nehmen Sie im Dialogfeld die er-forderlichen Einstellungen vor . HTER: 66.667
pHTER: 7.899
It can be seen here, that our regressor predicts small edit distance, while edit distance between MT and PE is over 50 (that means the translation is incorrect).
There is also inconsistency in the way German compounds are treated. In some cases a com-pound in machine translation is replaced with a combination of two words in post-edited sentence, while in others it remains joined. For example, in one case“Kan¨alebedienfeld” is replaced with
“Bedienfeld Kan¨ale”, but in another – it stays the same. And the difference between HTER score and predicted score in second case is larger, re-spectively. There are also opposite cases, when words are joined into a single German compound in post-edited sentence.
Similar observation holds for sentences with if-clauses, where they are swapped with main clauses: in some cases post-edited sentence con-tains swapped clauses, but in others the original order is kept.
It was noticed, that there is no regularity in post-editings. This can lead to greater difference be-tween original and predicted HTER scores as well as cause noise during machine learning. It can also be critical while training set is not very large and peculiarities mentioned above can affect algorithm adversely.
5 Conclusions and future work
In this paper YSDA submission for WMT16 Shared Task on Quality Estimation (QE) / Task 1: Sentence-level prediction of post-editing effort, is discussed. This work is based on the idea that the more complex the sentence is the more difficult it is to translate. For this purpose, the informa-tion, provided by syntactic parsing, was used. This allowed to estimate the quality of machine trans-lated sentences as well as complexity of source sentences. We also decided to replace the target metric for the regressor (HTER to BLEU) to ob-tain a more robust machine learning solution. Fur-ther work will address the implementation of our model for other language pairs. It would be inter-esting to study how this approach works for dis-tant language pairs (i.e. English-Turkish). We also plan to work on syntactically motivated features in order to extract more complex, as well as more in-formative, features from parsed data.
6 Acknowledgements
We thank Irina Galinskaya and Alexey Baytin for their help and detailed feedback.
References
Ondˇrej Bojar, Rajen Chatterjee, Christian Federmann, Barry Haddow, Matthias Huck, Chris Hokamp, Philipp Koehn, Varvara Logacheva, Christof Monz, Matteo Negri, Matt Post, Carolina Scarton, Lucia Specia, and Marco Turchi. 2015. Findings of the 2015 workshop on statistical machine translation. InProceedings of the Tenth Workshop on Statistical Machine Translation, pages 1–46, Lisbon, Portugal, September. Association for Computational Linguis-tics.
Leo Breiman. 2001. Random forests. Machine learn-ing, 45(1):5–32.
Kishore Papineni, Salim Roukos, Todd Ward, and Wei-Jing Zhu. 2002. BLEU: a method for automatic evaluation of machine translation. InProceedings of the 40th annual meeting on association for compu-tational linguistics, pages 311–318. Association for Computational Linguistics.
Tomohiro Shigenobu. 2007. Evaluation and usabil-ity of back translation for intercultural communica-tion. InUsability and Internationalization. Global and Local User Interfaces, pages 259–265. Springer.
Matthew Snover, Bonnie Dorr, Richard Schwartz, Lin-nea Micciulla, and John Makhoul. 2006. A study of translation edit rate with targeted human annotation. In Proceedings of association for machine transla-tion in the Americas.