90
Jointly Measuring Diversity and Quality
in Text Generation Models
Ehsan Montahaei∗ Sharif University of Technology / Tehran, Iran
Danial Alihosseini∗ Sharif University of Technology / Tehran, Iran
Mahdieh Soleymani Baghshah Sharif University of Technology / Tehran, Iran
Abstract
Text generation is an important Natural Lan-guage Processing task with various applica-tions. Although several metrics have already been introduced to evaluate the text genera-tion methods, each of them has its own short-comings. The most widely used metrics such as BLEU only consider the quality of gener-ated sentences and neglect their diversity. For example, repeatedly generation of only one high quality sentence would result in a high BLEU score. On the other hand, the more re-cent metric introduced to evaluate the diver-sity of generated texts known as Self-BLEU ignores the quality of generated texts. In this paper, we propose metrics to evaluate both the quality and diversity simultaneously by ap-proximating the distance of the learned gen-erative model and the real data distribution. For this purpose, we first introduce a metric that approximates this distance using n-gram based measures. Then, a feature-based mea-sure which is based on a recent highly deep model trained on a large text corpus called BERT is introduced. Finally, for oracle train-ing mode in which the generators density can also be calculated, we propose to use the dis-tance measures between the corresponding ex-plicit distributions. Eventually, the most popu-lar and recent text generation models are eval-uated using both the existing and the proposed metrics and the preferences of the proposed metrics are determined.
1 Introduction
Generative models and especially Generative Ad-versarial Networks (GANs) have been received much attention in the last few years. However, the evaluation of generated samples by these models is challenging. Although some studies have recently focused on introducing measures like Inception
∗
These authors contributed equally to this work.
Score and Fr´echet Inception Distance (FID) to compare results of different GAN models for im-age generation, there is not a study to propose proper metrics for evaluation of text generation models. In the last few years, many GAN-based text generation models (Yu et al.,2017;Lin et al., 2017;Che et al., 2017; Guo et al., 2018; Zhang et al.,2017) have been proposed. However, mea-suring the performance of these models in the cor-responding papers is not comprehensive. GANs suffer from the mode collapse problem (Metz et al., 2016) and the GAN-based text generation models may just produce a highly limited set of sentences and therefore just considering the qual-ity of these generated sentences for comparison is not comprehensive.
On the other hand, there are measures like Self-BLEU (Zhang et al.,2017) for evaluating the di-versity of generated sentences, but they can not consider the quality of samples at all. Besides, de-signing an experiment of evaluating diversity by humans is not straightforward and thus it’s neces-sary to have a jointly quality-diversity measuring metric.
im-age generation tasks and advent of a recent highly deep model named BERT (Devlin et al., 2018) as a reference feature extractor for natural lan-guage texts, a metric is proposed for evaluation of natural language generation. Finally, appro-priate divergences between the oracle distribution and the (learned) model distribution is introduced for when the probabilistic oracle is considered as synthetic data distribution (and thus the target dis-tribution is available for evaluation).
2 Text Generation Models
The neural models on text generation first used LSTMs and trained them by the Maximum Like-lihood Estimation (MLE) via teacher forcing (Hochreiter and Schmidhuber,1997). These mod-els suffer from the exposure bias problem which is due to the train-test discrepancy. Although some solutions such as scheduled sampling were intro-duced to overcome the exposure bias problem, it has been shown that they are incompatible with the language nature (Bengio et al.,2015;Huszar, 2015). By introducing GANs (Goodfellow et al., 2014) as successful image generation models, it has gained much attention to propose GAN-based text generation models. However, the discrete na-ture of text needs the generator with discrete out-puts that makes passing the gradient from the dis-criminator to the generator difficult. SeqGAN (Yu et al., 2017) alleviates this difficulty by a gra-dient policy approach using a REINFORCE-like method to train the generator as a stochastic pol-icy. This method has some difficulties such as reward sparsity and high variance for large ac-tion spaces. Subsequent methods try to pass more informative signal from the discriminator to the generator. RankGAN(Lin et al., 2017) trains the discriminator as a ranker which assigns a higher score to the more realistic sequences (in compar-ison with other sentences in the current batch). LeakGAN (Guo et al., 2018) takes advantage of the feudal networks and considers the discrimina-tor as a manager and the generadiscrimina-tor as a worker while the feature layer of the discriminator is fed to the generator as leaked information. MaliGAN (Che et al., 2017) attempts to redefine the gener-ator’s objective. It minimizes KL divergence be-tween the generator and the real distribution which is obtained by the discriminator in the optimality assumption of the discriminator. This new objec-tive leads to an importance sampling procedure.
TextGAN (Zhang et al.,2017) also applies a new objective for the generator. It tries to push the gen-erator focus from the last layer of the discrimina-tor to its last feature layer. Real data and gener-ator samples will each have some distribution in the feature layer of the discriminator. The gener-ator’s objective is to make them closer by Maxi-mum Mean Discrepancy (MMD) metric.
3 Metrics
In this section, we first indicate the main difficul-ties of the existing measures for evaluation of text generation models. Then, we introduce metrics that evaluate the capability of the models in gen-erating both right sentences and various ones. The proposed metrics (that are all symmetric) jointly specify to what extent probable sentences in real data are likely in the generative model and also the probable sentences in the model are likely in the real data.
3.1 Shortcomings of the existing metrics
In this section, shortcomings of the metrics that either evaluate the quality or the diversity of gen-erated samples are presented. Moreover, a recent attempt to simultaneously considering these met-rics is introduced.
3.1.1 Quality metrics
shows the validity of their outputs without consid-ering their coverage.
Oracle-NLL: It was introduced by SeqGAN (Yu et al.,2017) and is based on assuming a syn-thetic oracle distribution. It considers a random distribution as the real distribution (or the oracle) and the training dataset is prepared by sampling from this distribution. The score is defined to be the Negative Log Likelihood (NLL) of the gener-ated samples from the trained model in the oracle distribution. In this measure, the coverage is again neglected and a model that generates only one high quality sentence can reach high performance.
3.1.2 Diversity metric
As mentioned above, BLUE and Oracle-NLL just consider the quality of the generated samples and ignore their diversity. Below, we introduce two metrics measuring the diversity. However, these metrics evaluate only diversity and don’t consider the quality of samples at all.
Self-BLEU: In (Zhu et al., 2018), Self-BLEU was introduced to evaluate just variety of sen-tences. It measures BLEU score for each gener-ated sentence by considering other genergener-ated sen-tences as reference. By averaging these BLEU scores (obtained for generated sentences), a met-ric that is called Self-BLEU is achieved where its lower values shows more diversity.
Entropy: On the other side, we can use the en-tropy of probabilistic generative model to measure the diversity where the lower values show lower diversity. As the direct calculation of the entropy is not feasible, a Monte-Carlo estimation of it can be used.
3.1.3 Quality and diversity
Recently (Caccia et al.,2018) mentioned the flaws of only evaluating the quality and found that MLE outperforms the GAN variants for text generation since it dominates GANs in the quality-diversity space. (Caccia et al., 2018) uses the quality-diversity spectrum obtained by changing the tem-perature parameter that controls entropy of the models’ conditional distributions. However, it does not provide a measure to assess both the qual-ity and the diversqual-ity without needing to inspect the whole quality-diversity spectrum.
Likelihood: Although the likelihood of a gen-erative model on real (test) data evaluates the abil-ity of the model in generating the test samples, it doesn’t measure the quality of the whole set of
generated texts by the model. In fact, a model with a low NLL value on test data (or equivalently a model in which the likelihood of the test data is high) may also assign high probability to many other sentences that are not valid or qualified. Specifically for sequence models, the likelihood doesn’t assess the free-running mode of models. To be more detailed, most of the probabilistic se-quence models, decompose the joint distribution to conditional distributions using the chain rule. These conditional distributions are the probabil-ity of each token conditioned on the prior tokens. Thus, in the likelihood evaluation, each of token’s probability is conditioned on a prefix that is a real sequence itself and the likelihood is not assessed on the previously generated tokens of the model during evaluation (it is similar to the exposure bias problem of MLE for sequence generation).
Moreover, measuring a model by its likelihood score has another problem. When a model misses one mode of a multi-modal distribution, its score decreases severely; so it is an unfair metric for comparing MLE method with other methods be-cause MLE method uses likelihood as its objec-tive and has mean seeking behavior (Goodfellow, 2017).
3.2 Proposed metrics
In this section, we propose metrics that simultane-ously considers the quality and the diversity of the generated samples. To this end, we compare the real distribution of texts with the obtained distri-bution by the text generation model.
3.2.1 MS-Jaccard
We first propose a metric that finds the similarity of the generative model and the real distribution by comparing text samples generated by them. To this end, n-grams of generated samples and those of real samples are considered as two multi-sets (that also preserve repetition of n-grams) and the similarity of the resulted multi-sets is computed. In simple words, the MS-Jaccard focuses on the similarity of the n-grams frequencies in the two sets and inspired by the well-known Jaccard Index which determines the similarity of two sets as the ratio of the cardinality of their intersection to that of their union.
n-grams of two setsS1andS2is defined as:
scoren=
P
g∈Gnmin{Cn(g, S1), Cn(g, S2)}
P
g∈Gnmax{Cn(g, S1), Cn(g, S2)}
.
(1) The geometric mean of the {scoren}Nn=1 will be the MS-Jaccard score called MS-Jaccard-Nwhere the N is the maximum length of n-grams. It is worth noting that the frequencies of the n-grams in each set is normalized with respect to the total number of sentences in the set (to avoid diminish-ing the score when the size of only one of these sets grows). Thus, theCn(g, S) will denotes the average frequency per sentence for n-gramgin the setS. If the generated sentences won’t have diver-sity or quality, the n-gram distribution of generated texts will be different from that of the real texts and causing to decrease the MS-Jaccard score con-sequently. As it is obvious, the MS-Jaccard is a similarity measure and so its higher value will be better.
3.2.2 Fr´echet BERT Distance (FBD)
One popular metric for evaluation of image gen-eration models is FID introduced in (Heusel et al., 2017). Each of real and generated images in a fea-ture space (found by Inception network) is mod-eled by a Gaussian distribution, and the FID is de-fined as the Fr´echet distance between these two Gaussian distributions. We want to introduce a similar measure for the text generation task. To this end, we utilize BERT (Devlin et al., 2018) that provides a proper feature space for texts. We use Fr´echet distance in BERT’s feature space as a metric that considers quality and variety of gen-erated sentences, and name it Fr´echet BERT Dis-tance (FBD). There is a set of pooled features (for classification task) in the BERT network that has a constant size for different input sequence lengths; we used these features for FBD. The Fr´echet dis-tance is also known as Wasserstein-2 divergence, and this distance between two Gaussian distribu-tion is as follows:
q
||m1−m2||22+T r(C1+C2−2(C1C2)1/2), (2) wheremiandCishow the mean vector and the co-variance matrix of these Gaussians respectively. It should be noted as the FBD is a distance measure, its lower values will be better.
3.2.3 Oracle Based Evaluation
In Oracle-NLL evaluation introduced in (Yu et al., 2017), the measured distance is Kullback–Leibler (KL) divergence of the generative model and the oracle which ignores the variety of generated sen-tences. On the other hand, the inverse KL (that is relevant to the likelihood of real data in the text generation model) can not guarantee the quality of generated samples by the model. We propose measuring the distance of the probabilistic oracle distribution P (that generates real data) and the probabilistic generative modelQby a symmetric distance as an evaluation metric. A wide range of distances can be utilized for this purpose. One symmetric distance is Bhattacharyya that can be estimated by the Monte-Carlo as below:
B(P, Q) =
−1 2
ln 1
N N
X
i=0
s
q(xi) p(xi)
+ ln 1
M M
X
j=0
s
p(xj) q(xj)
,
(3) where{xi}and{xj} are sets of samples fromP and Q distributions respectively. Similar to the FBD, Bhattacharyya is also a distance measure and thus its lower values are better.
4 Evaluation
In this section, we first conduct some experiments to evaluate text generation models using the exist-ing and the proposed measures. Then, we discuss about the appropriateness of the proposed metrics.
4.1 Datasets
We evaluate the models on COCO image captions (Lin et al.,2014), EMNLP2017 WMT News ( Bo-jar et al., 2017), and IMDB (Maas et al., 2011) as the popular datasets for text generation. In ad-dition to these datasets, similar to (Yu et al.,2017; Lin et al.,2017;Guo et al.,2018), we also consider a synthetic oracle produced by a probabilistic text generator that is a random initialized LSTM as a synthetic dataset. The description of the datasets is as follows:
training, 20,000 samples for validation, and 20,000 for test.
• EMNLP2017 WMT News (Bojar et al., 2017): It is a collection of news texts for the machine translations task1. Among a version of this dataset for English corpus containing 500,000 sentences, sentences having more than 3 words with less than 150 frequency (these words are replaced with UNK) were dropped and sentences that have between 20 and 40 words selected. The vocab size of the resulted dataset is 6,148. Among this dataset, 40,000 samples are used for training, 20,000 samples for validation, and 20,000 for test.
• IMDB Movie Reviews (Maas et al.,2011): It is a collection of IMDB movie reviews for the sentiment analysis task, containing 25,000 la-beled and 50,000 unlala-beled ones. We have selected the first two sentences of each review and replace words with less that 50 times fre-quency with UNK and keep sentences from length 5 to 40 with less than 5 UNKs. The fi-nal dataset is subsampled to have 20,000 sen-tences for training data, 10,000 for validation, and 10,000 for test data leading to vocab size of 5,810.
• Oracle synthetic dataset (Yu et al., 2017): A randomly initialized LSTM generator as a real distribution used in oracle training mode; the network implementation is bor-rowed from the SeqGAN released code2. This network’s hidden size is 32 and its em-bedding size is 3,200. Moreover, the vocab size is 5,000 and the length of sequences is 20. The dataset of 100,000 samples are gen-erated according to the above model. Among this dataset, 50,000 samples are used for training, 25,000 for validation, and 25,000 for test.
4.2 Experimental Setup
4.2.1 Text Generation Models
As the recent methods for text generation, we eval-uate SeqGAN (Yu et al., 2017), RankGAN (Lin et al.,2017), and MaliGAN (Che et al.,2017). We also consider vanilla Maximum Likelihood Esti-mation (MLE) language model using LSTM as the
1
http://statmt.org/wmt17/translation-task.html
2https://github.com/LantaoYu/SeqGAN/
baseline method. We used the implementation of the above methods in the Texygen platform (Zhu et al., 2018) and train them in this framework3. The models were trained on the similar dataset ex-isting in their released code but collected from the original sites reported in corresponding reference papers.
In order to have a fair comparison, all settings of the models (e.g., same hidden) were kept the same as the Texygen framework. Since setting a fixed number of epochs for terminating training of different methods does not seem such reason-able and resulting in unfair scores, we targeted multiple training termination criteria. In the real-world datasets training, the training termination of the GANs were based on obtaining the best BLEU4 on validation data in addition to setting a max number of iterations for all the models. Be-sides, the training termination of MLE is based the NLL on the validation data while also setting a max number of iterations as above. In the oracle training mode, the termination were done based on both Oracle-NLL on the validation set and again on a max number of iterations for all models.
4.2.2 Metrics
Among the existing measures, BLEU2 upto BLEU5 (evaluating only quality), Self-BLUE2 upto Self-BLEU5 (evaluating only diversity), and NLL that shows the negative log likelihood of the model on test data are utilized for real datasets. Moreover, due to the low performance of the Python NLTK (Bird et al., 2009) BLEU library4 when needing to evaluate multiple sentences with a fixed reference set, we have re-implemented it to achieve parallel computation and high perfor-mance5.
Among the proposed measures, MS-Jaccard2 upto MS-Jaccard5 and FBD are assayed on real-world datasets. For synthetic oracle, NLL and Oracle-NLL as the existing measures and the pro-posed measure for comparing distributions, i.e. Bhattacharyya, are evaluated. It should be noted that, in order to make the metric’s directions the same (i.e. their lower values show better performance), the 1−MS-Jaccard, 1−BLEU and −1×Entropy is used in some plots.
3
https://github.com/geek-ai/Texygen
4
https://www.nltk.org/ modules/nltk/
Table 1: Performance of models (using different measures) onCOCO Captionsdataset. MSJ, BL, and SBL denote MS-Jaccard, BLEU, and Self-BLEU respectively.
Method NLL FBD MSJ2 MSJ3 MSJ4 MSJ5 BL2 BL3 BL4 BL5 SBL2 SBL3 SBL4 SBL5 Real Data - 0.460 0.760 0.585 0.430 0.306 0.926 0.794 0.622 0.454 0.864 0.685 0.489 0.329
MLE 38.416 1.971 0.655 0.473 0.322 0.210 0.891 0.715 0.507 0.334 0.849 0.644 0.425 0.268
SeqGAN 55.610 4.590 0.301 0.229 0.164 0.111 0.904 0.771 0.578 0.380 0.941 0.842 0.700 0.545
MaliGAN 39.916 1.474 0.671 0.495 0.345 0.231 0.901 0.736 0.536 0.361 0.859 0.662 0.451 0.288
RankGAN 48.816 3.574 0.440 0.323 0.224 0.147 0.927 0.782 0.569 0.376 0.913 0.774 0.583 0.402
Table 2: Performance of models (using different measures) onEMNLP2017 WMT Newsdataset. MSJ, BL, and
SBL denote MS-Jaccard, BLEU, and Self-BLEU respectively.
Method NLL FBD MSJ2 MSJ3 MSJ4 MSJ5 BL2 BL3 BL4 BL5 SBL2 SBL3 SBL4 SBL5 Real Data - 0.905 0.691 0.432 0.243 0.129 0.886 0.644 0.380 0.198 0.797 0.512 0.261 0.133
MLE 143.246 4.827 0.585 0.334 0.164 0.071 0.837 0.542 0.264 0.125 0.777 0.452 0.196 0.095
SeqGAN 195.867 5.955 0.231 0.138 0.071 0.031 0.476 0.358 0.200 0.105 0.906 0.729 0.507 0.324
MaliGAN 163.931 5.690 0.405 0.249 0.132 0.061 0.856 0.595 0.314 0.141 0.847 0.591 0.328 0.155
RankGAN 177.346 5.104 0.261 0.156 0.081 0.036 0.461 0.326 0.183 0.097 0.841 0.605 0.371 0.224 .
Table 3: Performance of models (using different measures) onIMDB Movie Reviewsdataset. MSJ, BL, and SBL
denote MS-Jaccard, BLEU, and Self-BLEU respectively.
Method NLL FBD MSJ2 MSJ3 MSJ4 MSJ5 BL2 BL3 BL4 BL5 SBL2 SBL3 SBL4 SBL5 Real Data - 0.683 0.696 0.469 0.296 0.181 0.889 0.691 0.468 0.286 0.853 0.629 0.405 0.241
MLE 125.223 3.538 0.601 0.375 0.214 0.115 0.860 0.620 0.368 0.198 0.844 0.593 0.342 0.179
SeqGAN 150.213 4.587 0.377 0.247 0.147 0.082 0.903 0.695 0.434 0.226 0.924 0.763 0.552 0.345
MaliGAN 141.558 4.482 0.446 0.294 0.178 0.103 0.878 0.662 0.424 0.233 0.889 0.695 0.480 0.290
RankGAN 151.828 3.958 0.354 0.227 0.132 0.070 0.900 0.693 0.432 0.228 0.909 0.739 0.527 0.331
Table 4: Performance of models (using different mea-sures) onOracledataset.
Method NLL Oracle-NLL Bhattacharyya MLE 141.948 167.014 7.105
SeqGAN 155.353 163.179 10.076
MaliGAN 146.260 168.054 8.503
RankGAN 160.424 166.774 12.127
4.3 Results
Results of different methods on COCO Captions, EMNLP2017 WMT News, and IMDB datasets as real-world datasets are shown in Tables1, 2, and 3, respectively. To provide a target, we have also shown metrics for training data themselves and called the method as Real (indeed training data is considered as the generated data by Real and the measures are computed on them). These tables show that MLE has the best performance accord-ing to the proposed measures consideraccord-ing both quality and diversity of samples. In fact, GAN-based methods can not generally achieve good performance according to the proposed measures. This result is consistent with the reported results in (Caccia et al., 2018) that compares GANs and MLE for text generation.
Table 4 shows results of different methods on synthetic oracle dataset and MLE again shows the best results according to the proposed metric (that approximates the distance of the real distribution and the generative model distribution).
As mentioned in Section 3.1.3 about ( Cac-cia et al., 2018), the whole spectrum of quality-diversity is considered for evaluation of Natu-ral Language Generation (NLG) methods. In fact, in (Caccia et al., 2018), the temperature sweep is utilized to robustly evaluate text gen-eration methods. More precisely, the generators conditional distributionG(xt|x1:t−1)is defined as Sof tmax(ot/T) where ot denotes the logit at timet. DecreasingT below1.0will decrease the entropy of conditional probability and thus reduce the probability of generating low quality samples. On the other hand, increasing this temperature above 1.0 will upraise the entropy of the condi-tional distribution and thus improve the diversity of the generated samples (Caccia et al.,2018).
0.0 0.2 0.4 0.6 0.8 1.0 1 - BLEU4
0.0 0.2 0.4 0.6 0.8 1.0
Self-BLEU4
Model MLE MaliGAN RankGAN Real SegGAN
(a)COCO Captionsdataset
0.2 0.4 0.6 0.8 1.0 1 - BLEU4
0.0 0.2 0.4 0.6 0.8 1.0
Self-BLEU4
Model MLE MaliGAN RankGAN Real SegGAN
(b)EMNLP2017 WMT Newsdataset
0.2 0.4 0.6 0.8 1.0 1 - BLEU4
0.0 0.2 0.4 0.6 0.8 1.0
Self-BLEU4
Model MLE MaliGAN RankGAN Real SegGAN
[image:7.595.125.288.66.225.2](c)IMDBdataset (d)Oracledataset
Figure 1: Diversity vs. quality measure of various models with temperatures from 1.5−3 to1.54 on different
datasets. Each point in the plot corresponds to the performance of a model in a special temperature (A second-degree polynomial has been fitted to the points). Lower values in both axes show better ones.
COCO EMNLP2017 IMDB
Dataset
0 25 50 75 100 125 150 175 200
NLL
(a) NLL
COCO EMNLP2017 IMDB
Dataset
0.0 0.2 0.4 0.6 0.8
1 - MS-Jaccard4
(b) MS-Jaccard4
COCO EMNLP2017 IMDB
Dataset
0 1 2 3 4 5 6
FBD
Model MLE MaliGAN RankGAN Real SegGAN
[image:7.595.120.479.70.445.2](c) FBD
Figure 2: NLL,1−MS-Jaccard4, and FBD scores of all the models without applying temperature (i.e.T = 1) on
different datasets. Lower values show better performance.
usually predict the behavior of the model in whole spectrum without needing to provide this quality-diversity space.
Fig. 1 shows the diversity against quality
[image:7.595.85.525.509.658.2]MLE
MaliGANRankGANSegGAN
Model 5
6 7 8 9 10 11 12 13
Bhattacharyya
MLE
MaliGANRankGANSegGAN
Model 130
135 140 145 150 155 160 165
NLL
MLE
MaliGANRankGANSegGAN
Model 160
162 164 166 168 170
[image:8.595.73.298.66.232.2]Oracle-NLL
Figure 3: The performance of all models (without
ap-plying temperature, i.e. T = 1) on the Oracle dataset
using different measures. Lower values show better performance.
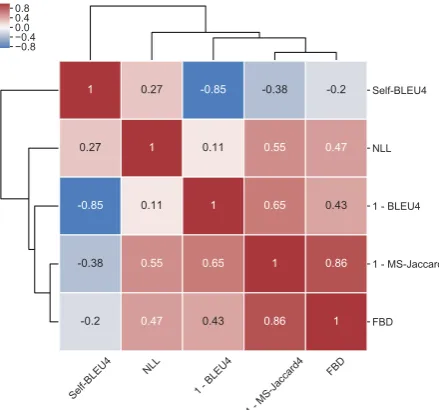
Figure 4: Pearson correlation of all metrics when ag-gregating results on the real world text datasets and all temperatures.
and IMDB datasets. The metrics are also evalu-ated on the train data itself which is called Real in the mentioned figures. Moreover, for Oracle dataset, since we have the probabilistic distribu-tion of data, we can compute the likelihood of the generated samples by the model in the real distri-bution (i.e. Oracle) to find the quality of the gener-ated samples. Therefore, the Oracle-NLL is used as quality measure of the methods on the synthetic dataset in Fig. 1dand Entropy is used as a diver-sity measure in this figure.
On the other hand, Figs.2and3present the per-formance of different methods (with T = 1) on non-synthetic and synthetic datasets respectively.
It is worth noting that NLL, Entropy, and Bhat-tacharyya of Real could not be computed, since we do not have a model for real data and just consider-ing trainconsider-ing data as its samples. Accordconsider-ing to Fig. 2b, the ordering of the methods obtained by MS-Jaccard4 on these datasets is almost always con-sistent with the ordering of the methods according to their dominance in Figs. 1a to1c. For exam-ple, in Fig. 1bthat shows results on EMNLP2017 dataset, the best method which dominates others is MLE, the second best is MaliGAN, the third one is RankGAN, and SeqGAN is the last one that under-performs all other methods. Consistently, the proposed MS-Jaccard4 measure shown in Fig. 2bprovides the same ordering. Moreover, the or-dering of the methods according to FBD metric in Fig.2con different datasets is almost always con-sistent with their ordering obtained by analyzing the whole spectrum in Figs.1ato1c. For the ora-cle dataset3, the proposed Bhattacharyya distance of the distributions introduced in Section3.2.3is consistent with the ordering obtained in Fig.1d.
Finally, we display the Pearson correlation of different metrics on real datasets in Fig. 4. Ac-cording to this figure, the proposed metrics for real-world datasets, i.e. 1−MS-Jaccard and FBD, are highly correlated. Besides, among the mea-sures, these are the most correlated ones to NLL.
5 Conclusion
[image:8.595.73.293.299.504.2]References
Samy Bengio, Oriol Vinyals, Navdeep Jaitly, and
Noam Shazeer. 2015. Scheduled sampling for
se-quence prediction with recurrent neural networks.
InAdvances in Neural Information Processing
Sys-tems 28: Annual Conference on Neural Information Processing Systems 2015, December 7-12, 2015, Montreal, Quebec, Canada, pages 1171–1179.
Steven Bird, Ewan Klein, and Edward Loper.
2009. Natural Language Processing with Python.
O’Reilly.
Ondrej Bojar, Rajen Chatterjee, Christian Federmann, Yvette Graham, Barry Haddow, Shujian Huang, Matthias Huck, Philipp Koehn, Qun Liu, Varvara Logacheva, Christof Monz, Matteo Negri, Matt Post, Raphael Rubino, Lucia Specia, and Marco
Turchi. 2017. Findings of the 2017 conference
on machine translation (WMT17). InProceedings of the Second Conference on Machine Translation, WMT 2017, Copenhagen, Denmark, September 7-8, 2017, pages 169–214. Association for Computa-tional Linguistics.
Massimo Caccia, Lucas Caccia, William Fedus, Hugo Larochelle, Joelle Pineau, and Laurent Charlin.
2018. Language gans falling short. CoRR,
abs/1811.02549.
Tong Che, Yanran Li, Ruixiang Zhang, R. Devon Hjelm, Wenjie Li, Yangqiu Song, and Yoshua
Bengio. 2017. Maximum-likelihood augmented
discrete generative adversarial networks. CoRR, abs/1702.07983.
Jacob Devlin, Ming-Wei Chang, Kenton Lee, and
Kristina Toutanova. 2018. Bert: Pre-training of deep
bidirectional transformers for language
understand-ing. arXiv preprint arXiv:1810.04805.
Ian J. Goodfellow. 2017. NIPS 2016 tutorial:
Genera-tive adversarial networks.CoRR, abs/1701.00160.
Ian J. Goodfellow, Jean Pouget-Abadie, Mehdi Mirza,
Bing Xu, David Warde-Farley, Sherjil Ozair,
Aaron C. Courville, and Yoshua Bengio. 2014.
Gen-erative adversarial networks.CoRR, abs/1406.2661.
Jiaxian Guo, Sidi Lu, Han Cai, Weinan Zhang, Yong
Yu, and Jun Wang. 2018. Long text generation
via adversarial training with leaked information. In Proceedings of the Thirty-Second AAAI Conference on Artificial Intelligence, New Orleans, Louisiana, USA, February 2-7, 2018. AAAI Press.
Martin Heusel, Hubert Ramsauer, Thomas Unterthiner,
Bernhard Nessler, and Sepp Hochreiter. 2017. Gans
trained by a two time-scale update rule converge to a local nash equilibrium. InAdvances in Neural In-formation Processing Systems, pages 6626–6637.
Sepp Hochreiter and J¨urgen Schmidhuber. 1997. Long short-term memory. Neural Computation, 9(8):1735–1780.
Ferenc Huszar. 2015. How (not) to train your
genera-tive model: Scheduled sampling, likelihood, adver-sary? CoRR, abs/1511.05101.
Kevin Lin, Dianqi Li, Xiaodong He, Ming-Ting Sun,
and Zhengyou Zhang. 2017. Adversarial ranking for
language generation. InAdvances in Neural Infor-mation Processing Systems 30: Annual Conference on Neural Information Processing Systems 2017, 4-9 December 2017, Long Beach, CA, USA, pages 3158–3168.
Tsung-Yi Lin, Michael Maire, Serge J. Belongie, James Hays, Pietro Perona, Deva Ramanan, Piotr Doll´ar,
and C. Lawrence Zitnick. 2014. Microsoft COCO:
common objects in context. In Computer Vision -ECCV 2014 - 13th European Conference, Zurich, Switzerland, September 6-12, 2014, Proceedings,
Part V, volume 8693 ofLecture Notes in Computer
Science, pages 740–755. Springer.
Andrew L. Maas, Raymond E. Daly, Peter T. Pham, Dan Huang, Andrew Y. Ng, and Christopher Potts.
2011. Learning word vectors for sentiment
analy-sis. InThe 49th Annual Meeting of the Association for Computational Linguistics: Human Language Technologies, Proceedings of the Conference, 19-24 June, 2011, Portland, Oregon, USA, pages 142–150. The Association for Computer Linguistics.
Luke Metz, Ben Poole, David Pfau, and Jascha
Sohl-Dickstein. 2016. Unrolled generative adversarial
networks.CoRR, abs/1611.02163.
Kishore Papineni, Salim Roukos, Todd Ward, and
Wei-Jing Zhu. 2002. Bleu: a method for automatic
eval-uation of machine translation. InProceedings of the 40th Annual Meeting of the Association for Compu-tational Linguistics, July 6-12, 2002, Philadelphia, PA, USA., pages 311–318. ACL.
Lantao Yu, Weinan Zhang, Jun Wang, and Yong Yu.
2017. Seqgan: Sequence generative adversarial
nets with policy gradient. In Proceedings of the Thirty-First AAAI Conference on Artificial Intelli-gence, February 4-9, 2017, San Francisco, Califor-nia, USA., pages 2852–2858. AAAI Press.
Yizhe Zhang, Zhe Gan, Kai Fan, Zhi Chen, Ricardo Henao, Dinghan Shen, and Lawrence Carin. 2017. Adversarial feature matching for text generation. In Proceedings of the 34th International Conference on Machine Learning, ICML 2017, Sydney, NSW,
Aus-tralia, 6-11 August 2017, volume 70 ofProceedings
of Machine Learning Research, pages 4006–4015. PMLR.
Yaoming Zhu, Sidi Lu, Lei Zheng, Jiaxian Guo, Weinan Zhang, Jun Wang, and Yong Yu. 2018. Texygen: A benchmarking platform for text