Original Article
Application value of shear wave elastography technique
in diagnosis of chronic allograft nephropathy
Jin-Ru Yang, Fei-Qian Wang, Ning Li, Wen-Qian Pan, Hong Ai
Department of Ultrasonics, The First Affiliated Hospital of Medical College, Xi’an Jiaotong University, Xi’an, Shanxi, China
Received September 16, 2015; Accepted March 31, 2016; Epub June 15, 2016; Published June 30, 2016
Abstract: Objective: To investigate the application of shear wave elastography (SWE) in chronic allograft nephropa-thy. Methods: 82 patients with renal transplantation were all treated with conventional ultrasound and shear wave elastography. Group status: normal renal function group after treating with renal transplantation (Scr <134 mol/L, 36 patients), chronic allograft nephropathy (CAN) group after renal transplantation over 6 months (Scr >134 mol/L, 46 patients). Results: 1. The SWE values of renal cortex in CAN group were higher than those in normal renal func-tion group, P<0.05. 2. There was a positive correlafunc-tion between SWE values and Scr, and meanwhile, the difference between them was statistically significant, P<0.05. 3. The ROC curves of each SWE value showed that the sensitivity and specificity of Mean were as high as 92.9%. Conclusion: Shear wave elastography is helpful for the judgment of the hardness of chronic allograft nephropathy, which is expected to provide a new, noninvasive and convenient method for the monitoring of renal function and renal hardness after renal transplantation.
Keywords: Ultrasonography, renal transplantation, shear wave elastography technique
Introduction
Over the past 20 years, although the use of anti-immune therapy in renal transplantation has largely relieved acute rejection, it has not prolonged the survival time of the transplant- ed kidney [1]. Research shows that chronic allograft nephropathy (CAN) is the main cause to long-term graft function [2], and what’s more, after excluding acute rejection and the clear causes that lead to chronic renal function damage such as glomerulonephritis relapse, obstruction or reflux, renal artery stenosis and acute CSA/FK506 poisoning, it often occurred within three months of renal transplantation and with the clinical manifestations of renal dysfunction, with or without high blood pres-sure and proteinuria [3, 4].
The patients often showed progressive deterio-ration of renal function after renal transplanta-tion, and finally returned to dialysis. Along with the with the increase of patients suffering from chronic allograft renal failure, the need for kid-ney transplant patients continues to grow, mak-ing the shortage of donor organs is more promi-nent. Therefore, it is very important to study the
effective treatment of CAN to promote and improve the long-term survival of transplanted organs. Puncture is considered to be the gold standard for evaluation of renal transplant damage. However, it is invasive to renal, and some noninvasive methods have been used for renal transplant damage, such as Doppler ultra-sound [5], and ultraultra-sound contrast [6], MRI [7]. Wave elastography shear (SWE) is used to mea-sure the hardness of the tissue, and the greater the Young’s modulus, the harder the tissue, so it can also be used to evaluate the extent of the lesion. This paper will investigate the elasticity difference between the transplanted kidney and provide a new way for clinical diagnosis of CAN to evaluate the renal function by measur-ing shear wave velocity of transplant renal cor-tex and then quantify elastically compliant region of renal transplant interest.
Materials and methods
Research object
were clinically diagnosed with CAN, including 30 males and 16 females, aged 23-49; and the control group, with 36 patients of renal trans-plantation with normal renal function, including 23 males and 13 females, aged 23-51. Patients were all chosen from the people who had undergone renal transplant in the previous 3 months to 14 years. Inclusion criteria: 1. The clinical manifestations showed that CAN occurred in the number of months or years after renal transplantation, and the main per-formance of the transplantation of renal func-tion has had a slow progressive decline, which is usually accompanied by high blood pressure, proteinuria and so on, ultimately ending in renal failure. 2. Exclusion of chronic renal damage caused by a clear cause of disease: CAN needs to be identified with the following significant renal dysfunction such as acute rejection, renal glomerular nephritis recurrence, obstruction/ reflux, renal vascular stenosis, acute CsA poi-soning and so on. Exclusion criteria: 1. Patients with renal function indexes such as serum cre-atinine were examined as having acute or unstable performance in the first 3 months; 2. Patients with renal transplantation time less than 3 months, and those who have urinary tract obstruction, renal hematoma, surgical area infection and so on; 3. Patients with seri-ous heart and lung disease, which may be influ-enced by renal external factors such as renal artery stenosis, renal artery stenosis, renal artery and (or) venous thrombosis and so on. All patients were examined for blood creatinine within 2 days.
records graft size, cortical thickness, and the blood flow velocity of renal artery with spectral Doppler. Then ask the patient to hold their breath after inhaling, and make a routine ultra-sound examination in the longitudinal section, trying to make the beam and kidney capsule as perpendicular as possible. Start SWE to mea-sure Young’s modulus value in the renal cortex in the central transplanted kidney after image stabilization with at least 3 sub-sampled in the same position and averaged as the final result. Statistical analysis
Make statistical analysis with SPSS19.0 statis-tical software, marking all measurement data with _x±s. Test the comparison between the groups with independent sample t, and test the correlation analysis between SWE average and function of the transplanted kidney with Spearman rank. Compare CAN with the control group, establishing the ROC curve. The differ-ence of P<0.05 was considered statistically significant.
Results
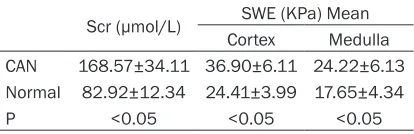
There were no significant differences in the aspects of age, gender, transplantation time, the size of allograft kidney and donor, etc. between the cases of the two groups (P>0.05). The basic situation of the two groups (Table 1). The SWE values of the cortex and medulla of allograft kidney in CAN group were higher than those in the normal group (P<0.05). The com-parison of SWE between CAN group and control group: (Table 2).
[image:2.612.91.359.84.179.2]The correlation analysis between all the values of SWE and Cr:Mean was positively correlated with serum creatinine in SWE values of cortex, r=0.710, P<0.05, and positively correlated with serum creatinine in SWE values of medulla, r=0.591, P<0.05.
Table 1. The basic situation of the two groups
Normal CAN P
36 46
Ages (years) 34.86±10.04 35.35±6.22 >0.05
Sex (male/female) 23/13 30/16 >0.05
Times of allograft (months) 20.08±13.62 31.72±29.08 >0.05 Size of allograft (length) 110.11±7.59 109.89±7.34 >0.05
Donor health health
Table 2. The comparison of SWE between CAN group and control group
Scr (μmol/L) SWE (KPa) Mean
Cortex Medulla
CAN 168.57±34.11 36.90±6.11 24.22±6.13 Normal 82.92±12.34 24.41±3.99 17.65±4.34
P <0.05 <0.05 <0.05
SWE detection method
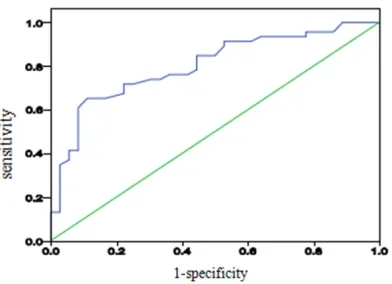
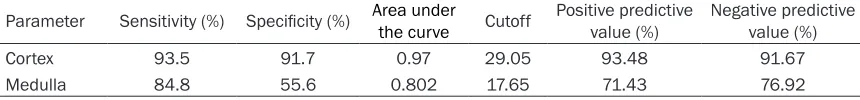
[image:2.612.90.297.225.292.2]ROC curves to Mean value of cortex and medul-la SWE were drew with sensitivity as ordinate and specificity as abscissa respectively, the cut-off value for cortex was 29.05, the sensitiv-ity, specificsensitiv-ity, positive predictive value, nega-tive predicnega-tive value were 93.5%, 91.7%, 93.48%, 91.67% respectively; the cutoff value for medulla was 17.65, the sensitivity, specific-ity, positive predictive value, negative predic-tive value were 84.8%, 55.6%, 71.43% and 76.92% respectively. The ROC curve analysis between SWE values in cortex and medulla: (Figures 1, 2 and Table 3).
Discussion
Shear wave elastography technology is a kind of quantitative analysis technique to obtain the absolute value of tissue elasticity, which is Young’s modulus (the definition for the elastici-ty of objects in physics, with its unit KPa). In shear wave elastography, the shear waves are
automatically emitted by the probe to collect the information of tissue stiffness, which could avoid an operator’s subjective influence on the results as there is no manual pressure during the process; the tissue stiffness information (KPa value) could be directly obtained from the sampling frame, which ensures a quantitative analysis. The harder the texture of the tissue is, the faster the ultrasonic shear waves run within the tissue, and the higher the elasticity KPa value obtained [8-10]. Shear wave elastogra-phy technology is a novel method of imaging for tissue elasticity with the measurement of shear wave velocity generated by the force of acous-tic radiation. Use the “Mach cone” generated by low intensity acoustic pulse after the time division to form into multiple transmitting focal zones. Use ultrafast image acquisition system (5000/sec) that could make transient elastog-raphy to integrate into a sequence of sound. All these make the quantitative ultra-sound elastography method, significantly re- ducing its operator’s dependence by compari-son with static elastography. A focused sound beam emitted by a conventional ultra-sonic probe will generate a remote acoustic radiation force or so-called pushing beam, and each acoustic intensity (ISPTA) of the pushing beam can meet the internationally adopted AIUM EDA 510 (K) standards in the method of time division. The displacement of tissue generates instantaneous shear waves which spread within the medium, and the ultrasonic equipment then changes to speed imaging mode. The raw RF data are quickly obtained, and the axial displacement for the shear wave spreading within the tissue could be calculated by the comparison of continuous ultrasound images with the classic speckle-tracking algo-rithms. The velocity of the local shear wave group could be calculated with a one-dimen-sional cross-correlation algorithm, through which Young’s modulus E could be deduced with the formula E=3ρc2 and two-dimensional tissue elastography produced. ρ is the density of the local tissue (regarded as constant 1000 kg·m-3), and c is the shear wave velocity [11, 12].
[image:3.612.91.287.70.221.2]SWE technology currently has several applica-tions, such as the identification of the stages of liver fibrosis or liver cancer. It also has identifi-cation significance for the benign and malig-nant thyroid in nodules and breast. There are literature reports for measurement ranges for
Figure 1. The ROC curve analysis of SWE values in cortex.
[image:3.612.92.288.273.415.2]normal kidneys and the fibrosis of transplanted kidneys [13-21] as well. Thus, SWE technology can provide clinical real-time quantitative indi-cators, avoiding the interference of subjective factors during the diagnostic process.
Histologically, CAN shows the following differ-ent pathological combinations: ischemic renal disease (glomerular sclerosis, etc.), transplant glomerular diseases (such as thickening or shrinking of the glomerular basement mem-brane, increase of mesangial matrix, etc.), interstitial fibrosis, renal tubular atrophy, ath-erosclerosis, hyaline degeneration of arteriole, fibrous intimal thickening of artery, and delami-nation or fracture of capillary basement mem-brane, etc. The progressive fibrosis of renal transplantation is not only the most common CAN lesion, but also the most common reason and the canal commune of the dysfunction of chronic kidney disease and renal failure. The nature is the extra cellular matrix abnormal accumulate in the glomerulus and renali inter-stitial which leads to the lesion of kidney, the loss of the effective nephron and the progres-sive loss of the kidney function. The renal parenchymal are mainly composed of glomeruli and renal interstitial, so it can make a compara-tively efficient response to the variation of CAN. Normally, the blood supply of kidney cortex is abundant; the elasticity of the vascular loops and the compliance of the tissues are good [22, 23]. Kidney becoming stiff, and the elasticity and compliance decreasing, are because of changes of atrophy in the glomerulus loops, as well as basal lamina thickening, glomerular sclerosis and renal interstitial fibrosis. After the tissues are stimulated by an electromagnetic pulse, the speed of its spread and the value of SWE increased. The glomerulus of the kidney cortex is the main location of the kidney’s path-ological change, so the kidney cortex response to the variation of the elasticity is clearer, and the SWE kidney cortex of CAN is greater than the control group. The research outcome indi-cates that when the Mean in SWE measure-ment of kidney cortex transplantation is more
than 29.05 KPa, it should be diagnosed as CAN, as its sensibility is 93.5%, specificity is 91.7%, and area under curve is 97%. The canal commune of the end stage of renal disease is renal fibrosis, and the main pathologic change is the loss of effective nephron, then replaced by the hyperplasia of plenty fibroblasts and myofibroblasts, and this finally leads to the kid-ney’s elasticity decrease and the stiff increase. The research uses SWE to research CAN. SWE is different from the former elasticity imaging techniques. It has the advantages of having no pressure, real time imagery, orientation survey; measurement results are free from the influ-ence of operator and the repeatability, etc. It also can direct-response the elasticity of tis-sues, so the greater the measured Young’s moduli is, the stiffer of the tissues.
Because of the accumulation of plenty of col-lagenous fiber and fibronectin, the patient has glomerular sclerosis and renal tubule intersti-tial fibrosis which lead to a significant increase of Young’s moduli. Clinically, the percentage of patients with CAN glomerular diseases is more than 95% in chronic kidney disease, and glom-erulus is mainly distributed in the renal cortex; therefore, the hardness of the renal cortex increase is more obvious, and Young’s modulus values are increased more than the renal medulla. In CAN group, with the degree of impairment of renal function aggravation, the Young’s modulus of the renal cortex and renal medulla of CAN patients is gradually increased, and the increase of Young’s modulus of the renal cortex and renal medulla of renal atrophy patients in advanced stage was particularly evi-dent. This shows that with the degree of kidney fibrosis getting more serious, the elasticity of kidneys is also getting worse. This is entirely consistent with the renal histopathological changes in the progression of nephropathy. Renal decompensation is in the inflammation reaction period. The damage of kidneys is light-er, with the nephron reduced 20%-25%; renal insufficiency is decompensated, renal insuffi-ciency failure period, in the form of renal fibro-Table 3. Comparison of diagnostic capability between cortex and medulla
Parameter Sensitivity (%) Specificity (%) Area under the curve Cutoff Positive predictive value (%) Negative predictive value (%)
Cortex 93.5 91.7 0.97 29.05 93.48 91.67
[image:4.612.90.520.87.137.2]sis, this period of pathological damage is more serious than initial stage, as the nephron reduced 50%-90%. In renal insufficiency ure-mia period, kidneys were almost scarred, and more than 90% of nephron function lost. CAN patients have a good correlation between Young’s modulus values of renal cortex and serum creatinine values. Wherein the Mean highest correlation with Scr, r is 0.710, it means that to a certain degree, Young’s modulus val-ues may reflect the degree of renal lesions. The advantages of this technology in kidney transplantation are: firstly, kidney transplants are usually located the side of the patients’ iliac fossa. Compared with normal renal anatomical location, the distance from the location to the surface is smaller, and the influence of breath-ing amplitude is lessened. Intestinal gas and bone acoustic shadows also. Secondly, the renal parenchyma cortex form is more irregular, but due to a smaller sampling frame, when measuring, most tissue in the box does not contain other parts. Thirdly, this test has a deepest depth of 8.0 cm; basically it can reach the deep surface of the transplanted kidney. You can choose to measure each section of the transplanted kidney’s upper pole, the pole or lower pole at will. CAN is usually used to diffuse lesions, as the main site of the lesion is the renal cortex, and it is more convenient. Taking the main lesion detection is more representa-tive, so this study measured the cortical by pole kidney cortex, whether measured or compared, the standard is more consistent, the operating is a real-time measurement, with multiple sam-pling, repeated measurements, less time-con-suming, and has no radiation.
This study use SWE technology detect the elas-tic parameters of the renal cortex of implanted kidney patients intuitively and quantitatively, value the renal cortex hardness change in early stages, and reflect changes in renal function. Combined with conventional ultrasound, it can provide quick clinical, real-time indicators. It provides another strong piece of evidence in early diagnosis and assessment of graft func-tion. This technique is simple, inexpensive, and reproducible, can keep track the measurement without increasing the suffering of the patients, etc., it has a more extensive prospect in clinical application.
The limitations of this study are the small num-ber of cases. Shear wave electrography in renal
transplantation research is still in its infancy, especially in the different pathological condi-tions of transplanted kidney. Shear wave elec-trography measured the value and its correla-tion of microscopic pathology and factors which can influence the Young’s modulus values. All these need to be further studied.
Disclosure of conflict of interest
None.
Address correspondence to: Dr. Jin-Ru Yang, De- partment of Ultrasonics, The First Affiliated Hospital of Medical College, Xi’an Jiaotong University, Xi’an 710061, Shanxi, China. Tel: +86-13891918930; E-mail: [email protected]
References
[1] El Ters M, Grande JP, Keddis MT, Rodrigo E, Chopra B, Dean PG, Stegall MD, Cosio FG. Kidney allograft survival after acute rejection, the value of follow-up biopsies. Am J Transplant 2013; 13: 2334-2341.
[2] Lahmer T, Hermans R, Schmaderer C, Chang J, Stock K, Lutz J, Heemann U, Baumann M. Mineralocorticoid receptor antagonism and al-dosterone synthesis inhibition do not improve glomerulosclerosis and renal interstitial fibro-sis in a model of chronic kidney allograft injury. Kidney Blood Press Res 2012; 35: 561-567. [3] Pascual J, Pérez-Sáez MJ, Mir M, Crespo M.
Chronic renal allograft injury: early detection, accurate diagnosis and management. Trans- plant Rev (Orlando) 2012; 26: 280-290. [4] Solez k, Colvin RB, Racusen LC, Sis B, Halloran
PF, Birk PE, Campbell PM, Cascalho M, Collins AB, Demetris AJ, Drachenberg CB, Gibson IW, Grimm PC, Haas M, Lerut E, Liapis H, Mannon RB, Marcus PB, Mengel M, Mihatsch MJ, Nankivell BJ, Nickeleit V, Papadimitriou JC, Platt JL, Randhawa P, Roberts I, Salinas-Madriga L, Salomon DR, Seron D, Sheaff M, Weening JJ. Banff’05 meeting report: Differ- ential diagnosis of chronic allograft injury and elimination of chronic allograft nephropathy (‘CAN’). Am J Transplant 2007; 7: 518-526. [5] Schwenger V, Hinkel UP, Nahm AM, Morath C,
Zeier M. Color Doppler ultrasonography in the diagnostic evaluation of renal allografts. Nephron Clin Pract 2006; 104: 107-112. [6] Schwenger V, Hinkel UP, Nahm AM, Morath C,
Zeier M. Real-time contrast-enhanced sonog-raphy in renal transplant recipients. Clin Transplant 2006; 20 Suppl 17: 51-54.
transplant: Functional assessment with diffu-sion-tensor MR imaging at 3 T. Radiology 2013; 266: 218-225.
[8] Sarvazyan AP, Rudenko OV, Swanson SD, Fowlkes JB, Emelianov SY. Shear wave elastic-ity imaging: a new ultrasonic technology of medica diagnostics. Ultrasound Med Biol 1998; 24: 1419-1435.
[9] Bercoff J, Tanter M, Fink M. Supersonic shear imaging: a new technique for soft tissue elas-ticity mapping. IEEE Trans Uhrason Ferroelectr Freq Control 2004; 5l: 396-409.
[10] Chamming’s F, Latorre-Ossa H, Le Frère-Belda MA, Fitoussi V, Quibel T, Assayag F, Marangoni E, Autret G, Balvay D, Pidial L, Gennisson JL, Tanter M, Cuenod CA, Clément O, Fournier LS. Shear wave elastography of tumour growth in a human breast cancer model with pathological correlation. Eur Radiol 2013; 23: 2079-2086. [11] Muller M, Gennisson JL, Deffieux T, Tanter M,
Fink M. Quantitative viscoelasticity mapping of human liver using supersonic shear imaging: preliminary in vivo feasibility study. Ultrasound Med Biol 2009; 35: 219-229.
[12] Athanasiou A, Tardivon A, Tanter M, Sigal-Zafrani B, Bercoff J, Deffieux T, Gennisson JL, Fink M, Neuenschwander S. Breast lesions: quantitative elastography with supersonic shear imaging--preliminary results. Radiology 2010; 256: 297-303.
[13] Grenier N, Poulain S, Lepreux S, Gennisson JL, Dallaudière B, Lebras Y, Bavu E, Servais A, Meas-Yedid V, Piccoli M, Bachelet T, Tanter M, Merville P, Couzi L. Quantitative elastography of renal transplants using supersonic shear imaging: A pilot study. Eur Radiol 2012; 22: 2138-2146.
[14] Merino S, Arrazola J, Cárdenas A, Mendoza M, De Miguel P, Fernández C, Ganado T. Utility and interobserve agreement of ultrasound elastography in the detection of malignant thy-roid nodules in clinical care. AJNR Am J Neuroradiol 2011; 32: 2142-2148.
[15] Muller M, Gennisson JL, Deffieux T, Tanter M, Fink M. Quantitative viscoelasticity mapping of human liver using supersonic shear imaging: preliminary in vivo feasibility study. Ultrasound Med Biol 2009; 35: 219-229.
[16] Athanasiou A, Tardivon A, Tanter M, Sigal-Zafrani B, Bercoff J, Deffieux T, Gennisson JL, Fink M, Neuenschwander S. Breast lesions: quantitative elastography with supersonic shear imaging-preliminary results. Radiology 2010; 256: 297-303.
[17] Wang T, Wang XM, Zhang YX. Quantitative Assessment of Real-time Shear Wave Elasto- graphy Imaging in Differentiating Benign and Malignant Thyroid Nodules. Chinese Journal of Medical Imaging 2012; 9: 684-687.
[18] Li JL, Huang Y, Wang ZL, et al. Real-time shear wave elastography in tissue characterization of breast. Chin Med Ultrasound (Electronic Edition) 2011; 8: 812-819.
[19] Zhan J, ChenY, Chai QL, et al. Primary Application of Shear Wave Elastography in Quantitative Differential Diagnosis of Benign and Malignant Thyroid Nodules. Chinese J Ultrasound Med 2012; 28: 274-278.
[20] Zeng J, Wu LL, Zhang RQ, et al. Correlation be-tween elastic modulus measured by superson-ic shear imaging and pathologsuperson-ical stages of hepatic fibrosis in chronic liver disease. Chin Med Ultrasound (Electronic Edition) 2012; 9: 781-784.
[21] Tanter M, Bercoff J, Athanasiou A, Deffieux T, Gennisson JL, Montaldo G, Muller M, Tardivon A, Fink M. Quantitative assessment of breast lesion viscoelasticity: initial clinical results us-ing supersonic shear imagus-ing. Ultrasound Med Biol 2008; 34: 1373-1386.
[22] Solez K, Colvin RB, Racusen LC, Haas M, Sis B, Mengel M, Halloran PF, Baldwin W, Banfi G, Collins AB, Cosio F, David DS, Drachenberg C, Einecke G, Fogo AB, Gibson IW, Glotz D, Iskandar SS, Kraus E, Lerut E, Mannon RB, Mihatsch M, Nankivell BJ, Nickeleit V, Papadi- mitriou JC, Randhawa P, Regele H, Renaudin K, Roberts I, Seron D, Smith RN, Valente M. Banff 07 classification of renal allograft pathology: updates and future recdons. Am J Transplant 2008; 8: 753-60.