Entropy Reduction correlates with temporal lobe activity
Matthew J. Nelson,Stanislas Dehaene∗ and Christophe Pallier† Neurospin research center
CEA Saclay
Gif-sur-Yvette 91191 France
matthew.nelson,
stanislas.dehaene,
christophe.pallier
@cea.fr
John T. Hale
Linguistics Department Cornell University Ithaca, NY 14853 USA
Abstract
Using the Entropy Reduction incremental complexity metric, we relate high gamma power signals from the brains of epilep-tic patients to incremental stages of syn-tactic analysis in English and French. We find that signals recorded intracranially from the anterior Inferior Temporal Sul-cus (aITS) and the posterior Inferior Tem-poral Gyrus (pITG) correlate with word-by-word Entropy Reduction values de-rived from phrase structure grammars for those languages. In the anterior region, this correlation persists even in combi-nation with surprisal co-predictors from PCFG and ngram models. The result confirms the idea that the brain’s tempo-ral lobe houses a parsing function, one whose incremental processing difficulty profile reflects changes in grammatical un-certainty.
1 Introduction
Incremental complexity metrics connect word-by-word processing data to computational proposals about how parsing might work in the minds of real people. Entropy Reduction is such a metric. It relates the comprehension difficulty that people experience at a word to decreases in uncertainty regarding the grammatical alternatives that are in play at any given point in a sentence (for a re-view, see Hale 2016). Entropy Reduction plays a key role in accounts of many classic psycholguistic phenomena (Hale 2003; 2004; 2006) in-cluding the difficulty profile of prenominal rela-tive clauses (Yun et al., 2015). It has connected a wide range of behavioral measures to many
∗,†additional affiliation: Universit´e Paris 11 ∗additional affiliation: Coll`ege de France
different theoretical ideas about incremental pro-cessing, both with controlled stimuli (Linzen and Jaeger, 2016; Wu et al., 2010) and in naturalis-tic texts (Frank, 2013). Entropy Reduction and re-lated metrics of grammatical uncertainty have also proved useful in the analysis of EEG data by help-ing theorists to interpret well-known event-related potentials (beim Graben et al., 2008; beim Graben and Drenhaus, 2012).
This paper applies Entropy Reduction (hence-forth: ER) to another type of tightly time-locked brain data: high gamma power electrical signals recorded from the brains of patients awaiting re-sective surgery for intractable epilepsy. While ex-perimental participants are reading sentences, en-tropy reductions from phrase structure grammars predict changes in this measured neural signal. This occurred at sites within the temporal lobe that have been implicated, in various ways, in language processing (Fedorenko and Thompson-Schill, 2014; Pallier et al., 2011; Dronkers et al., 2004). The result generalizes across both French and English speakers. The absence of similar cor-relations in a control condition with word lists sug-gests that the effect is indeed due to sentence-structural processing. A companion paper ex-plores algorithmic models of this processing (Nel-son et al., Under review).
The remainder of this paper is organized into five sections. Section 2 first introduces intracra-nial recording techniques, as they were applied in our study. Section 3 details the language models that we used, including both hierarchi-cal phrase structure grammars and word-level Markov models. Section 4 goes on to explain the statistical methods, including a complemen-tary “sham” analysis of the word-list control con-dition where no sentence structure exists. Sec-tion 5 reports the results of these analyses (e.g. Table 2 on page 8). Section 6 concludes.
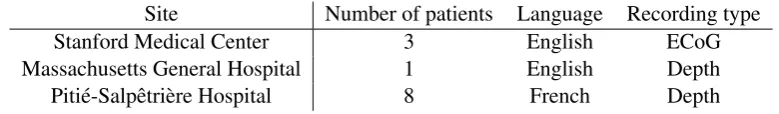
Site Number of patients Language Recording type Stanford Medical Center 3 English ECoG Massachusetts General Hospital 1 English Depth Piti´e-Salpˆetri`ere Hospital 8 French Depth
Table 1: Recording site information.
2 Methods: Intracranial recording
2.1 Overview
In intracranial recording, neurological patients volunteer to perform a task while electrodes, im-planted in their brains for clinical reasons, con-tinuously monitor neural activity. It offers the most direct measure possible of neural activity in humans, and as such is attractive to researchers from across many disciplines (Fedorenko et al., 2016; Martin et al., 2016; Rutishauser et al., 2006). Recordings can be made either from the cortical surface (referred to here as ECoG, short for electrocorticogram) or from beneath the corti-cal surface (referred to here as depth recordings). For both types, what is recorded is a spatial av-erage of extracellular potentials generated by neu-rons in the vicinity of the recording site. This is the same signal as the EEG signal, which has a millisecond temporal resolution, but with a spa-tial resolution far improved beyond that of EEG. Despite these benefits, there are also limitations to the technique. The recordings are only made in certain hospitals under quite specialized con-ditions. The number of subjects recorded from are therefore typically smaller than in studies us-ing non-invasive brain-imagus-ing methods. Also, the signals are obtained from patients with brain pathologies, primarily epilepsy. Nevertheless, the latter concern can be mitigated by screening out participants who perform poorly on clinical tests of language function, by discarding data from re-gions that are later determined to be pathological, or from trials with epileptic activity (see§2.3.1).
2.2 Patients
Patients from three different hospitals (Table 1) were recorded while awaiting resective surgery as part of their clinical treatment for in-tractable epilepsy. Written informed consent was obtained from all participants. Experiments were approved by the corresponding review boards at each institution.
2.3 Recordings
Intracranial voltages were low-pass filtered with a 200 Hz to 300 Hz cutoff and sampled at ei-ther 1525.88 Hz (SMC) or 512 Hz (MGH and PS). Electrode positions were localized using the method described in Dykstra et al (2011) and Hermes et al (2010) and converted to standard MNI coordinates. Only left hemisphere electrodes were analyzed.
2.3.1 Channel and artifact removal
In intracranial experiments, a portion of channels often show either flat or extremely noisy recorded signals. In both cases this suggests problems with the recording contact and the channel should in general not be analyzed. As mentioned above, channels recording from tissue that was deter-mined to be pathological should also not be ana-lyzed. Here, raw data for each channel were vi-sually inspected for artifacts, such as large jumps in the data, and for channels with little to no sig-nal variation apparent above the noise levels. 7.9% of channels were removed from further analysis in this manner. 10.5% of channels were clinically determined as showing epileptic activity and were also removed from further analysis.
2.3.2 Referencing
hence-A
Same or Different?
Ten sad students of Bill Gates should oftensleep They should
400 or 600 ms 2200 ms
Dallas George fat shouldofproud reallytwosings two
Present or Absent?
B
Entropy reduction
0 >0 to .58 .58 to.79 .79 to 2.1 >2.1
aITS electrode
h
ig
h
g
a
m
m
a
p
o
w
e
r
(d
B
)
b
time relative to word onset (s) 0
-0.5 0.5 1
0.21 0 0.5
1 *
Sentence condi�on:
Word list condi�on:
Main sentence Delay Probe Response
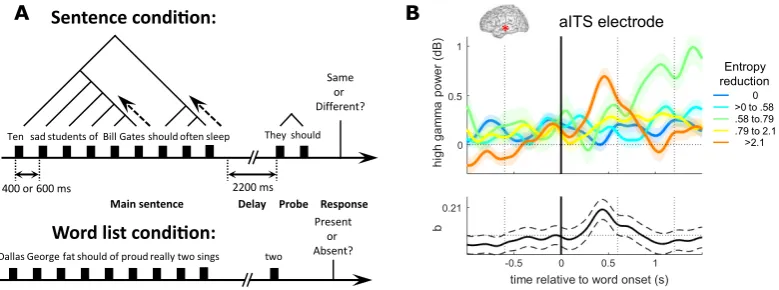
Figure 1: (A) Experimental setup: patients saw sentences or word lists, of variable length, and judged whether a subsequent probe matches or does not match. (B) High-gamma power profile at various levels of Entropy Reduction for the word at time0. The lower part of panel (B) shows the fitted regression co-efficient for Entropy Reduction and its 95% confidence interval across time.
forth refer to these bipolar pairs as electrodes for simplicity. All results presented in this study were essentially unchanged when using an average ref-erence montage.
2.4 Tasks
There were two tasks presented in separate blocks: one in which the stimuli were simple sentences in the participant’s native language, and an-other where the stimuli were randomly-ordered word lists. Figure 1A schematically depicts this arrangement.
In the main sentence task blocks, patients were presented with a sentence of variable length (up to 10 words), followed after a delay of 2.2 sec-onds by a shorter probe sentence (2-5 words). On 75% of trials, this probe was related to the pre-vious sentence by processes of substitution and ellipsis. For example, a stimulus sentence like “Bill Gates slept in Paris” was followed by probes such as “he did” or “he slept there.” On the re-maining 25% of trials the probe shared this form, but was unrelated in meaning to the stimulus e.g. “they should.” The participants were instructed to press one key if the probe had theSAMEmeaning
and another key if the meaning of the probe was
DIFFERENT. This matching task is meant to
en-gage participants’ memory for the entire sentence, rather than just one part.
In the word-list task block, patients were pre-sented with the same words used in the preced-ing sentence task block, but in random order. To avoid any attempt at sentence reconstruction, words were shuffled both within and across
sen-tences. Then following the same delay as in the sentence task, the patients were presented with a one word probe, and asked to identify whether or not that word was in the preceding list. This con-trol task has the same perceptual and motor de-mands as the main task but with no sequential ex-pectations or sentence-structural interpretation of the stimuli. Sentence and word list tasks were presented in alternating blocks of 80 trials, with 2 to 3 sentence-task blocks and 1 word list block recorded for each patient.
In both sentence and word list conditions, words were presented one at a time at a fixed location on a screen to discourage eye movements. The temporal rate was adapted to individual patients’ natural pace, either 400ms (4 patients) or 600ms (8 patients) per word.
3 Materials: language models
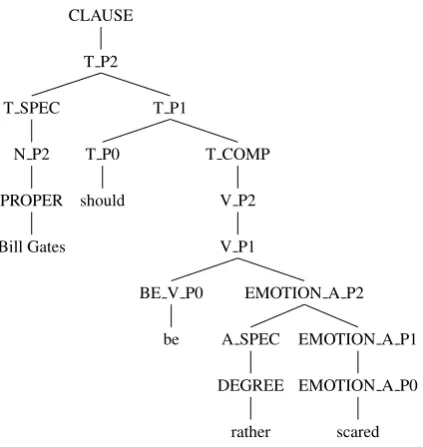
We consider two types of language models. The first type comprises linguistically-motivated prob-abilistic context-free phrase structure grammars (PCFG) based on X-bar theory (Sportiche et al., 2013; Jackendoff, 1977). Figure 2 shows an En-glish example. The hierarchical analyses assigned by this first type of model contrast with those of a second type: word bigram models fitted to Google Ngrams (Michel et al., 2011). Within each type, there are specific English and French ver-sions.
[image:3.595.105.495.65.210.2]dis-CLAUSE
T P2
T P1
T COMP
V P2
V P1
EMOTION A P2
EMOTION A P1
EMOTION A P0
scared A SPEC
DEGREE
rather BE V P0
be T P0
should T SPEC
N P2
PROPER
[image:4.595.76.288.61.285.2]Bill Gates
Figure 2: Example analysis from X-bar grammar. P{0,1,2}annotations indicate bar level, i.e V P2 means verb phrase, and should is analyzed as a projection of tense (T).
tributions. It decides, for instance, on the number of adjuncts present in a particular phrase, the sta-tus of each verb as infinitival, transitive or copu-lar, and on nominal properties such as case, per-son and number. Applying relative frequency es-timation to a sample of these trees, we inferred a PCFG that matches the distributions present in the experimental stimuli. For more on this estimation procedure, see Chi (1999).
These language models serve to predict com-prehension difficulty via three different incremen-tal complexity metrics, described below.
3.1 Entropy Reduction
Entropy Reduction (ER) is a complexity metric that tracks uncertainty regarding the proper anal-ysis of sentences. If a word comes in that de-creases grammatical uncertainty, then the metric predicts effort in proportion to the degree to which uncertainty was reduced. Hale (2016) reviews this metric, its motivation and broader implica-tions. Here we characterize precisely the partic-ular ERs that figure in our modeling by reference to a generic sentencewconsisting of two concate-nated substrings, u and v. Let w = uv be gen-erated by a PCFGG so that w ∈ L(G) and de-note by Du the set of derivations that derive the
k-word initial substring u0···k as a prefix. This
initial substring corresponds to the words that the
comprehender has already heard, and may be of any length. The existence of at least one grammat-ical completion,v, restates the requirement thatu
be a viable prefix. SinceGis a probabilistic gram-mar, each memberd∈Duhas a probability. If the
Shannon entropyH(Du)of this set is reduced in
the transition from one initial substring to the next, then information-processing work has been done and neural effort is predicted. We compute the predictions of this metric, in both languages, us-ing the freely-available Cornell Conditional Prob-ability Calculator, or CCPC for short (Chen et al., 2014). This program calculates a probability for each derivation d ∈ Du, conditioned on the
prefix string u. It uses exhaustive chart parsing to compute the total probability of Du following
Nederhof and Satta (2008). In order to focus on sentence-structural aspects of comprehension, we follow previous work such as Demberg and Keller (2008) and Yun et al. (2015) in computing this metric at the pre-terminal, rather than word, level.
3.2 Surprisal
The surprisal of a word, in the sense of Hale (2001), links measurable comprehension difficulty to the (negative log) total probability eliminated in the transition from u0···k tou0···k+1. We used
the CCPC to compute surprisals at the preterminal level from PCFG models. Surprisals from word-bigram models were obtained simply by negative log-transforming the conditional probability of a successor word given the previous word.
3.3 Bigram entropy
This metric is entropic like ER, but ignores struc-ture and deals only with the conditional probabil-ity distribution of the next word. We determined this entropy using the counts of all of the bigrams in the Google N-grams database starting with one of the words in our stimuli. This amounted to over 9.2 million unique bigrams in English and 3.3 mil-lion in French. In the analysis to follow, these word-bigram models serve as a comparison to the grammatical predictors rather than any sort of pos-itive proposal about human sentence comprehen-sion.
4 Analysis
4.1 Broadband high gamma power
neuro-physiological field as reflecting the average acti-vation and firing rates of the local neuronal pop-ulation around a recording site (Ray and Maun-sell, 2011; Miller et al., 2009). We calculated the HGP using wavelet analyses implemented in the FieldTrip toolbox (Oostenveld et al., 2011). We used a wavelet width of 5 and calculated the spectral power over the frequency window span-ning from 70 to 150 Hz sampled in the time do-main at 1/4 of the raw sampling rate. The result-ing power at each time point was then transformed to a decibel scale relative to the entire experiment mean power for each channel for subsequent anal-yses. The shading of traces in Figure1B reflects the standard errors of the mean across trials.
4.2 Regression analyses
At the single-electrode level, we performed lin-ear regression analyses with each word as the basic unit of observation. The dependent vari-able was the HGP, averaged over a window from 200 to 500 ms following each word. It is in this time window, more or less, that linguistic ef-fects have been found in behavioral, EEG and MEG data (Pylkk¨anen et al., 2014; Bemis and Pylkk¨anen, 2013; Sahin et al., 2009; Friederici, 2002).
We considered the word-by-word Entropy Re-duction (ER), as the covariate of interest. To this, we added two other covariates of no interest. One differentiates closed class and open class words, while another summarizes baseline neural activ-ity. We used for the baseline value the average HGP in a 1-second interval before the onset of the first word of a particular stimulus main sentence. This approach, in which the baseline is included as a covariate, improves over the classical subtrac-tion approach because it only accounts for the vari-ance in the dependent variable in common with the baseline term. However for display purposes, Fig-ure 1B depicts the classical subtraction of signal-minus-baseline.
The models shown in Table 3 include an ad-ditional covariate of interest: bigram entropy, bi-gram surprisal and phrase structure surprisal, as introduced above in section 3. The four regression models were thus:
(I) HGP∼1 +ER+Word Class+Baseline
(II) HGP∼1 +ER+bigram entropy
+Word Class+Baseline
(III) HGP∼1 +ER+bigram surprisal
+Word Class+Baseline
(IV) HGP∼1 +ER+PCFG surprisal
+Word Class+Baseline
We observed the same patterns of results described in this paper when including all of the parameters in one larger model.
4.3 Word list sham analyses
If uncertainty about grammatical structures is in-deed driving ER effects when the stimulus is a sentence, then these effects should be stronger than corresponding effects for the same words pre-sented in a random, non-sentential order. To test this, we assigned sham ER values to the word list condition that matched the value in the sen-tence condition in one of two ways. In Method 1 (word identity matching), each word in the word-list condition was matched to the same word when it occurred in the list condition (possibly at a dif-ferent position). In Method 2 (word ordinal po-sition matching), each trial in the word-list con-dition was matched to a trial of the same length in the sentence-task condition. The ER values of the sentence-task trial were then assigned to the word-list trial, matched by ordinal position. We then compared the effect of the real ER values in the sentence task versus the sham values assigned to the word-list task by computing the interaction of that variable across tasks for each sham assign-ment method. These analyses control for the pos-sibility that either ordinal word position or indi-vidual word identity underlie the effects observed in the sentence-task condition.
4.4 Statistical tests
across electrodes and participants using two different testing procedures. To make inferences about particular brain areas rather than analyzing the entire heterogeneous sample at once, we pur-sued this approach in a regions of interest (ROIs) based analysis. Both procedures use as inputs the z-scores of coefficients from the above multiple regression analysis for each electrode located within a given ROI. We derived the z-scores from the p-values of the t-statistics of the coefficients, which account for the degrees of freedom of each test.
The first test tests for significance across elec-trodes ignoring participant identification using Stouffers z-score method (Zaykin, 2011). This method tests the significance of the z-score sum across electrodes with an assumption of dence between electrodes. Though its indepen-dence assumption is likely violated in these data, the test provides a useful benchmark. This test is complemented by the second test that does not make this assumption.
The second test tests for significance across par-ticipants (i.e. treating parpar-ticipants as a random fac-tor) using a randomization/simulation procedure that proceeded as follows. For each participant, we observed the highest (and lowest) z-score for all electrodes in the ROI, and calculated the av-erage of these scores across participants that had any electrodes in the ROI. We then simulated inde-pendent random z-scores sampled from a standard normal distribution for every electrode in the ROI, with each simulated electrode assigned to a subject to give the same distribution of the number of elec-trodes per each subject in the ROI found in the real data. With each iteration of the simulation we cal-culated the mean of the highest simulated z-scores across subjects in the same manner as with the real data, repeating this 100,000 times to obtain a simulated null-distribution of the across-subject mean best z-score expected by chance. The mean highest (and absolute value of the lowest) z-scores across subjects in the actual data were then com-pared to this null distribution to ascertain the prob-ability of recording such a value of equal or greater extremity in the sample by chance.
By testing whether the effect is consistently observed across multiple participants, this sec-ond test avoids concerns about dependence be-tween electrodes. This test benefits from the sen-sitivity afforded by testing for the best electrode in
each subject, especially appropriate in an intracra-nial recording scenario with a relatively small number of electrodes that are not necessarily po-sitioned at the ideal location for a given effect in each subject. The first test complements this by showing significance over the entire pool of elec-trodes, not relying on subjects’ best electrodes.
Note that an alternate approach for the first test would be to count the number of electrodes in each region with a positive effect significant at the 0.05 level, and use a binomial test to assess the proba-bility of observing at least that many significant electrodes by chance given the total number of electrodes in that region. We prefer Stouffer’s z-score method because it does not rely on an ar-bitrary 0.05 threshold to determine the overall p-value, and because it takes into account the total contribution of every z-score in the sample. We thus chose to report the Stouffers z-score test re-sults only, though we note that the proportions of significant electrodes here support the same pat-terns of significance.
4.5 Regions of interest (ROI) definition
an--3.3 0.0 3.3
z-score pITG
23 electrodes 4 subjects aITS
93 electrodes 6 subjects Sentential entropy reduction
regression coefficients
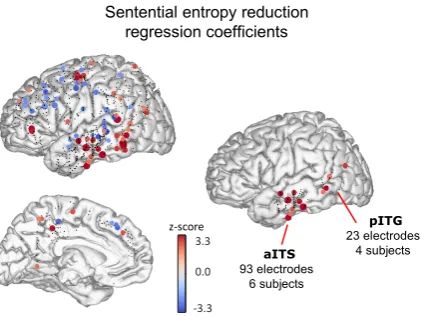
Figure 3: Entropy reduction regression coeffi-cients. Each dot represents an electrode (aggre-gated across subjects), with size and color satu-ration reflecting the corresponding z-score for the coefficient corresponding to ER. Z-scores below an absolute value threshold of 1.96 are plotted with a black dot. Electrodes located>10mm from midline are projected onto the lateral surface plot (top), others are projected onto the midline plot (bottom). (Right) The electrodes included in the aITS and pITG ROIs are shown.
other local maxima with a higher z-score. The two highest-scoring local maxima with an ante-rior/posterior MNI coordinate more posterior than -8 were selected as the ROI centers. These had MNI coordinates: -37,-16,-27 (aITS) and -47,-66,1 (pITG). Figure 3 shows the locations of elec-trodes within each of these regions.
5 Results & Discussion
ER was observed to correlate with an increase in activity as suggested in Figure 1B on page 3, where data from just one electrode are plotted. Figure 3, above, shows the distribution of the ef-fect across the entire sample. Groups of posi-tive coefficients were observed in the aITS and pITG ROIs, which, as Table 2 shows, were sig-nificant across subjects and electrodes. A compar-ison with sham ER values assigned to the word list task showed that the effect in both areas was sig-nificantly higher than word identity matched sham values in the word list task (Table 2, middle). The coefficients in aITS but not pITG were signifi-cantly higher than ordinal position matched sham values in the word list task (Table 2, bottom).
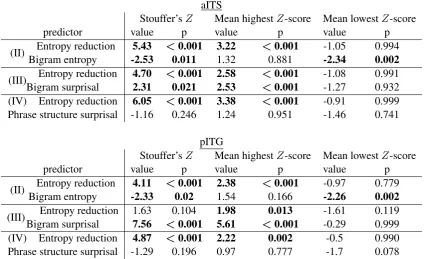
In additional multiple regression models, we in-cluded other entropy- and surprisal- based
predic-tors alongside ER in two-parameter models. Ta-ble 3 shows that there was a significant nega-tive effect of bigram entropy and a posinega-tive ef-fect of bigram surprisal in both aITS and pITG, with no effect of PCFG surprisal in either region. ER is still significant in combination with each of these covariates, except with bigram surprisal in pITG, which was significant across subjects but not across electrodes. Overall, we find that ER is positively correlated with temporal activity af-ter accounting for lexical effects and surprisal in its conventional version.
6 Conclusion
Intracranial recordings from patients reading sen-tences show a correlation with ER in anterior In-ferior Temporal Sulcus (aITS) and posterior Infe-rior Temporal Gyrus (pITG). This occurred even when potential contributions to neural activity from word identity or ordinal position in sentences were accounted for in a control task where there was no syntactic structure. Additionally, aITS and pITG showed a negative response to bigram en-tropy and a positive response to bigram surprisal. However, the ER effect persisted in aITS when combined with these and other potentially com-peting effects. These results converge with other findings based on reading time (Wu et al., 2010; Linzen and Jaeger, 2016) that suggest that down-ward changes in grammatical uncertainty can serve as an approximate quantitative index of hu-man processing effort. We did also observe a positive effect of lexical bigram surprisal, espe-cially in pITG, which has been observed in other work (Nelson et al., Under review), though we fo-cus here on ER.
[image:7.595.80.294.60.218.2]Sentences
Stouffer’sZ Mean highestZ-score Mean lowestZ-score
region value p value p value p
ant. Inferior Temporal Sulcus 6.01 <0.001 3.53 <0.001 -0.99 0.997 post. Inferior Temporal Gyrus 4.69 <0.001 2.42 <0.001 -0.87 0.862
Sentences vs. Word lists- word identity match
ant. Inferior Temporal Sulcus 4.23 <0.001 2.18 0.013 -1.53 0.642 post. Inferior Temporal Gyrus 3.42 <0.001 1.77 0.050 -0.87 0.862
Sentences vs. Word lists- word ordinal position match
[image:8.595.70.513.86.260.2]ant. Inferior Temporal Sulcus 2.80 0.005 2.21 0.009 -1.61 0.497 post. Inferior Temporal Gyrus 1.95 0.051 1.49 0.204 -1.22 0.491
Table 2: Hypothesis tests for fitted regression coefficients on model I for Entropy Reduction predictor by region of interest (ROI). The first two columns report statistics obtained using Stouffer’s Z-score method, pooling electrodes across human participants. Subsequent columns report the highest and lowest z-score values on a per-participant basis, averaged across participants. The p-values for the mean highest and lowest z-scores were determined using simulations, see§ 4.4. The middle and lower tables show the interaction of the regressor across the sentence and word list tasks after assigning sham values to the word list that were matched with the sentence condition values of the same word identity (Middle) and word ordinal position (Bottom). Positive values in these cases indicates a more positive coefficient in the sentence task.
aITS
Stouffer’sZ Mean highestZ-score Mean lowestZ-score predictor value p value p value p (II) Entropy reductionBigram entropy -2.535.43 <0.0110.001 3.221.32 <0.8810.001 -1.05-2.34 0.9940.002
(III) Entropy reductionBigram surprisal 4.702.31 <0.0210.001 2.582.53 <<0.0010.001 -1.08-1.27 0.9910.932 (IV) Entropy reduction 6.05 <0.001 3.38 <0.001 -0.91 0.999 Phrase structure surprisal -1.16 0.246 1.24 0.951 -1.46 0.741
pITG
Stouffer’sZ Mean highestZ-score Mean lowestZ-score predictor value p value p value p (II) Entropy reductionBigram entropy -2.334.11 <0.020.001 2.381.54 <0.1660.001 -0.97-2.26 0.7790.002
(III)Bigram surprisalEntropy reduction 1.637.56 <0.1040.001 5.611.98 <0.0130.001 -1.61-0.29 0.1190.999 (IV) Entropy reduction 4.87 <0.001 2.22 0.002 -0.5 0.990 Phrase structure surprisal -1.29 0.196 0.97 0.777 -1.7 0.078
[image:8.595.71.496.436.695.2]Acknowledgments
This research was supported by an ERC grant “NeuroSyntax” to S.D., the Agence Nationale de la Recherche (ANR, France, Contract # 140301), the Fondation Roger de Spoelberch, and the Fondation Bettencourt Schueller. We thank Peter beim Graben for helpful com-ments on the manuscript. We would also like to thank Josef Parvizi, Lionel Naccache and Sydney Cash for their collaboration. We thank Profs. Michel Baulac and Vincent Navarro, and Drs. Claude Adam, Katia Lehongre and Stephane Cl´emenceau for their help with SEEG recordings in Paris. For assistance in data collection we acknowledge Imen el Karoui, Kristof Giber, Vinitha Rangarajan, Sandra Gattas, Xiaofang Yang, the medical staff at Stanford Medical Center, Massachusetts General Hospital and the Piti´e-Salpˆetri`ere Hospital, as well as our 12 patients for their participation. We thank Laurent Cohen for input during the project’s conception, and Hilda Koopman for assistance in designing the stimuli.
References
Douglas K. Bemis and Liina Pylkk¨anen. 2013. Flex-ible Composition: MEG Evidence for the Deploy-ment of Basic Combinatorial Linguistic Mecha-nisms in Response to Task Demands. PLoS ONE, 8(9), September.
Jonathan R. Brennan and Liina Pylkk¨anen. 2016. Meg evidence for incremental sentence composition in the anterior temporal lobe. Cognitive Science, page Online Version of Record published before inclusion in an issue.
Jonathan Brennan, Yuval Nir, Uri Hasson, Rafael Malach, David J. Heeger, and Liina Pylkk¨anen. 2012. Syntactic structure building in the anterior temporal lobe during natural story listening. Brain
and Language, 120(2):163 – 173.
Zhong Chen, Jiwon Yun, Tim Hunter, and John Hale. 2014. Modeling sentence processing difficulty with a conditional probability calculator. InProceedings
of the 36th Annual Cognitive Science Conference,
pages 1856–1857.
Zhiyi Chi. 1999. Statistical properties of probabilistic context-free grammars. Computational Linguistics,
Volume25, number l, March 1999, 25(1):131–160.
Vera Demberg and Frank Keller. 2008. Data from eye-tracking corpora as evidence for theories of syntactic processing complexity. Cognition, 109(2):193–210.
Nina F. Dronkers, David P. Wilkins, Robert D. Van Valin, Brenda B. Redfern, and Jeri J. Jaeger. 2004. Lesion analysis of the brain areas involved in language comprehension: Towards a new functional anatomy of language. Cognition, 92(1-2):145–177.
Andrew R. Dykstra, Alexander M. Chan, Brian T. Quinn, Rodrigo Zepeda, Corey J. Keller, Justine Cormier, Joseph R. Madsen, Emad N. Eskandar, and Sydney S. Cash. 2011. Individualized localization and cortical surface-based registration of intracranial electrodes. NeuroImage.
Evelina Fedorenko and Sharon L. Thompson-Schill. 2014. Reworking the language network. Trends in
cognitive sciences, 18(3):120–126.
Evelina Fedorenko, Terri L. Scott, Peter Brunner, William G. Coon, Brianna Pritchett, Gerwin Schalk, and Nancy Kanwisher. 2016. Neural correlate of the construction of sentence meaning. Proceedings of
the National Academy of Sciences, 113(41):E6256–
E6262.
Stefan L. Frank. 2013. Uncertainty reduction as a mea-sure of cognitive load in sentence comprehension.
Topics in Cognitive Science, 5(3):475–494.
Angela D. Friederici. 2002. Towards a neural basis of auditory sentence processing. Trends in Cognitive
Sciences, 6(2):78–84, February.
Andrew Gelman and Jennifer Hill. 2007. Data Anal-ysis Using Regression and Multilevel/Hierarchical
Models. Cambridge University Press.
Google-Books-ID: c9xLKzZWoZ4C.
Peter beim Graben and Heiner Drenhaus. 2012. Com-putationelle neurolinguistik. Zeitschrift f¨ur
german-istische Linguistik, 40(1):97–125. In German.
Peter beim Graben, Sabrina Gerth, and Shravan Va-sishth. 2008. Towards dynamical system models of language-related brain potentials. Cognitive
Neu-rodynamics, 2(3):229 – 255.
John Hale. 2001. A probabilistic Earley parser as a psycholinguistic model. InProceedings of the Sec-ond Meeting of the North American Chapter of the
Association for Computational Linguistics.
John Hale. 2003. The information conveyed by words in sentences. Journal of Psycholinguistic Research, 32(2):101–123, March.
John Hale. 2004. The information-processing dif-ficulty of incremental parsing. In Frank Keller, Stephen Clark, Matthew Crocker, and Mark Steed-man, editors,Proceedings of the ACL Workshop on Incremental Parsing: bringing engineering and
cog-nition together, pages 58–65.
John Hale. 2016. Information-theoretical complexity metrics. Language and Linguistics Compass, pages 1–16.
Dora Hermes, Kai J. Miller, Herke Jan Noordmans, Mariska J. Vansteensel, and Nick F. Ramsey. 2010. Automated electrocorticographic electrode localiza-tion on individually rendered brain surfaces.
Jour-nal of neuroscience methods, 185(2):293–298.
Ray Jackendoff. 1977. X Syntax: A Study of Phrase¯
Structure. MIT Press, Cambridge, Mass.
Tal Linzen and T. Florian Jaeger. 2016. Uncertainty and expectation in sentence processing: Evidence from subcategorization distributions. Cognitive Sci-ence, 40(6):1382–1411.
Stephanie Martin, Jos´e del R. Mill´an, Robert T. Knight, and Brian N. Pasley. 2016. The use of intracranial recordings to decode human language: Challenges and opportunities. Brain and Language, page Cor-rected Proof Available online 1 July 2016.
Bernard M. Mazoyer, Nathalie Tzourio, Victor Frak, Andre Syrota, Nina Murayama, Olivier Levrier, Georges Salamon, Stanislas Dehaene, Laurent Co-hen, and Jacques Mehler. 1993. The cortical rep-resentation of speech. Journal of Cognitive
Neuro-science, 5(4):467–479.
Jean-Baptiste Michel, Yuan Kui Shen, Aviva Presser Aiden, Adrian Veres, Matthew K. Gray, The Google Books Team, Joseph P. Pickett, Dale Hoiberg, Dan Clancy, Peter Norvig, Jon Orwant, Steven Pinker, Martin A. Nowak, and Erez Lieber-man Aiden. 2011. Quantitative Analysis of Cul-ture Using Millions of Digitized Books. Science, 331(6014):176–182, January.
Kai J. Miller, Larry B. Sorensen, Jeffrey G. Ojemann, and Marcel Den Nijs. 2009. Power-law scaling in the brain surface electric potential. PLoS
computa-tional biology, 5(12).
Mark-Jan Nederhof and Giorgio Satta. 2008. Com-puting partition functions of PCFGs. Research on
Language and Computation, 6(2):139–162.
Matthew J. Nelson, Imen El Karoui, Kristof Giber, Xi-aofang Yang, Laurent Cohen, Hilda Koopman, Li-onel Naccache, John T. Hale, Christophe Pallier, and Stanislas Dehaene. Under review. Neurophysio-logical dynamics of phrase structure building during sentence processing.
Robert Oostenveld, Pascal Fries, Eric Maris, and Jan-Mathijs Schoffelen. 2011. FieldTrip: open source software for advanced analysis of MEG, EEG, and invasive electrophysiological data. Computational
intelligence and neuroscience, 2011.
Christophe Pallier, Anne-Dominique Devauchelle, and Stanislas Dehaene. 2011. Cortical representation of the constituent structure of sentences. Proceedings
of the National Academy of Sciences, 108(6):2522–
2527, 02.
Liina Pylkk¨anen, Douglas K. Bemis, and Estibaliz Blanco Elorrieta. 2014. Building phrases in lan-guage production: An MEG study of simple compo-sition. Cognition, 133(2):371–384, November. Supratim Ray and John H. R. Maunsell. 2011.
Dif-ferent Origins of Gamma Rhythm and High-Gamma Activity in Macaque Visual Cortex. PLOS Biol, 9(4):e1000610.
Ueli Rutishauser, Adam N. Mamelak, and Erin M. Schuman. 2006. Single-trial learning of novel stimuli by individual neurons of the hu-man hippocampus-amygdala complex. Neuron, 49(6):805–813.
Ned T. Sahin, Steven Pinker, Sydney S. Cash, Don-ald Schomer, and Eric Halgren. 2009. Sequen-tial Processing of Lexical, Grammatical, and Phono-logical Information Within Broca’s Area. Science, 326(5951):445–449, October.
Dominique Sportiche, Hilda Koopman, and Edward Stabler. 2013. An Introduction to Syntactic
Anal-ysis and Theory. Wiley-Blackwell.
Laurie A. Stowe, Cees A. J. Broere, Anne M. J. Paans, Albertus A. Wijers, Gijsbertus Mulder, Wim Vaal-burg, and Frans Zwarts. 1998. Localizing compo-nents of a complex task: Sentence processing and working memory. Neuroreport, 9(13):2995–2999. Marten van Schijndel and William Schuler. 2015.
Hi-erarchic syntax improves reading time prediction.
InProceedings of NAACL 2015, Denver, Colorado,
USA, June. Association for Computational Linguis-tics.
Marten van Schijndel, Brian Murphy, and William Schuler. 2015. Evidence of syntactic working mem-ory usage in MEG data. InProceedings of CMCL 2015, Denver, Colorado, USA, June. Association for Computational Linguistics.
Stephen Wu, Asaf Bachrach, Carlos Cardenas, and William Schuler. 2010. Complexity metrics in an incremental right-corner parser. InProceedings of the 48th Annual Meeting of the Association for
Com-putational Linguistics, pages 1189–1198, Uppsala,
Sweden, July. Association for Computational Lin-guistics.
Jiwon Yun, Zhong Chen, Tim Hunter, John Whitman, and John Hale. 2015. Uncertainty in processing rel-ative clauses across East Asian languages. Journal
of East Asian Linguistics, 24(2):113–148.