THE DEVELOPMENT AND COMMISSIONING OF AN
8-CHANNEL ASTRONOMICAL PHOTOMETER
Christopher A. Pollard
A Thesis Submitted for the Degree of PhD
at the
University of St Andrews
1988
Full metadata for this item is available in
Research@StAndrews:FullText
at:
http://research-repository.st-andrews.ac.uk/
Please use this identifier to cite or link to this item:
http://hdl.handle.net/10023/3717
The Development and Commissioning
of an 8-Channel Astronomical Photometer.
by
C. A. Pollard
A dissertation submitted for the degree of Doctor of Philosophy
at the University of St. Andrews.
CERTIFICATE
I certify that Christopher Pollard has spent nine terms
in research work at the University Observatory, St. Andrews,
that he has fulfilled the conditions of Ordinance General No. 12
and Senate Regulations under resolution of the University Court,
1967, No.1, and that he qualified to submit the accompanying
DECLARATION
Except where reference is made to the work of others the
research described in this thesis and the composition of the
thesis are my own work. No part of this thesis has previously
been submitted in application for a higher degree. I was
admitted to the Faculty of Science of the University of St. Andrews
as a research student under Ordinance General No. 12 on the
1st October, 1984. I was accepted as a candidate for the degree
of Ph.D. on the 1st October, 1985, under Resolution of the
University Court, 1967, No.1.
..
.
In submitting this thesis to the University of St.
Andrews
I
understand that I am giving permission for it to be made available
for use in accordance with the regulations of the University Library
for the time being in force, subject to any copyright vested in the
~ork
not being affected thereby. I also understand that the title
and abstract will be published, and that a copy of the work may be
made and supplied to any bona fide library or research worker.
AKNOWLEDGEMENTS
I am indebted to my supervisor Dr.R.P. Edwin for his sustained
interest and guidance throughout this project. I should like to thank
Dr.R.W. Hilditch for his advice and assistance in preparing an
astronomical programme.
It is a pleasure to acknowledge the help and encouragement of many
members, past and present, of the Observatory. In particular the
( then) workshop staff, Bill, George and Jimmie, for their
willingness to help at all times. Also to Mr.Carr for his valuable
discussions and practical help with the electronics. Not forgetting
my fellow students Andy, Steve, Tam, Rab, Mark, Quentin, Ian, Keith,
Eddie Jam Jar, Simon, Don, Helen, Paul and Kevin. Thanks especially
to Graham, for getting me back on the right tracks on numerous
occasions. For Clive, with whom I visited parts of the Old Course
most golfers don't know exist To the Guinness family, who helped
keep me sane, if not solvent, and to Louise for her help with tiping
the daigrms.
I would like to extend my thanks to Professors D.W.N. Stibbs and
W.
Sibbet for making available the facilities at the UniversityObservatory. I acknowledge the partial funding of this work by the
Science and Engineering Council.
Looking back, into what now seems the very distant past, I would
like to record here the debt lowe to the people who started me off
down what has turned out to be a long and yet very rewarding path.
Were it not for the encouragement and confidence given to me by Prof.
Ian Robson and Drs Ian Butchart and Doug Whittet, none of this would
have come about.
The debt lowe to my parents could not be adequately described
here, nor could it ever be fully repaid. This work will always remind
~
~
~
~
~
~
~l
(S
C:3
~
ABSTRACT
The development and commissioning of an 8-channel astronomical
photometer is described. The design is based on a low dispersion
grating spectrograph in which the spectrum produced is focussed onto a
mosaic of mirrors which redirect the radiation in the spectral bands
into the appropriate detector channels. Filters are used to further
define the spectral passbands. The detectors used are
photomultipliers, whose response features have been matched to the
individual channels. The instrument is under the control of a
dedicated microprocessor with a further microprocessor used for data
acquisition.
The photometer has been employed in an observing programme on the
O.9m James Gregory telescope at St.Andrews. Observations of standard
uvby stars have allowed transformations equations to be derived for
the Stromgren system. The eclipsing binary SV Cam has been observed
Table of Contents
Chapter 1 HISTORY OF PHOTOI~TERS
1.1 Introduction
1.2 Early Observations
1.3 Introduction of the Photo~raphic Plate
1.4 First use of Physical Detectors
1.5 Introduction of the Photomultiplier Tube
1.6 Development of Pulse Counting Techniques
1.7 Improvement of Photometric Detection Systems
1.8 Establishment of Photometric systems
1.9 Advantageous of Simultaneous Observations
1.10 Chopping Photometers 1 .11 Dual .S·eam Photometers 1.12 Multi-Channel Photometers
1.13 The St.Andrews-DAO 8-Channel Photometer
Chapter 2 OPTICAL AND MECHANICAL LAYOUT
2.1 Introduction 2.2 Optical Details
2.2.1 James Gregory Telescope
2.2.2 Optical Coupling 2.2.3 Acquisition Mirror 2.2.4 Acquisition Eyepiece 2.2.5 Aperture Slide
2.2.6 Neutral Density Filter 2.2.7 Post-Acquisition Eyepiece 2.2.8 Collimator
2.2.9 Grating
2.2.10 Camera Mirror 2.2.11 Mirror Mosaic
2.2.12 Photomultiplier Filters 2.2.13 Window Heaters
2.2.14 Fabry Lenses
2.2.15 Photomultiplier Tubes 2.3 Mechanical Details
2.3.1 Mechanical Overview 2.3.2 Calibration Source Unit 2.3.3 Acquisition Mirror 2.3.4 Offset Guider Counters 2.3.5 Aperture Slide
2.3.6 Aperchopper Assembly
2.3.7 Neutral DenSity Filter Wheel 2.3.8 Post-Aperture Viewer
2.3.9 Gratin~ Rotator
2.3.10 Photomultiplier Filter Units
Chapter 3 SYSTEM HARDWARE
3.1 Introduction
3.2 Control Electronics 3.2.1 Acquisition Mirror 3.2.2 Calibration Source 3.2.3 Filter Shutter 3.2.4 Grating Rotator
3.2.5 Photomultiplier Filters 3.3 Pulse Counting Electronics 3.3.1 The Aperchopper
\
3.3.2 Integration Timer 3.3.3 Pulse Counters
3.4 Associated Electronics 3.4.1 Power Supplies
3.4.2 Connectors
3.4.2.1 Backplane Modifications
Chapter
4
SYSTEM SOFTWARE4.1 Philosophy Behind the System 4.2 Processing Capabilities
Page 2
4.3 Description of the Software Environment
4.4
Development Work with the System4.5 Description of the Control Software
4.6 Description of the Data Acquisition Software 4.7 Communication Between the Two Systems
4.8 File Transfer Protocol
Chapter 5 COl1MISSIONING THE PHOTOMTETER
5.1 Introduction
5.2.1 Calibration Unit
5.2.2 Neutral Density Filter Wheel 5.2.3 Aperchopper
5.2.4 Grating Rotator
5.2.5 Photomultiplier Filter Units 5.2.6 Phtomultiplier Operating Voltage 5.2.7 Setting Grating Angle
5.3.1 Optical Assembly
5.3.2 Balancing the Telescope 5.3.3 "0" Rings
5.3.4 Flexure Testing 5.3.5 Testing the Counters
5.3.6 Focussing on the Apertures 5.3.7 Aperture Slide Selection 5.3.8 Fabry lenses
5.3.9 Dark Counts
5.3.10 Dead-Time Calculations
5.3.11 Neutrality of Neutral Density Filters 5.3.12 Sensitivity Variations Over the Aperture
Chapter 6 ASTRONOMICAL PHOTOMETRY
6.1 Introduction
6.1.1 The Stromgren Four-Colour System 6.1.2 Photoelectric Reduction Procedure 6.1.3 Magnitude and Colour Transformations 6.1.4 Difficulties in Establishing Accurate
Extinction Coefficients 6.1.5 The Observations
6.1.6 Reduction Procedure
6.1.7 The Derived Transformation Equations 6.2 Photometric Observations of SV Camelopardis 6.2.1 Introduction
6.2.2 The Observations
6.2.3 Time of Minima and Rev ised Orbi tal Period 6.2.4 Results of Observations
Appendix A
CONTROL SOFTWARE
Appendix B
DATA ACQUISITION SOFTWARE
Appendix C
SIGNAL-TO-NOISE RATIO
Appendix R
REFERENCES
CHAPTER 1
A HISTORY OF PHOTOMETERS
1.1 INTRODUCTION
1.2 EARLY OBSERVATIONS
The history of photometry is as old as the history of astronomy
itself. In the earliest of star catalogues, estimates of the
brightness of the stars were established as an aid to identification.
A quantitative numerical scale was established by Hipparchus almost
2000 years ago. The first critical estimates of the apparent
brightness of stars were made by Ptolemy in his Almagest.
later revised and refined by al-Sufi.
This was
In 1609, with the introduction of the telescope as an astronomical
tool, Galileo extended Ptolemy's system of magnitudes.
Sir William Herschel devised a method of estimating stellar
brightness by forming short sequences of stars and arranging them
according to their apparent brightness. The degree of difference
between successive members was indicated by symbols.
Argelander made use of this same method for estimating the light
changes of variable stars but used "grades" instead of symbols. In
1843 he published his "Uranometrica Nova" which contained positions
and apparent magnitudes for all objects visible to the unaided eye
A HISTORY OF PHOTOMETERS
from Bonn.
But throughout most of this time no standard scale of brightness
existed. Whilst each observer generally based his work on that of the
other observers, each defined his own scale or system of brightness.
Furthermore, photometry was still seen as an aid to stellar
identification rather then as being of merit in itself.
The first photometric instrument was introduced in 1725 when
P.Bouger made measurements of the brightness of the Sun and Moon using
a simple illumination photometer with a candle as a standard source.
In 1740, A.Celsius and A.Tulenius, using an extinction photometer,
made the first measurements of stellar magnitudes.
In 1836 Sir John Herschel invented his astrometer with which he
determined the light ratios of a number of Southern stars. The
brightness of a star was measured by comparing its brightness with a
minified image of the moon. At the same time in Munich, C.A.Steinhill
was using a more advanced method. His prism-photometer consisted of
a small telescope with a divided objective. The two halves could be
moved independently along the optical axis of the telescope. This
motion allowed the intensities of two images, one from each half of
the objective which were diffused into small discs by defocusing, to
be varied. The relative brightness of the stars could be calculated
from the relative positions of the two half-objectives when the images
were seen to be of equal intensity.
By now, using the eye to check for equality or inequality, the
typical error in estimating a stars magnitude was reduced from 0.2mag.
to 0.06mag., ( Weaver, 1946a ).
A HISTORY OF PHOTOMETERS
That there was a functional relationship between the visually
estimated magnitudes and the physical intensities of the stars was
only established slowly. Newton had assumed that a 2nd magnitude star
was twice as far away as a 1st magnitude star and a 3rd, 3 times as
far away. This would imply that the apparent brightness was inversely
proportional to the square of the magnitudes, which is a good
approximation. This belief was still held a century later by Herschel
not until 1837 that C.A.Steinhill introduced the
and it was
logarithmic relation which was to be adopted by nearly all later
workers.
1.3 INTRODUCTION OF THE PHOTOGRAPHIC PLATE
The next major advance came in the use of the photographic plate.
Just a few years after the photographic process had become available,
Fizeau and Foucault were able to compare the brightness of the Sun to
that of a carbon arc using the photographic principle.
In 1850 the first photographic stellar image ( of Vega was made
by J.A.Whipple at the Harvard College Observatory, but such was the
low sensitivity of the plates that no image of Polaris was possible,
regardless of the length of exposure and the use of the medium
stopped.
By 1857 the sensitivity of the plates had increased suffiCiently to
make possible photography of sixth and seventh magnitude stars using
the 15-inch telescope at Harvard and so photographic photometry
acquired new favour.
A HISTORY OF PHOTOMETERS
In 1881 using the new gelatin silver bromide emulsion, A.A. Common
was the first to photograph stars too faint to be seen with the naked
eye.
It should be noted though, that the photographic plate is not
actually an improved detector over the eye. It still retains all the
failures of the eye, ie. variable sensitivity, non-linearity,
wavelength dependence along with a complicated time-dependence
( reCiprocity failure). The eye was still the final detector in much
of the early photographic photometry. The main advantage of
photography is the ability to integrate and store light. Longer
exposures are able to average out the effects of scintillation and the
observer can make his measurements in a more comfortable environment.
1.4 FIRST USE OF PHYSICAL DETECTORS
During the period 1911-1916, H.T.Stetson designed an instrument
which eliminated the use of the eye and relied on purely physical
methods for the determination of stellar magnitudes from photographic
stellar images (Stetson, 1914; 1916). The energy absorbed from a
beam of light by the silver grains in the stellar image on the plate
was measured and interpreted in terms of stellar magnitude. J.Schilt
at Groningen was to construct a very similar device to that of Stetson
just a few years later ( Schilt, 1922). This form of instrument is
essentially similar to those which are still used today, ie. the
microdensitometer.
The use of physical instruments in photometry could be said to
precede the use of the photographic plate. In 1800 Sir William
Herschel ( 1800 ) used a thermometer which he placed in a solar
spectrum and demonstrated that heating could be observed beyond the
A HISTORY OF PHOTOMETERS
visible portion.
Shortly after the discovery of the thermoelectric effect in 1825 by
Seeback, instruments employing thermoelements were made by d'Asonval
( 1886) and Boys ( 1889 ), though without much success. Huggins
( 1868 ) used a similar device some years later to successfully obtain
measurements of Sirius, Pollux, Regulus and Arcturus. However the
instruments required long exposure times and were impractical for
routine use.
The first practical observations were made in 1913 by Pfund
( 1913) employing a vacuum thermocouple. Measurements were made of
Jupiter and Vega with integration times of a few seconds, rather than
minutes. This work was extended by Coblentz ( 1914 ) who, using the
36-inch Crossley at the Lick Observatory measured some 120 celestial
objects, some down to 6.7th magnitude.
Concurrent with these developments was the introduction of the
photocell. The principle of the photocell had been discovered in 1839
by E.Bequerel. One of the first successful uses of the photocell was
in 1895 by G.M.Minchin ( 1895 ) who obtained measurable electrical
effects when the cell was irradiated with light from Jupiter and
Saturn.
I~re significant advances came with the use of selenium cells. The
first observations made in the United States were by J.Stebbins and
F.C. Brown ( Stebbins, 1907). In spite of the selenium cell's low
sensitivity, narrow wavelength response and poor availability, in 1910
Stebbins published a light curve of the eclipSing variable Algol
(Stebbins, 1910). In his observations Stebbins used two stars of
constant light, 0( Persei and
l
Persei as comparison objects. Theseobservations probably formed the most accurate set of observations in
A HISTORY OF PHOTOMETERS
existence at the time, with a probable error of only +/- 0.023mag.
near the primary minimum.
The discovery of the photoelectric cell, by Elster and Geitel, in
1911 held the promise of more sensitive measurements. They were also
more linear in their response than the selenium cells. In 1913,
Schulz and Kunz used a photoelectric cell to record light from
Arcturus and Capella ( Schulz, 1913). Similar systems were being
developed by Guthnick in Berlin ( 1913 ) and Rosenberg in Tubingen
( 1913 ).
Prior to 1932 the photocells were used in conjunction with
comparatively inefficient electrometers. Then in 1932 Whitford
perfected the thermionic amplifier which eliminated the necessity for
electrometers ( Whitford, 1932). The amplification was of the order
of 2 million and the current generated could now be measured using a
galvanometer. Although the combination of photocell amplifier and
most convenient way of measuring the
galvanometer was by far the
magnitude of bright stars, there was a major drawback. Unlike the
electrometer, where no amplifier is used, the amplification process
introduces "noise" which, for faint stars, dominates the signal.
There seemed little hope of decreasing the amplifier nOise as it was
already close to its theoretical limit.
1.5 INTRODUCTION OF THE PHOTOMULTIPLIER TUBE
The invention of the photomultiplier tube in the late 1930s offered
the posSibility to push the accuracy limit several magnitudes beyond
that obtainable with either the electrometer or
amplifier/galvanometer. The internal amplification that takes place
within the photomultiplier tube is, essentially, noise free ).
A HISTORY OF PHOTOMETERS
Whitford and Kron in 1937 were the first to use a photomultiplier
tube as auxiliary equipment for guiding on a telescope
Whitford, 1937). These initial experiments indicated that the
devices were inferior to the photocell because of the low efficiency
of the emitting surfaces, and little further interest was shown in
them.
The photomultiplier tube came of age in the early 1940s with the
use of antimony-caesium emission surfaces. RCA produced their first
type 931 just before the Second \yorld War and the 1 P21 during the war.
Kron ( 1946) was one of the first to use the new tubes and in
conjunction with the 36-inch Lick refractor was able to measure down
to 11th magnitude.
Up to this point the final measuring instrument, usually some form
of galvanometer, had been used to measure the output current, after DC
amplification, from the photomultiplier tube. The limits of accuracy
with this technique were now beginning to be reached, especially for
the fainter stars, where the currents produced could be of the order
-15
-18
10 ,10 ampere.
1.6 DEVELOPMENT OF PULSE COUNTING TECHNIQUES
From the earliest days of photoelectric photometry attempts had
been made to count the individual electrons emitted from the
photocathode. Although several early attempts had been successful
( Elster and Geitel, 1916; Steinke, 1926; Rajewsky, 1931 the methods
used were somewhat unreliable and were not adapted for photoelectric
photometry. However, these experiments had been performed using
photocell s.
A HISTORY OF PHOTOMETERS
The introduction of the photomultiplier tube, with its internal
amplification producing a sizeable output pulse at the anode, renewed
attempts to count individual electrons. Kron had speculated on the
use of pulse counting electronics ( Kron , 1946 ) though at this time
had not actually produced anything. In 1947, R.W.Engstrom was able to
make simple measurements by visually counting the output pulses
appearing on a cathode ray oscilloscope ( Engstrom, 1947 ).
The first systems to be successfully used in astronomical
applications were produced independently by Yates ( 1948) in
Cambridge and Blitzstein (1951) at the Flower Observatory
Pennsylvania •
The output pulse from the photomultiplier tube is amplified and fed
into a discriminator. All pulses greater then a selected reference
level cause the discriminator to generate a standard pulse. A gating
circuit then either passes or blocks them, the action being controlled
by a timer, which determines the length of the integration.
Since this period the use of pulse counting electronics has
gradually become standard, particularly after the introduction of the
transistor, which has made low noise amplifiers and fast reliable
counters cheap and easily available. It has been shown by several
authors that photon counting techniques produce better results in the
detection of faint sources than other methods. This is due to the
ability to reject output signals that do not originate from photons
striking the cathode (eg. thermal electrons emitted from lower
stages of the amplification chain), thereby improving the
signal-to-noise ratio. Morton, 1968; Nakamura and Schwarz, 1968;
Tull, 1968). However, for high luminous fluxes,DC methods are to be
preferred due to the non-linearity of the photomultiplier tubes at
A HISTORY OF PHOTOMETERS
high count rates which arises from the dead time associated with the
devices, ( Johnson, 1960 ).
1.7 IMPREOVEMENT OF PHOTOMETRIC DETECTION SYSTEMS
EHT supplies are now far more stable resulting in less drift in the
gain of the tubes, though pulse counting techniques are less sensitive
to these variations than DC techniques. Effective and stable cooling
systems are now available helping to reduce the dark current of the
tubes.
Improvements in the photomultiplier tubes themselves have centred
mainly on the use of higher efficiency materials for the photocathode.
The S20 type was the first to use bi-alkali metals, which extended the
sensitivity range out to 700nm, sufficient to include the H~line.
The S1 photocathode pushed the cutoff response into the infra-red at
1100nm. At the other end of the wavelength range caesium-iodide and
potassium-bromide photocathodes have extended the response to 105 to
200 nm, which is of particular use in space borne observatories.
Another area where improvements have been made is in the timing of
integrations. Unfortunately, in photographic work, for integrations
of longer than one second, the reciprocity law fails making time-scale
photometry very difficult. With photoemissive detectors this problem
is avoided. Studies by Latham ( 1968 ) have shown that effects found
in photoemissive dev ices, producing a similar effect to the
reciprocity failure, such as gain-drift or fatigue, can be reduced to
1 to 2%.
A HISTORY OF PHOTOMETERS
The overall trend then, has been towards the removal of various
systematic
averaging.
effects, with an emphasis on those connected with
1.7.1 Establishment Of Photometric Systems
Along with this development of detectors came a parallel
development of photometric systems. The development of photography
had enabled spectroscopists to begin to study the physical nature of
the stars. But, for the photometrist, the photographic plate does not
readily yield precise mean numbers due to the diffuse mass of silver
grains which form the scattered image.
photomultiplier changed this.
The introduction of the
At first progress was rather uncoordinated with various
observatories and astronomers using different colour filters to define
the bands and also using an assorted number of filters.
It was not until the introduction of the UBV ~stem by Johnson and
Morgan ( 1953) that some order was imposed. They systematically
compared their measurements with the ~K classifications which, with
the discovery by Eggen that stars in associations and clusters have
colours which fall along narrow sequences, made the ~stem a powerful
tool. To this day a great majority of photometriC measurements are
either taken using this system or else transformed to it.
Many other photometric systems "have been developed, some of which
employ very narrow filters to measure individual line strengths,or to
investigate specific properties in selected groups of stars. For
example, the Stromgren uvby system ( 1966 ) was created for the study
of A F and G stars and the DDO system ( McClure and Van den Bergh,
1968) for late type stars. For a more detailed discussion of
A HISTORY OF PHOTOMETERS
photometric systems and their applications see Golay,
1974.
1.9
ADVANTAGES OF SIMULTANEOUS OBSERVATIONSSo far we have just been considering conventional single beam
photometers. Here magnitudes, either through different filters and/or
between object sky and comparison, must be measured sequentially. Now
it has been shown that, for ground based photoelectric photometry, the
limiting factors are photodetection-noise
transparency (Belvedere and Paterio,
non-simultaneous measurement procedure
and variable atmospheric
1976 ).
Therefore, thisrequires either good
atmospheric stability (ie. constant sky transparency and seeing ) or
else frequent alternations of object and sky, which results in a
considerable loss of efficiency. Even with frequent alternations,
errors arise from inconsistent centring of the stellar image in the
photometer aperture and poor tracking.
It has been shown that simultaneous observations at several
wavelengths can largely eliminate errors arising from transparency
fluctuations and also, to an extent, errors due to inconsistent
centring of the stellar image ( see ego Walraven and Walraven,
1960;
Griffin and Redman,
1960;
Oke,1969,).
But if the simultaneous colourobservations are to be independent of sky-transparency fluctuations
the fluctuations must be, to a first order, grey. Also the stars
being measured must be sufficiently bright so that accompanying
changes in sky brightness introduce an insignificant error (Walker,
1969 ).
Using a quasi-simultaneous procedure Serkowski reports achange in colour of only
0.01
magnitude per magnitude of cloudabsorption for the UBV photometric system ( Serkowski,
1970).
Thismeans that otherwise non-photometric nights may be used profitably.
A HISTORY OF PHOTOMETERS
An
additional advantage of simultaneous observations is theincrease in observations over a given period. Simultaneous
measurements also allow the monitoring of colour changes in stars
which exhibit rapid phenomena ego flickering of flares.
Numerous photometers have been developed which exploit the concept
of simultaneous measurements. It would be impractical, and
undesirable, to list here each multi channel/beam instrument which has
been built. Instead, specific photometers will be considered which
exemplify the various design approaches.
The approaches that have been taken can be split into three general
groups which tend to increase in complexity. They are
(i) Chopping Photometers
(ii) Dual beam photometers and
(iii) Multi channel/beam photometers.
It is convenient to consider each group in turn.
1.10 CHOPPING PHOTOMETERS
None of the instruments in this section provide true simultaneous
measurements as all use a single detector. The underlying theme is
the reduction of time between successive
different filters and/or different objects.
measurements through
The simplest consist of a rotating filter wheel, generally under
computer control, that allows rapid changing of filters between
observations.
A HISTORY OF PHOTOMETERS
A typical example of this type of photometer is that described by
Gianni et. ale
shown in Figure 1.1.
( 1975). An optical diagram of the photometer is
The various colours are measured by a single
photomultiplier successively. The six filters used ( UBV from Johnson
( 1955 ) plus-two bands at R ( 600nm ) and I ( 800nm ), differing from
the standard R and I used by Stebbins ( 1956 ) ), are held in a
circular filter-stand disc. The disc is mounted on the shaft of a
stepping motor, whose rotation is controlled by the data acquisition
system. A single counting device is used.
Although fast electronics were used in the counting system,
allowing photoemissions occurring within a time interval of the order
of 20ns to be detected, the integration times used in each channel
were generally of the order of 10 sec.
But Sorvari ( 1975) has pointed out that whilst atmospheric
transparency variations occur at all frequencies, it is most apparent
on a time scale of several tens of seconds. So, changing the filters
on this time scale will not reduce the effect of these variations. It
was with this in mind that Sorvari constructed a photometer
incorporating a rapid change filter wheel.Four filters are mounted in
a filter wheel. Associated with each of the four filters is one
channel in a four-channel scaler, which is used to record the pulses
generated by photons arriving through that particular filter.
A control unit is used to gate the scalers and also control the
position of the filter wheel. It also "enables" the appropriate
scaler. Approximately every 3 seconds counting is inhibited for about
0.25sec whilst a stepper motor advances the filter wheel. This
results in a dead time of about 8%.
®
0,
Fig.i.i
Q)
@
CD
-~~
..
CIT
1 Field mirror
2 Diaphram stand disk 3 Stepping motor I. Filter stand disk 5 Diaphram viewer 6 Firs I field lens 7 Second field lens 8 'Cooling house 9 Photomultiplier 10 Quarz window
Optical diagram of the photometer
A HISTORY OF PHOTOMETERS
After each filter has been in place ten times, the scalers are
read. For fainter stars a series of the standard length integrations
is summed.
That this method is effective in removing the effects of variable
sky transparency in the colour indices was demonstrated by Sorvari, by
comparing both conventional and rapid-filter-change measurements of
the same star on two different nights.
The first night was of good photometric quality. The standard
dev iation, for a set of 8 measurements was cr =0.004 for conventional
photometry and ( j =0.003 for the rapid-fil ter-change photometry. (This
demonstrates that the rapid-filter-changing introduces no new source
of noise ).
The second night was chosen because of its obviously poor quality.
This time the standard deviation for conventional photometry rose to
~=0.043, whilst that for the rapid-filter-change increased to only
~=0.008, a reduction in ~ of approximately a factor of 6.
Other photometers which have been built to exploit this increased
accuracy in colour determination include that of Caplan and Grec (
1975). This was built specifically to measure the line and continuum
intensities in emission nebulae. Again, the technique of repeating
short integrations through many rotations of the filter wheel to
average out the effects of variations in atmosphere transparency is
used.
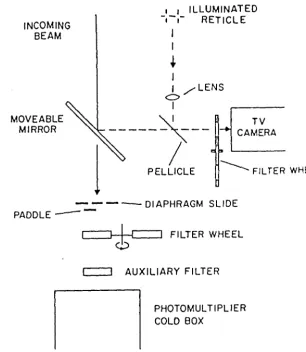
A design by Kinman and Mahaffey ( 1974) incorporates a paddle
device which can be used to cover one of a pair of apertures.
( Figure 1.2 ).The position of the paddle is computer controlled, as
is the filter wheel. This design marks the transition between the
Fig. 1. 2
INCOMING BEAM
MOVEABLE MIRROR
• I ILLUMINATED -.-.- RETICLE
I I
+
I
I /LENS
C>
---~--~~
1
~
PELtcLEt---
FILTER WHEEL- - - - 01 APHRAGM SLIDE
PADDLE--~
FILTER WHEEL~
c::::J
AUXILIARY FILTERPHOTOMULTIPLIER COLD BOX
[image:27.620.131.437.137.489.2]A HISTORY OF PHOTOMETERS
simple repetitive filter-cycle photometer and the chopping photometer.
A chopping photometer is described by Davidson (1976). A
schematic diagram is shown in Figure 1.3. A spring loaded solenoid
moves a stainless steel mirror which is set at a 45°angle with the
optical axis, in a plane parallel to the focal plane. A 0.75mm hole
( giving a circular diaphragm with an angular diameter of 30 arc
seconds) is drilled into the mirror. The mirror is oscillated at
either 1Hz or 5Hz. The light from the object passes alternately
through the filters and onto the photomultiplier tube or else to the
viewing mirror. The diaphragm is stationary in one of the two
positions, sky or star, for approximately half of the time. By using
the mirror the objects position in the diaphragm can be continuously
monitored using the viewing telescope. The filters are located in two
stacked filter wheels, each containing five filters.
Control electronics are used to gate the pulses to the appropriate
counter, depending on the mirrors position and to inhibit counting
whilst the mirror is moving from one position to the next.
Whilst the ~stem allows quasi-simultaneous monitoring of the
object and sky, the different colours are still separated in time with
the possibility that there may be changes in the sky transparency
between measurements made through different filters.
Several photometers have been built which, whilst still single beam
instruments, have attempted to overcome this difficulty.
Burnet and Rufener ( 1979 ) have constructed a photometer which
they claim can measure objects simultaneously, see Figure 1.4. Object
A is situated on the optical axis of the telescope and object B can be
in any direction up to 13' from A ( with a minimum separation of l' ).
Fig.l.3
ALTERNATE M'RROR-- ' I
POSITION
II
"---'
VIEWING TELESCOPE
I I
II
I I
I I
-OPTICAL AXI!)
STAINLESS ~--STEEL
MIRROR
FOCAL PLANE DIAPHRAGM
'0>'
::r
o en rtaO::r
8 (I) (I) 8rto> (l)rt
Ii
1-'-a
0.0> (1)1-' en 1-'-0.
(Q 1-'-~ 0>
(I)(Q
0. Ii 0> 0'8 "<0 tIlHl C lirt ~::r
(I) (I)
rt
0. 0> 1-'-~Hl
o.Hl
(I)
~Ii
C (I)
t-h~ (l)rt ~ 1-'-(1)0>
!il-'
-""'''AI. ",,, ... £ ,c*
'-""OTO"'CTCIf IfOTArION--_ _ _
CODING DISK FOR AZIHVTHAL
POSITION AND DISPLAY
---k.
ceNTERING erePIECE FOR
OOTH OC"". A ANO. ~
.~-.
'.",,...
.'&':"~~~SELECTOR FOR CENTERING A OR S BEAH
e eclCH H'RROR(CAN BE REHOI/CO WHEN
roo CLOSE TO THE A AXIAL HIRRORI
CAHS FOR O.tUENTING THE 8
!CAH SECONDARY""RROR
... h'q ...
""RROn WITH POSITION~ CONTROLLCO or CAH' - - 'I...(':;~~'
-( 'rl " ~
'-/
CHOPPER WHEEL WHICH
REFLECTS 8£AH A AND LETS THE 8 8£ .. 14 PASS THROUGH
- - -
~.
_ _ _ _ _ _ _ _ _ PICKUP 'OTCNTIOHCTCRt::::J
FOR ORIENTING THE RETICLE".
leHROIC HIRROR
Ino HIRROR
JD)"-____________________ AXIAL HIRROR FOR BE"'" A
OiliNG PRI$H {USED FOR CENURINGJ
F',tSRr LENS
VAR'l WINDOw
A HISTORY OF PHOTOMETERS
A 150mm diameter wheel holds seven filters. As each filter is
brought into the optical beam an optical chopper wheel switches
between the two data channels, allowing each to be incident in turn on
the photomultiplier tube.
The period of rotation of the filter wheel, as well as that of the
optical chopper, is variable, allowing different lengths of
integration to be used.
The photometer can be used for differential photometry, comparing a
variable star with a reference star, allowing short term variation to
be followed, or it can be used in a star/sky mode.
Clearly, the two channels are not being sampled Simultaneously, but
this rapid changing between the two objects and through different
filters will help reduce the effects due to changes in sky
transparency.
Visvanathan ( 1972 ) has constructed a similar device, though this
is restricted to the star/sky mode. Here two apertures, of equal
Size, separated by 8mm, have been mounted in an aperture wheel in the
focal plane of the photometer. A small circular plate chopper with
two semicircular slots is mounted eccentrically behind the apertures.
As the chopper rotates, only light from one aperture can reach the
photomultiplier at any time. A magnetic pickup, mounted near the edge
of the chopper produces one positive and one negative pulse for each
rotation of the wheel. The wheel is rotated at 60 cycles per second,
therefore the star and sky are seen alternatively by the
photomultiplier tube sixty times per second.
A HISTORY OF PHOTOMETERS
The photometer can be used either in conjunction with a continuous
circular interference filter or with a filter wheel which holds six
wideband filters.
The continuous variable filter wheel covers a wavelength range from
the ultraviolet to 750nm, with a bandwidth of about 20nm. It is
rotated about the optical axis using a stepping motor, with the whole
of the wavelength range being covered in 20 steps. The movement of
the filter is controlled by the positive
chopper. With the wideband filter wheel
photometry) the filter wheel is rotated in
measurement for both star and sky are
position is moved to.
pulse generated by the
(used for UBVR and H
o
steps of 60. So a
taken before a new filter
Taylor (1980) has used the same general approach in his
repetitive filter cycle photometer built for the Behlen Observatory.
Here the filter wheel is driven directly on the shaft of a stepper
motor with the chopper disc mounted on the same shaft. In this way
the filter changing motion also accomplishes the chopping (Figure
1 .5 ).
The chopping scheme utilizes a double focal-plane diaphragm with
the star in one and the sky in the other. As the chopper wheel and
filter wheel turn, the chopper hole and associated filter line up in
turn behind each of the two diaphragms.
Two light emitting diodes along with two photo-transistors provide
positional information for each of the 16 possible star and sky
positions.
PORTION OF DIAPHRAM SLIDE SHOWING ONE HOLE PAIR
a:
>- .q;
>< ....
(/) (/)
2 STEPPER STEPS APART:
CHOPPER WHEEL
2 STEPS
NEXT FILTER
NOTE' SAME AREA ON FILTER USED FOR STA.R AS FOR SKY.
I
I
/ /
HOLES, ONE FOR EACH FILTER
1
STEPPER MOTOR 200 STEPS/REVOLUTION
2-INFRARED (9400 A) LIGHT EMITTING DIODES
" ' \ OPTICAL ~DETENT
/SYSTEM
OPTICAL DETENT HOLES' ONE STAR AND ONE SKY HOLE FOR EACH FILTER
2- PHOTO TRANSISTORS
2:1 STEPS BETWEEN FILTERS
Fig.l.5 A schematical diagram of the dual-diaphragm
A HISTORY OF PHOTOMETERS
These last three photometers represent just about as far as one
would wish to go, in terms of complexity, to overcome the problem of
variable sky transparency, using just a single photomultiplier tube.
These systems all try to mimic double beam photometers and it is these
that are considered next.
1.11 DUAL-BEAM PHOTOMETERS
Nather and Warner ( 1971 ) constructed a photometer with the aim of
observing rapid blue variables. The rapid light variation in these
objects necessitated that the time scale of the measurements be as low
as 1ms. In order to define the character of the variations in as much
detail as possible, the photometer was normally operated without
filters so that a sufficiently large count rate would be achieved
during the short integrations. This along with the fact that very few
measurements of comparison stars were made, made the system very
susceptible to changes in sky transparency. They suggested the
construction of a photometer with a second channel dedicated to
monitoring a comparison star, so that measurements of the variable
star could be continued uninterrupted.
Warner went on to build a photometer using a second channel
Warner, 1971 and 1972). The main photometer was left unchanged, but
a second miniature photometer was attached to the guiding eyepiece.
The variable star is set in the main photometer's diaphragm and then
the eyepiece of the offset guider is moved until a suitable comparison
star is found. A flip mirror diverts the light into the miniature
photometer, thus enabling the comparison star to be monitored
simultaneously with the variable. Associated with each channel is a
4-position filter wheel, driven by stepping motors, which allow
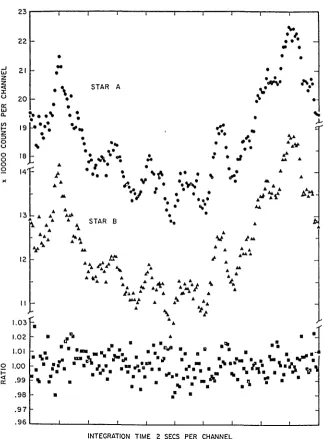
sequential photometry to be performed. Figure 1.6 shows how the
Fig.
1.6
-J W Z Z <t :r u 0: w a. If) .... z ::> o u o o o Q >< 23 22I
•
211-
•
..
20 l-
.,
••
• •
STAR A
"'-.
'-••••
•
•
•
•
•
•
•
·
""'"
\
..
"0"
•
•
•
•
•
•
.'-:.
..
,
19r·:~~
~•
~
J.-18
14f
r...
...
o
o
.
•..
o \ .
.,..,.
...
..
•
•
•
.0.
.'.
•
0 00•
•
• .J• I 0 •
00 • o ' . . . 0 0 ,
• y \" 0
o 0
~
A • 0.",
~o I •
..
~ .. iN' ... ....
..
.....
13[ ......
~'/.
..
0 0 •'.'
..
.....
..
..~
.. t
J..';1. [image:35.597.125.450.117.557.2]..
12"
..
..
..
... .....
......
~ ...'"'"
..
~:-
..
....
STAR 8
U' ..
..
....
~ ~./' '\. 1/..
o •
..0
•
•
..
o...
..
..
-\I' ~ ...
.. ..
i- ..
....
..
...
..
..
..
....
.. *" ...
~....
': ..
j;'..
J~"
....
...
,
-\...
..
~..
..
- I .. ~
..
....
'11
'\
..
..
1.02
11'" : •
·r
.
•• _ rl' •..
•.
¥ . II.'"
• • .~.
. - . . . .
.
.
_....
1.03,.
•
1.01
• ",. . . 1m.J. : - . . . .~. . : - • . . . . . . - .
••• • ·""1·
.. ...
_. -
...
t.. , ...
. ...
... .... a..
.-. . .
.. ,..
-r1' "i2'o 1.00
i=
<t . 99 0:
. 98 .97 .96
• • • • . . . . • • • JI.- Ilk . . . .
....
•
•
.~.'* ••
•
• ••
•
Ilk•
• • •INTEGRATION TIME 2 SECS PER CHANNEL
An example of the use of the two-channel
photometer,
designed by Warner, on
A HISTORY OF PHOTOMETERS
instrument performs under poor observing conditions. Both star A and
star B were non variable stars, observed on a night with drifting
cirro-stratus. In each channel variation of up to magnitude was
recorded within very short time intervals. The normalized ratio of
the output of the two channels is shown in the lower portion of the
diagram. The average magnitude variation is now reduced to about 0.03
magnitudes. So the second channel serves not only as a check on good
nights, but makes observing possible through relatively thin clouds.
A similar photometer based on this design was constructed and used
by Grauer and Bond ( 1981 ). They, like Warner and Nather, made sky
readings, on average, only every twenty minutes. It has already been
stated that Serkowski has shown that absorption by cloud is
essentially neutral. But Warner ( 1971) pointed out that this
assumption breaks down on moonlit, cloudy nights, as clouds are very
much better scatterers than absorbers. Therefore the first presence
of moonlit clouds causes a large increase in the total brightness,
( due to an increased sky brightness ), followed by a diminution as
the thicker clouds begin to absorb the starlight. If rapid
measurements of the sky brightness levels are not taken then the
Signal ratio method will break down. It was suggested by Grauer and
Bond ( 1981 ) that a design which rapidly chops between star and sky
would eliminate this problem. A far better solution would be to
monitor them simultaneously.
Many photometers capable of doing this have been built. Some rely
on optical means, such as beam splitters, to direct the incident light
into the two separate photomultipliers, whilst others use separate
photometer heads mounted on moveable carriages.
A HISTORY OF PHOTOMETERS
In the first category, one of the earliest double beam photometers
was designed by Johnson ( 1958 ). The optical layout is shown in
Figure 1.7. The light from the star and sky passes through identical
holes in the diaphragm disc. The beams are then split by an
aluminised prism and are directed to the two 1P21 photomultiplier
tubes. Johnson claimed that the simultaneous recording of both star
and sky improves the accuracy by 20 to 100%, depending on the amount
of variation in the sky transparency. On this instrument the 3
colours used had to be measured sequentially. Johnson had originally
planned to develop the system into a "sextuple-beam" photometer ie.
six photomultipliers, measuring star and sky simultaneously through
each of the 3 colours ( yellow, blue, and ultraviolet). At the time
he felt that the increased sensitivity that would be gained could not
justify the threefold increase in complexity and expense. (Such a
system was subsequently built by Hiltner, in collaboration with
Johnson, and is described elsewhere in this chapter ).
Another photometer which typifies this design approach was
constructed by Goudis and Meaburn ( 1973). This has 4 different
modes of use derived from two configurations. From the layout shown
in Figure 1.8 come three of the modes;
(i) A small central diaphragm is used with a dichroic beamsplitter
with reflection and transmission of the same efficiency. This allows
simultaneous 2-colour photometry on a single object.
(ii) The beamsplitter used is now a thin sheet of glass, reflecting
8% of the parallel beam onto photomultiplier 2 and the remaining 92%
onto photomultiplier 1. The 8% is passed through a broadband filter
and the 92% through a narrow filter, centred on a nebular emission
line (eg. H~ or [NIl]
BRIGHT STAR
FAINT STAR SKY
Fig.1.7
DIAPHRAGM FILTER
FIELD LENS----'
A schematical diagram of the two-channel
A HISTORY OF PHOTOMETERS
(iii) The beamsplitter from (ii) is replaced by a partially
aluminised one, so that two nebular lines could be detected
simultaneously. The reflection and transmission of the beamsplitter
would be chosen to match the expected brightness ratio of the top
line.
Using the arrangement shown in Figure 1.9, a single star and the
sky brightness immediately adjacent to it, can be monitored
simultaneously, or, two stars within
5'
of each other can be observed.To achieve this the beamsplitter is removed and photomultiplier 2
repositioned. A completely aluminised mirror, with a central hole is
inserted into the focal plane. A diaphragm with both a central hole
and an off-axis hole is placed in the focal plane. Light passing
through the central hole is detected by photomultiplier 2. If colour
photometry is desired then, once again, this must be performed
sequentially.
The second category of double beam devices do not use beam
splitters but measure the two sources simultaneously but completely
independently. Usually one, if not both, of the photometer heads will
be mounted on a movable carriage.
Bernacca ( 1978 ) describes the construction of a two channel
photometer which typifies the design of this classification. The
photometer head consists of a box containing two identical sets of
focal plane diaphragms. Two photometers of identical design are
mounted on a slide carriage attached to the diaphragm box. Each
diaphragm and photometer pair can be moved independently of the other,
allowing two separate sources to be centred in the diaphragms. (For
sources separated by more than 206" two aluminised rectangular,
fuzed-quartz prisms are used to deflect the beam into the diaphragm ).
PHOTOCATHODE 2~n-EXIT PUPIL
4-FOCAL FILTERS
PLANE
1
1
PHOTOCATHODE 1
I
t
f
0""," DIAPHRAM
emax
EXIT PUPILOR IRIS
Fig.l.B
I
BEAMSPLITTERS
Optical layout for mode A of the photometer designed by Goudis and Meaburn.
FILTb',~ PHOTOCA't ; .JOE 2
1"
I I I U====-
,J
1
~
EXIT PUPIL
FOCAL
PlANE \
I
FilTERS PHOTOCATHODE l=
ij'
I
7.
r
'R~
~I~
I
f
I
Fig.l.9
t
TWO-HOLE DIAPHRAM
X EXIT PUPIL
Optical layout for mode B of the photometer
A HISTORY OF PHOTOMETERS
Each channel has a separate filter wheel associated with it and each
channel drives a separate counter.
A similar device has been built by Geyer and Hoffman ( 1974). The
layout is schematically shown in Figure 1.10. Again the two
photometers are mounted on moveable carriages, each capable of moving
independently, in a direction perpendicular to the optical axis of the
telescope. The whole framework is free to rotate around the optical
axis. Each photomultiplier box contains its own interchangeable
focal-plane diaphragm, Fabry lens and filter wheel, which holds up to
4
filters.An almost identical design to this has been built by Piccioni (
1979 ) at the Bologna Observatory. Here, the major difference is that
pulse counting has been used rather than the DC-integrating method
chosen by Geyer and Hoffman.
De Baise ( 1978 ) also reports the construction of a photometer
similar to that of Geyer and Hoffman. A schematic diagram of the
optical parts is shown in Figure 1.11, the other channel being
identical to that shown. They claim an improved efficiency and
preCision over that of Geyer and Hoffman's, largely due the use of
pulse counting techniques and the switching time of the "optical
mul tiplexer" ie. filter wheel.
The photometers described in this section have a distinct advantage
over those described previously. They all have the ability to measure
either object and sky, or object and comparison simultaneously. But
none are able to do so whilst measuring in more than one passband at
the same time. The next section looks at some of the instruments
which have been designed to measure through at least two channels and
several wavelengths simultaneously.
Fig.LIO
Fig.LII
'dentlcal
rl ght
-t
bess
I
s~
1* ,'---_
1/
+"-c--_~::~:.~_® D M L F P
Telescope Flange
n
A schematical drawing of the photometer designed by Geyer and Hoffman.
B: _I .. : A
---I; II
~ ~ •u Z
I : .." : _ . . . ~
I % w ... WoM
Y .. w :l~W 0
/:
I..0
..
g
i ,
w '
Z ~
:'! I
J
I!!! I :! 1: 1M::! % ;:
"
..
I 0 ~ z~~ ;;:I -B--o + - 0 :
:
~t
~ ~;,-lill -W~!I1--- . .-~I,;'-' -'f:~-' 'f~~8El
..
~:
~ ,~ I :
l ~ i
z
..
..
..
I I ~ Z..
C
O'IICAI MU. 1
---"'010"
'"ISJS
~--.
oCONItOt 5
-r=i-
IAlG! flHO~J
lYEr/!CfCONTROL (HPI!C!
A HISTORY OF PHOTOMETERS
1.12 MULTI CHANN~8EAM PHOTOMETERS
Following on from Johnson's photometer (Johnson, 1958), Hiltner
constructed a six-channel photometer. This possibility had been
suggested by Johnson but at the time he was of the opinion that the
filters available were not sufficiently well defined. Nevertheless
the photometer was constructed a year later. A schematic diagram of
the photometer is shown in Figure 1.12.
The first stage is identical to Johnson's in that it splits the
light from the two sources ( star+sky and sky ) using an aluminised
prism. A further
4
dichroic filters, 2 to each channel, are used toseparate the several filter bands. The filter system used is the UBV
system as defined by Johnson and Morgan ( 1951 ). It should be noted
that the dichroic filters do not have exactly the same spectral
pass-band characteristics as the standard UBV filters and so a
transformation to the UBV system is necessary. Johnson's earlier
reservations about the ultraviolet filters seem to be borne out, since
Baum 1959 ) noted difficulties with the system and did not attempt
to use the U channel.
Giovannelli ( 1980 ) has used a similar beamsplitting technique to
construct a
4
channel photometer. The instrument was designedspecifically to observe the optical counterpart of X-ray sources, in
particular, phenomena such as bursts or flickering. Since these occur
on time-scales comparable with those of atmospheric phenomena
(Paerno, 1979) it is advantageous that colour measurements can be
made simultaneously, along with the monitoring of a comparison object.
Otherwise the effects of sky transparency variation, scintillation and
seeing would seriously reduce the reliability of the readings.
A HISTORY OF PHOTOMETERS
The instrument is able to measure the object star in UBV colours
simultaneously and a comparison star in B. A schematic of the layout
is shown in Figure 1.13.
The mirror M, tilted at 450 with respect to the optical axis of the
telescope, has a hole in it which allows the light to reach the
Cassegrain focal plane. The prism, P, can be inserted to allow
centring of the star in one of the diaphragms, DP. When the prism is
removed, the incident beam is split by two partial transmission
mirrors, MP, providing 3 beams which are incident upon the 3
photomultipliers, PM1, PM2 and PM3.
The mirror M also provides an auxiliary focal plane, FC, which
allows viewing through a large field eyepiece, EC. A comparison star
identified in this field can then be centred in a diaphragm, DC, by
moving the whole of the auxiliary photometer head. The comparison
star is then monitored by the fourth photomultiplier tube, PM4. All
of the photomultipliers are used in the photon counting mode.
As a final example of an instrument which utilizes the
beamsplitting
photometer.
technique let us consider Tinbergens 12 channel
The objective in deSigning the photometer was to produce an
instrument that was efficient in its use of available light and also
flexible enough to perform photometery of various spectral features.
With the additional requirements of measurements of the equivalent
widths of stellar absorption lines came the decision to split the
channels into pairs to allow "H~" photometry with each pair.
Fig.l.12
UBV FILTERS
~I I~ to
to
" £
a:
..
Iii
z ~
FILTERS
A schematical diagram of Hiltner's six-channel photometer.
I
I
-=E-
2C·~I
0r
-=~
Fig.l.13
r'M-4
ClIJ
roM!
'UJ
DP
=--H-I r'M.2
Optical diagram of the four-channel
photometer designed by Giovannelli
et al.
A HISTORY OF PHOTOMETERS
A schematic of the layout, reproduced from the users manual, is
shown in Figure 1.14. Light passes through a calibrator ( optional)
and is focussed in a single diaphragm. (A double diaphragm will
eventually be available for sky-chopping). The light then passes
through an optional neutral density filter. The beam then proceeds to
a collimator with an electro-mechanical shutter situated behind it.
Five dichroic beamsplitters are used to produce up to 6 separate beams
(3 between 300 and 600 nm and the other 3 between 450 and 900nm ).
Each of these 6 beams is then subsequently split by a "neutral" beam
splitter to produce "H~" pairs of beams. These final beams then pass
through 3-position filter slides and Fabry lenses before arriving at
the photomultiplier tubes.
Since dichroic beamsplitters are wavelength-dependent polarisers
the incoming light was depolarised to avoid photometric errors
occurring with polarised objects. A time averaging polariser,
consisting of a rotating achromatic halfwave plate was used. This led
to the decision to include an optional polariser, so that linear
polarimetry could be done using half of the light.
Whilst this instrument allows for ( potentially ) two objects to be
monitored simultaneously in up to 12 channels there are, as is
inevitable with such a complex design, certain difficulties.
For example, in deciding that the dynamic range should extend from
very faint to very bright stars, a wide range of neutral density
filters have been included. Unfortunately these filters are not
neutral enough to allow UBV or similar broad-band photometry to be
feasible. Also the high count of optical components leads to a loss
of efficiency.