This is an Accepted Article that has been peer-reviewed and approved for publication in the The Journal of Physiology, but has yet to undergo copy-editing and proof correction. Please cite this article as an 'Accepted Article'; doi: 10.1113/JP275680.
This article is protected by copyright. All rights reserved.
Laura R Rich1 & Angus M Brown1,2
Fibre sub-type specific conduction reveals metabolic function in mouse sciatic nerve
1 School of Life Sciences
University of Nottingham Nottingham, NG7 2UH UK
2 Department of Neurology
School of Medicine
University of Washington, Seattle, WA 98195
USA
This article is protected by copyright. All rights reserved. Email: [email protected]
Phone: 0115 823 0173
Keywords: C fibre, compound action potential, fructose
Running title: Simultaneous recording of sciatic nerve A and C fibre CAPs
I graduated with a 1
stclass degree in Neuroscience from the
University of Nottingham and proceeded to an M.Res., graduating
with a distinction; the data from which is included in this paper. I am
currently in my 1
styear of a Ph.D. at Nottingham and interested in
This article is protected by copyright. All rights reserved. Key Points
We have developed an improved method that enables simultaneous recording of stimulus evoked compound action potentials from large myelinated A fibres and small unmyelinated C fibres in mouse sciatic nerves.
Investigations into the ability of fructose to support conduction in sciatic nerve revealed a novel glia-to-axon metabolic pathway in which fructose is converted in Schwann cells to lactate for subsequent shuttling to A fibres. The C fibres most likely directly take up and metabolise fructose.
These differences are indicative of fibre sub-type specific metabolic profiles.
These results demonstrate that the physiological insights provided by the method can be applied to investigations of peripheral nerve, with a view to understanding the metabolic disruptions that underlie diabetic neuropathy.
Abstract
This article is protected by copyright. All rights reserved.
investigations into fibre sub-type substrate use. Our results suggest that C fibres directly take up and metabolise fructose, whereas A fibre conduction is supported by fructose-derived lactate, implying there exist unique metabolic profiles in neighbouring fibre sub-types present within the same nerve trunk.
Abbreviations
CAP compound action potential CIN cinnemate
MON mouse optic nerve RON rodent optic nerve
aCSF artificial cerebrospinal fluid
ms millisecond
Hz Hertz
mM milliMolar
Introduction
This article is protected by copyright. All rights reserved.
strategies can be compared. The rodent optic nerve (RON), a central white matter
tract, devoid of synapses and cell bodies, is cylindrical in shape and thus lends itself
well to the recording of CAPs with suction electrodes (Stys et al., 1991). The RON
model has been used to investigate the mechanisms of anoxic (Stys et al., 1992;
Baltan Tekkök et al., 2003; Allen et al., 2005), aglycemic (Brown et al., 2001a) and
ischemic injury (Garthwaite et al., 1999; Baltan et al., 2008; Salter & Fern, 2008;
Alix & Fern, 2009), as well as the roles of central glycogen (Brown et al., 2003;
Brown et al., 2004), the ability of non-glucose substrates to support axon conduction
(Brown et al., 2001b), and the burgeoning area of glia-to-neurone metabolic
signalling (Brown et al., 2004; Brown et al., 2005; Harris & Attwell, 2012).
This article is protected by copyright. All rights reserved.
response, and the difficulty in achieving robust, reliable recordings. This limits basic
understanding of C fibre metabolism, hampering insights into the metabolic
disturbances that precede small fibre diabetic neuropathy.
The purpose of this paper is to describe an improved method that enables
recording of stimulus evoked CAPs from mouse sciatic nerve A and C fibres
simultaneously for extended durations, with a view to enhancing our understanding
of peripheral nerve metabolism. With this goal in mind we proceeded with
experiments to define the role of fructose as a substrate in sciatic nerve for the
following reasons: (1) our method is ideal at revealing any differences in the fibre
sub-type response to fructose, (2) fructose, created from glucose by the polyol
pathway in Schwann cells (Champe & Harvey, 2008), may act as an endogenously
created metabolic substrate, (3) fibre sub-type differences related to the efficacy of
fructose as a substrate have been previously described in mouse optic nerve (Meakin
et al., 2007), and (4) there is evidence that fructose is converted to lactate in the
hippocampus (Izumi & Zorumski, 2009), an intriguing parallel with the ability of
glycogen-derived lactate to selectively support A fibres. We show that in the sciatic
nerve C fibres appear to directly take up and metabolise fructose, whereas the benefit
A fibres obtain from fructose is mediated by Schwann cell derived lactate. A
preliminary account of this work has been presented to The Physiological Society in
abstract form (Brown & Rich, 2017).
Methods and Materials
Ethical Approval
This article is protected by copyright. All rights reserved.
30 - 45 days of age) purchased from Charles River Laboratories (Margate, Kent, CT9 4LT, UK). Mice were group housed with ad libitum access to food and water, and maintained at 22 - 23°C on a 12:12 hr light-dark cycle. Mice were killed by Schedule 1 cervical dislocation; death was confirmed by permanent cessation of the circulation. A total of 68 mice were used, with some nerves being used to provide data for more than one experimental condition, e.g. the data illustrated in Fig 4 was recorded prior to proceeding to the experiments shown in Fig 6. The majority of the nerves provided A and C fibre CAPs. In total 101 sciatic nerve recordings were made. The authors understand the ethical principles under which The Journal of Physiology operates and declare that our work complies with this animal ethics checklist.
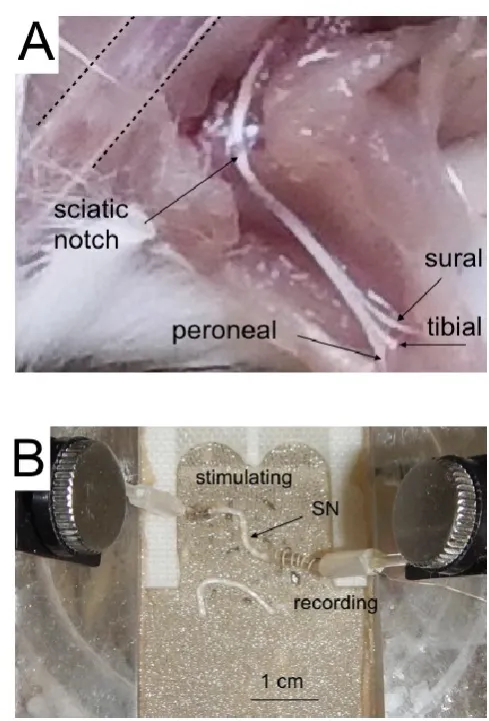
Dissection of the mouse sciatic nerve
This article is protected by copyright. All rights reserved.
notch liberates the nerve from particularly tough connective tissue adhesions and collateral cutaneous branches. A pair of forceps can then be passed underneath the nerve to remove any remaining lesions with neighbouring tissue, and careful retraction of the nerve from the muscle frees the tissue. The nerve is cut where it emerges from the vertebrae and gently pulled down towards the tail to return tension to the nerve, thereby making it easier to make the final cut in the leg and helping ensure the longest length of nerve possible is dissected. It is then cut distal to where it branches in the leg and gently transferred to the superfusion chamber. The nerves we recorded from were between 11 and 12 mm in length. The procedure for the left sciatic nerve is similar, although we have found it easier to rotate the corkboard by 180° so that the tail now faces away from the dissector. In this manner the right hand direction of incision along the left leg is preserved. We routinely use two identical set ups to record from both sciatic nerves, each providing an A and C fibre response. This efficiency is in accord with the National Centre for Replacement, Refinement and Reduction in Animal Experiments in the UK.
Superfusion chamber
The nerves were allowed to equilibrate in the interface superperfusion chamber (Medical Systems Corp, Greenvale, NY), for 10 to 15 minutes prior to recording. The nerves were maintained at 37°C and superfused with aCSF containing (in mmol/L): NaCl 126, KCl 3.0, CaCl2 2.0, MgCl2 2.0, NaH2PO4 1.2, NaHCO3 26 at a rate of about 2 ml min-1. Control
aCSF contained 10 mM glucose. The substrate in the aCSF can be omitted completely (substrate-free), or replaced with another, in order to study aglycemia or fructose metabolism, respectively. The chamber was continuously aerated by a humidified gas mixture of 95% O2/5% CO2. Suction electrodes back filled with substrate-free aCSF, to
This article is protected by copyright. All rights reserved.
Electrophysiological recordings
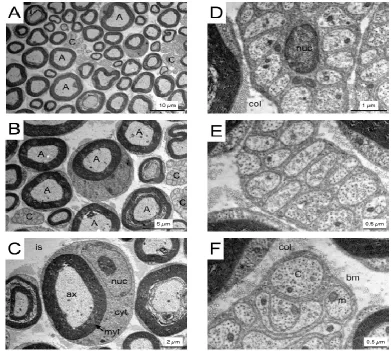
The recordings of the stimulus evoked CAPs were controlled by proprietary software. A Grass S88 stimulator connected to two SIU5 isolation units in parallel was used to stimulate the nerve. The Grass S88 is capable of delivering paired pulses; the duration and amplitude of each can be independently controlled, as can the delay between the two pulses. In our previous publication on sciatic nerve only the A or C fibre CAP was recorded from each nerve (Brown et al., 2012), but this new method offers an ideal opportunity to evoke simultaneously the A and C fibre CAPs from each sciatic nerve, which allows comparison of A and C fibre responses under identical experimental conditions. We were unable to distinguish the sub-groups of A fibre, thus the low threshold CAP we recorded was considered to comprise contributions of all A fibres. The sciatic nerve is composed of two distinct fibre sub-types. The large A fibres (up to 10 m in diameter) are myelinated by Schwann cells, whereas the smaller (up to 1 m in diameter), unmyelinated C fibres are enclosed in groups within Schwann cell cytoplasm into Remak bundles (Fig 2). Size and the presence of myelin confer upon each fibre sub-type a conduction velocity that is reflected in the profile of the stimulus evoked CAP. In addition, fibre size determines the stimulus threshold at which action potentials are evoked (Patton, 1982). The signal was amplified up to x1000 in AC mode by a Stanford Research Systems Preamplifier (SR560, Stanford Research Systems, Sunnyvale, CA) and filtered at 30 kHz and acquired at 20 kHz (Clampex 9.2, Molecular Devices, Wokingham, UK). The field potential generated by the stimulus artefact was recorded by a AgCl wire wrapped around the outside of the recording electrode, with a separate AgCl wire inserted into the lumen of the capillary glass to record the CAP. The CAP was obtained using the differential properties of the amplifier, where the artefact was eliminated by subtraction. Each CAP was recorded in this manner, thus the CAP represents the active response minus the passive stimulus artefact. In order to remove the remaining transient artefact (for details see Stys et al., 1991) the nerve was crushed between forceps at the conclusion of each experiment, ensuring only the passive response was recorded. In post experimental processing the crushed response was subtracted from each CAP.
Lactate biosensors
This article is protected by copyright. All rights reserved.
the null signal did not meaningfully alter the lactate signal amplitude. The lactate biosensors (25 m in diameter and 500 m in length) were pressed against the sciatic nerve, to record [lac] release from the nerve. Experimental recordings began after an equilibration period of up to an hour. At the beginning and end of all experiments, lactate biosensors were calibrated using lactate concentrations of 10 M and 100 M. Results were considered valid only if the before and after calibrations deviated by no more than 10 %.
Transmission Electron microscopy (TEM)
Sciatic nerves were dissected as described above, laid out on cardboard and then immediately fixed in 2% glutaraldehyde and 2% paraformaldehyde in 0.2 M phosphate buffer overnight and post-fixed in 1% osmium tetroxide for 30 minutes. They were dehydrated in a graded ethanol series and embedded in Transmit low viscosity resin (TAAB). Semi thin sections were cut at 0.5 m, stained with toluidine blue and photographed using a Leica DM400B light microscope with colour digital camera and Openlab darkroom software. Ultrathin sections (70 - 90 nm) were prepared using a Reichert-Jung Ultracut E ultramicrotome and mounted on 100 hexagonal copper grids. They were contrasted using Uranyl acetate and Lead Citrate and viewed using a JEOL 1010 TEM operated at 80 kV with digital image acquisition.
Data Analysis
This article is protected by copyright. All rights reserved.
the A and C fibre CAP amplitudes over extended periods of time, and simply displaying overlapping traces is inadequate due to the limitations of identifying individual traces. We opened a separate viewing window that plots A fibre CAP peak amplitude as it is acquired, enabling us to monitor the A fibre CAP amplitude in real time over the course of the entire experiment: a similar procedure can be applied to the C fibre CAP. Nerves were stimulated at 1 Hz, with sixty traces averaged then recorded: the use of sequencing keys allowed us to automate continuous recording of the averaged CAPs. The C fibre CAP was measured as area, rather than amplitude as this better reflects the number of contributing axons (Patton, 1982). The ability of substrates to support conduction can be measured as the area under the normalised CAP over time, as illustrated by the shaded area in Fig 6A (GraphPad Prism 7). This conversion of raw data into a quantifiable measure of substrate efficacy provides a numerical basis for statistical analysis.
Statistical Analysis.
Descriptive statistics are expressed as the mean ± standard deviation and n refers to the number of nerves. An n value of between 3 and 6 was used for each condition in the experiments (see Figure Legends for details). The stimulus strength versus A and C fibre amplitude (Fig 4A) was fit with a Boltzmann sigmoidal curve of the form:
where V0.5 indicates the stimulus current where the half maximal amplitude occurs and slope
occurs at V0.5. A modified version of this equation was used to measure the CAP area over
time shown as the shaded area in Fig 6A. One-way ANOVA with Sidak post-tests were used to determine the significance of selected inter-group differences. All data were analysed with GraphPad Prism 7 (La Jolla, CA 92037, USA).
Results
CAPs recorded from mouse sciatic nerve
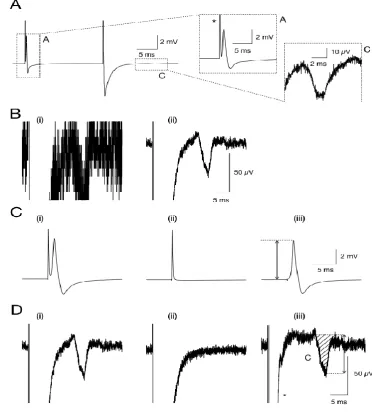
An example of CAPs recorded from sciatic nerve using a paired pulse protocol designed to selectively recruit the A and C fibres is shown in Fig 3A. The initial pulse (30 s
y =
1
1 + exp
V0.5-stim current
This article is protected by copyright. All rights reserved.
duration, 15 V amplitude) recruited all the available A fibres, producing a monophasic profile that peaked within 0.5 ms of the stimulus. A second pulse (20 ms later, 30 s duration, 130 V amplitude) produced a more complex profile. The large negatively going deflection lasted between 5 and 10 ms, and incorporates not only the artefact, but also includes the maximal A fibre response. The small C fibre CAP occurs between 13 and 18 ms after the stimulus and lasts about 7 ms. Depending upon recording conditions and the length of the nerve, the C fibre CAP can occur on the rising phase of the artefact necessitating its subtraction to ensure a stable baseline. The relatively small amplitude of the C fibre CAP produces an individual trace that is obscured by the ambient noise (Fig 3Bi) making distinguishing the CAP profile difficult. We have used signal averaging properties of the acquisition software to boost the signal to noise ratio by evoking the C fibre CAP every second, and displaying a running average of the traces, such that each trace is displayed as in Fig 3Bi, but superimposed on top of this trace, in a different colour, is the running average of the responses (Fig 3Bii), which optimises viewing. The stimulus artefacts can interfere with the A and C fibre peaks, and are removed post-acquisition in order to reveal the active response of the nerve uncontaminated by artefact (see Methods). The effects on both the A and C fibre CAPs, respectively, are illustrated in Fig 3C and Fig 3D, respectively.
Characteristics of the CAPs
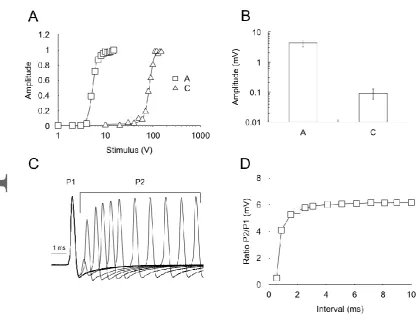
The selective recruitment of the A and C fibres is shown in Fig 4A. The A fibres have a lower recruitment threshold (~5 V), with the maximal response reached between 10 and 15 V.
This article is protected by copyright. All rights reserved.
determine the relative refractory period of the A fibre CAP. This was estimated using a double pulse protocol in which the 1st pulse evoked the maximum A fibre CAP, followed by a
2nd pulse of an equivalent magnitude at decreasing inter-pulse intervals to determine when
the 2nd peak started to decrease, an indication that the Na+ channels were not allowed
sufficient time to recover from inactivation after the 1st pulse (Fig 4C). Plotting the ratio of
the amplitude of the 2nd pulse relative to that evoked by the 1st pulse demonstrated that at
inter-pulse intervals below 5 ms the amplitude of the CAP evoked by the 2nd pulse began to
fail (Fig 4D), which equates to a frequency of 200 Hz. We imposed 50 Hz stimulus commensurate with introduction of substrate free aCSF. The A fibre CAP fell more rapidly in these conditions than when stimulated at 1 Hz. We have previously shown that imposing high frequency stimulus causes a depletion of glycogen in MON (Brown et al., 2003), and presume that an equivalent process occurs in the sciatic nerve under conditions of imposed high frequency stimulus. Thus we are confident that the accelerated A fibre CAP failure we see when imposing 50 Hz stimulus (Fig 6A & D) is due entirely to stimulus induced exhaustion of glycogen supplies (Brown et al., 2003), although it should be borne in mind that the processes that reduce the number of active channels rather than the kinetics of their inactivation will not be identified by this method.
Metabolic studies
This article is protected by copyright. All rights reserved.
Ability of fructose to maintain the CAP
The A fibre CAP was fully supported for 8 hours in 10 mM glucose and 20 mM fructose aCSF, but not in 5 mM or 10 mM fructose. The similarity in the latency to CAP failure between 5 mM or 10 mM fructose, and substrate free aCSF suggests that at these concentrations fructose offers no benefit to the A fibres. The C fibre CAP however was more robust when fructose was the sole exogenously supplied substrate, with 10 mM glucose and 20 mM fructose supporting the CAP for 8 hours, and 10 mM fructose and 5 mM fructose fully supporting the CAP for 5 to 6 hours before it slowly fell (Fig 6B and C). Imposing 50 Hz stimulus at the onset of introduction of substrate free aCSF, significantly accelerated A fibre CAP failure, the result of increased tissue energy demand exhausting glycogen reserves sooner (Fig 6A and C).
The disparity between 10 mM and 20 mM fructose support of the A fibre CAP was investigated for the following reasons. We have found in MON that 2 mM glucose supported the CAP. However depleting glycogen with brief exposure to substrate-free aCSF resulted in subsequent exposure to 2 mM glucose being incapable of supporting the CAP (Brown et al., 2003). We used a similar strategy to see whether an equivalent scenario was occurring i.e. that in the presence of 10 mM fructose, glycogen was metabolised to support the A fibre CAP, but once the glycogen was depleted the fructose would be incapable of fully supporting the A fibre CAP (see Fig 5). We exposed the nerve to 2 hours of 10 mM glucose, 20 mM fructose or 10 mM fructose aCSF, then switched to substrate-free aCSF. The A fibre CAP began to fail rapidly in nerves pre-incubated in 10 mM fructose, but there was no significant difference in the latency to CAP failure when nerves were pre-incubated in 10 mM glucose or 20 mM fructose (Fig 7A and B).
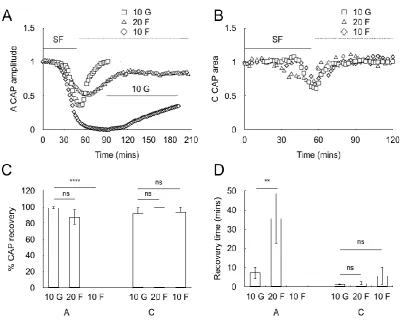
Ability of fructose to recover the CAP
This article is protected by copyright. All rights reserved.
whereas 10 mM fructose was unable to rescue the CAP, the contrast with glucose clearly illustrated when subsequent introduction of 10 mM glucose aCSF rapidly restored the CAP (Fig 8A, C and D). In the C fibres the CAP was equally restored in 10 mM glucose, 20 mM fructose or 10 mM fructose aCSF (Fig 8B, C and D).
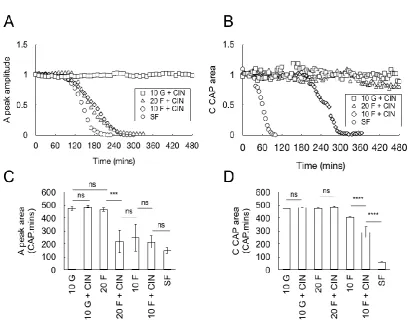
Effect of blocking lactate uptake with cinnemate
In light of the role of glycogen in supporting the CAP in 10 mM fructose, and the trafficking of fructose to lactate reported in the hippocampus (Izumi & Zorumski, 2009), we used the compound cinnemate (200 M) to interrupt lactate uptake into axons (Choi et al., 2012), with a view to dissecting direct fructose uptake into axons, from fructose derived lactate production. The most likely source of lactate is the Schwann cell given the established ability of astrocytes to fulfil this function in the CNS (Pellerin et al., 2007). Maintenance of CAPs in 10 mM glucose, 20 mM fructose or 10 mM fructose plus cinnemate showed clear differences between the A and C fibres. Only 10 mM glucose was able to fully support the A fibre CAP in the presence of cinnemate, with CAP failure occurring with 20 mM fructose or 10 mM fructose plus cinnemate (Fig 9A and C). However C fibre CAPs proved more robust, with failure occurring with 10 mM fructose plus cinnemate towards the end of the experimental time period (Fig 9B and D). As a further test of the phenomenon we carried out recovery experiments in the presence of cinnemate to block axonal uptake of lactate. Cinnemate had no effect on the ability of 10 mM glucose to recover the A fibre CAP (Fig 10A and D), but rendered 20 mM fructose unable to restore the CAP (Fig 10B and D). The stark contrast between 20 mM fructose and 10 mM glucose is illustrated, where 10 mM glucose plus cinnemate rapidly restores the CAP, but subsequent exposure to 20 mM fructose and cinnemate causes rapid CAP failure, indicating that lactate uptake into A fibre underlies the support provided by 20 mM fructose (Fig 10B). The ability of 10 mM glucose, 20 mM fructose and 10 mM fructose to restore the CAP in the C fibres was unaffected by cinnemate (Fig 10C and D).
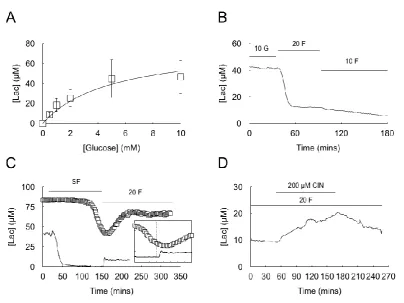
Extracellular lactate measurements
This article is protected by copyright. All rights reserved.
glucose ([glucose]), which showed saturation of the lactate signal above about 5 mM glucose (Fig 11A). The [lac] measured at the edge of the nerve is relatively low in nerves perfused with 10 mM glucose (~50 M). Bathing the sciatic nerve in 20 mM fructose caused a fall in
[lac] to a stable baseline value of between 15 and 20 M, but when 10 mM fructose aCSF was perfused [lac] gradually fell towards zero (Fig 11B: see discussion). For this reason we were unable to construct a lactate dose response curve with fructose. To test the hypothesis that the delay in the recovery of the A fibre CAP in 20 mM fructose, relative to that of glucose, is due to delayed production of lactate in the presence of fructose, we bathed the nerves in substrate free aCSF until the CAP started to fall, while simultaneously recording [lac]. At the onset of aglycemia [lac] fell to zero as previously reported (Brown et al., 2012). Introduction of 20 mM fructose aCSF resulted in a delayed increase in [lac], whose time course suggested that the A fibre CAP only starts to recover when the [lac] plateaus after introduction of fructose aCSF (Fig 11C). To further confirm this conversion of fructose to lactate we recorded a stable [lac] of 15 M in nerves perfused with 20 mM fructose before subsequent addition of cinnemate, which resulted in a slow, steady increase in [lac] (Fig 11D) that reversed upon washout of cinnemate.
Discussion
The results described in this paper demonstrate that in mouse sciatic nerve both the A and C fibre CAPs are maintained with fructose as the sole exogenously applied substrate if delivered at a sufficiently high concentration. If the concentration of fructose is lowered however, only the C fibres continue to conduct. Whereas the C fibres appear to directly take up and metabolise fructose, the A fibre benefit from fructose is mediated by a Schwann cell-to-axon lactate shuttle. Our results suggest that there exist in the sciatic nerve two distinct metabolic profiles in neighbouring fibre sub-types.
Recording from in vitro sciatic nerve
This article is protected by copyright. All rights reserved.
which demonstrated clear inter-fibre differences, namely the shorter latency to C fibre CAP failure compared to A fibres, due to the presence of Schwann cell glycogen that is metabolised to lactate and shuttled to the A fibres (Brown et al., 2012). Such metabolic distinctions between two fibre sub-types present in the same nerve trunk implied a previously unsuspected metabolic versatility and diversity. This observation is of particular interest since the unmyelinated C fibres, which do not benefit from glycogen, are more susceptible to diabetic injury than myelinated A fibres (Navarro et al., 1989; Lacomis, 2002), suggesting a potential metabolic cause of small fibre diabetic neuropathy based on substrate availability and use.
The sciatic nerve A fibre CAP can survive for up to 2 hours in the absence of exogenously applied glucose, underlining the sluggish metabolic rate of peripheral nerve when compared to central white matter (Hothersall et al., 1982), where the CAP would fail within 20 minutes under equivalent circumstances (Brown et al., 2003; Brown et al., 2005). As a consequence experiments designed to investigate the ability of non-glucose substrates to support conduction are inevitably of long duration, although A fibre CAP failure is accelerated if introduction of substrate-free aCSF is accompanied by imposition of 50 Hz stimulus, which we have previously shown as an effective means by which to deplete glycogen (Brown et al., 2003; Brown et al., 2005). We have identified the following confounding factors that impede the ability to successfully carry out such experiments: (i) stability of recordings, (ii) ability to visualise the A fibre CAP amplitude in real time, and (iii) ability of visualise the C fibre CAP profile and amplitude/area in real time. The differences in response of the A and C fibre CAPs to substrate-free aCSF convinced us of the merits of recording simultaneously the A and C fibre CAPs. The differences in threshold of the two fibre types precludes the opportunity to evoke both fibres with a single pulse, accordingly we used a Grass S88 stimulator to deliver paired pulses to the nerve. The large A fibres have a lower threshold than the C fibres, and a small (up to 15 V) pulse was used to recruit the A fibres. A delay of 20 ms separated this pulse from the 2nd pulse (up to 150 V) used to evoke
the C fibres. The threshold for the C fibres is higher than that for the A fibres, thus the 1st
This article is protected by copyright. All rights reserved.
C fibre CAP profile
We have been unable to locate any publications illustrating recordings from unmyelinated C fibres from mouse sciatic nerve of equivalent duration to those illustrated in this paper. The primary model for electrophysiological examination of unmyelinated fibres has been the vagus nerve, which comprises 90% unmyelinated axons, where the preferred recording environment is either the sucrose (Gaumann et al., 1992, 1994; Erne-Brand et al., 1999; Dalle et al., 2001; Jirounek et al., 2002) or grease gap (Docherty et al., 2005) techniques. The sucrose gap technique requires a very short conducting distance in order to minimise the temporal dispersion of action potential arrivals, thereby maximising the amplitude of the CAP (Velumian et al., 2010). However, from a metabolic viewpoint, the vagus nerve is of limited translational relevance, as it is the sciatic nerve that is exquisitely sensitive to diabetes, with initial symptoms of neuropathy emanating from the distal sciatic nerve in the foot (Navarro et al., 1989). The C fibre CAP profile, a discrete peak of about 7 ms duration, 13 to 18 ms after the stimulus, is indicative of a contributing axon population of limited diameter range. Since conduction velocity is proportional to the square root of axon diameter in unmyelinated axons (Rushton, 1951; Hodgkin, 1954; Waxman & Bennett, 1972), applying this relationship to our recordings in sciatic nerve of length 12 mm, results in an estimated axon diameter range of between 500 m and 900 m. We have not carried out an equivalent study to the one we conducted in MON, where we used TEM to construct axon diameter histograms (Allen et al., 2006), but these estimated axon diameters match those illustrated in Fig 2. Considering the relationship between stimulus amplitude and amplitude of the evoked C fibre CAP as a cumulative distribution function relating stimulus intensity to axon threshold (Fig 4A), implies that the slope is indicative of the standard deviation of distribution. If we accept that the C fibres represent a homogeneous, unmyelinated axon population, then the principal variable that determines threshold is axon size. Since conduction velocity varies with axon size in a predictable manner, the relatively steep slope is reflected in the discrete C fibre CAP, whose profile is of a sufficient magnitude to make meaningful measurements.
Fructose metabolism
This article is protected by copyright. All rights reserved.
slices (Bernheim & Bernheim, 1941; Klein, 1944; McIlwain, 1953), and has since been shown to support both central grey matter (McIlwain & Bachelard, 1985; Izumi & Zorumski, 2009), white matter (Allen et al., 2006; Meakin et al., 2007) and sciatic nerve (Stecker & Stevenson, 2015). In the MON 10 mM fructose exhibits the intriguing property of supporting the smaller axons, but not the larger ones, due to selective distribution of the enzyme fructokinase (Meakin et al., 2007), which has a high affinity and high capacity for fructose (hexokinase can metabolise fructose but has a lower affinity and capacity, Newsholme & Leech, 1983). The sciatic nerve is of particular interest with regard to fructose metabolism as it has the ability to produce fructose from glucose via the polyol pathway, reactions involving aldose reductose and sorbitol dehydrogenase in Schwann cells, a feature shared with liver, ovaries, sperm and seminal vesicles (Champe & Harvey, 2008). An intriguing report in hippocampus demonstrated that the support afforded hippocampal neurones from fructose is mediated via glial cell conversion of fructose to lactate, which is subsequently shuttled to neurones (Izumi & Zorumski, 2009). The sciatic nerve receives its blood supply via the vasa nervosum, where any dietary derived fructose would be available to the nerve In our recording setup, where we record from in vitro sciatic nerve, the blood supply is circumvented thus the vasa nervosum would play no role in the supply of fructose to the nerve.
This article is protected by copyright. All rights reserved.
A fibres do not benefit from this lower concentration of fructose, and that under these conditions Schwann cell glycogen is metabolised to temporarily support conduction (Fig 12D). The C fibres most likely take up fructose directly, although its effectiveness in supporting conduction is impaired by cinnemate. However the following should be borne in mind; the considerable difference in the metabolic demand between small unmyelinated, and larger myelinated axons (Wang et al., 2008), coupled with the relative paucity of information regarding peripheral nerve metabolism, make it possible that at least part of cinnemate’s action results from its ability to block mitochondrial pyruvate uptake (McCommis & Finck, 2015). Alternatively, the fall in C fibre CAP may be an indirect result of A fibre loss of function, and the inevitable elevation in interstitial K+, which is supported by
the data shown in Fig 6, where a fall in A fibre CAP in 10 mM or 5 mM fructose is mirrored by a delayed fall in C fibre CAP under equivalent conditions. We are currently using immunohistochemical techniques to explore the cell specific expression of glucose transporters and fructokinase in sciatic nerve.
Lactate shuttle
This article is protected by copyright. All rights reserved.
nerve (Brown et al., 2012). Thus, lactate shuttling may be considered a universal process that occurs throughout the nervous system and involves conversion in glia of glucose or glycogen to lactate. The lactate, a metabolic conduit, is subsequently transported, via the interstitial fluid, to neuronal elements to support conduction. As such [lac] recorded in the interstitial space (Suzuki et al., 2011; Brown et al., 2012; Choi et al., 2012; Yang et al., 2014) is a ‘substrate in transit’ rather than a waste product. The differences between shuttling in the peripheral versus central nervous system must be considered. The brain is protected by the blood brain barrier (Bradbury, 1979), which excludes substances present in the systemic circulation, although transport mechanisms exist for uptake of desirable compounds such as glucose and essential amino acids (Ransom, 2009). The peripheral nerves have no such barrier, but are enclosed within the epineurium and each fibre bundle is further enclosed within the perineurium (King, 1999). These do not offer the same barrier to substrate transport and may be considered leaky. As such systemic substances have relatively easier access to peripheral tissue than the CNS, thus dietary fructose may be a viable substrate for peripheral nerve, whereas its utility in the brain is questionable. The shuttling of fructose to lactate in Schwann cells is novel, but a similar process has been described in hippocampus (Izumi & Zorumski, 2009). We are confident that the Schwann cells produce the lactate for the following reasons. There have been no previous instances of axonal lactate production or export, whereas astrocytes, oligodendrocytes and Schwann cells in culture have all demonstrated this feature. Cinnemate blocks CAP conduction, which, if the lactate were produced by the axons, would lead to axonal retention of lactate and thus be available for metabolism. Where the sciatic nerve differs from the hippocampus (although see Hwang et al., 2017) is that it is able to create fructose from glucose via the polyol pathway (Champe & Harvey, 2008), which is accelerated in diabetes. Our results imply that the Schwann cell is capable of converting fructose to lactate so this may be the ultimate fate of such fructose; any proposals of its significance are purely conjecture.
This article is protected by copyright. All rights reserved.
revealing fibre sub-type specific utility of substrates may be germane in elucidating
the mechanisms underlying diabetic neuropathy and ultimately help in developing
clinically effective neuro-protective strategies.
[image:22.595.86.331.343.704.2]Figure Legends
Figure 1
This article is protected by copyright. All rights reserved.
Figure 2
This article is protected by copyright. All rights reserved.
Figure 3
CAP recorded from sciatic nerve using a paired pulse protocol. A. The 1st stimulus
This article is protected by copyright. All rights reserved.
Figure 4
Characteristics of the A and C fibre CAPs. A. Stimulus response plots for A and C fibre CAPs showing that the maximal A fibre CAP occurs below the threshold for C fibre recruitment. The plots were fitted with a Boltzmann sigmoidal relationship with V0.5 of 5.3
and 83.7 V, and slope 0.63 and 9.75, respectively, for the A and C fibre CAPs, respectively. B. The amplitude for maximal A fibre CAP was 4.23 ± 1.09 mV (n = 8) versus 92.3 ± 33.3 V (n = 8) for the C fibre CAP. C. Superimposed A fibre CAPs evoked by a double pulse protocol with the 2nd pulse (P2) occurring at decreased inter-pulse intervals from the 1st (P1). D. The
[image:25.595.60.480.288.622.2]ratio of P2/P1 plotted against the inter-pulse interval shows a decreased P2 peak when the inter-pulse interval is below about 4 ms.
Figure 5
This article is protected by copyright. All rights reserved.
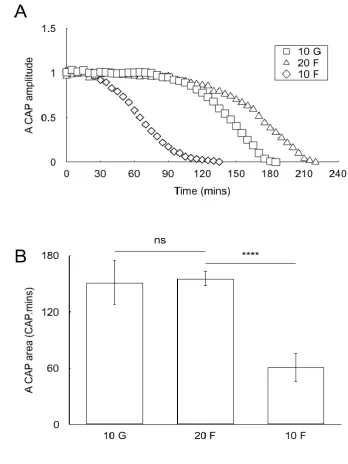
[image:26.595.125.450.213.427.2]G) then 10 mM fructose (10 F) revealed the ability of the substrates to support conduction in the A and C fibres, which provides key physiological insights into the metabolic profile of each fibre sub-type. CAPs are expressed as offset normalised amplitudes / areas to allow for optimal comparison between fibre sub-types.
Figure 6
This article is protected by copyright. All rights reserved.
This article is protected by copyright. All rights reserved.
Figure 7
This article is protected by copyright. All rights reserved. Figure 8
This article is protected by copyright. All rights reserved.
Figure 9
This article is protected by copyright. All rights reserved.
Figure 10
This article is protected by copyright. All rights reserved.
Figure 11
This article is protected by copyright. All rights reserved.
Figure 12
This article is protected by copyright. All rights reserved. Table 1
Summary of the ability of glucose and varying concentrations of fructose, in the presence or absence of cinnemate, to maintain or recover the A and C fibre CAP. Data are extracted from Fig 6C, Fig 8D, Fig 9C & D and Fig 10D. The measure of the ability of the substrates to maintain the CAP was calculated as the maximum value in 10 mM glucose minus the value in substrate free aCSF. This was then converted to a percentage.. Note that by expressing the 0 mM glucose data as nominally 0 % baseline, the accelerating effect of 50 Hz stimulus on A fibre CAP latency compared to baseline returns a negative value.
Table 1
Substrate Maintain (%) Recover (%)
A C A C
10 mM glucose 100 100 98.7 92.1
20 mM fructose 96.9 102.2 87.7 99.9
10 mM fructose 30.2 85.6 0 93.8
5 mM fructose 15.4 81.7
0 mM glucose 0 0
0 mM glucose + 50 Hz stimulus -23.4
10 mM glucose + CIN 104.2 104.1 92.5 94.3
20 mM fructose + CIN 21.5 105.2 0 99.9
This article is protected by copyright. All rights reserved. References
Alix JJ & Fern R. (2009). Glutamate receptor-mediated ischemic injury of premyelinated central axons. Ann Neurol66, 682-693.
Allen L, Anderson S, Wender R, Meakin P, Ransom BR, Ray DE & Brown AM. (2006). Fructose supports energy metabolism of some, but not all, axons in adult mouse optic nerve. J Neurophysiol95, 1917-1925.
Allen NJ, Karadottir R & Attwell D. (2005). A preferential role for glycolysis in preventing the anoxic depolarization of rat hippocampal area CA1 pyramidal cells. J Neurosci
25, 848-859.
Baltan S, Besancon EF, Mbow B, Ye Z, Hamner MA & Ransom BR. (2008). White matter vulnerability to ischemic injury increases with age because of enhanced excitotoxicity.
J Neurosci28, 1479-1489.
Baltan Tekkök S, Brown AM & Ransom BR. (2003). Axon function persists during anoxia in mammalian white matter. J Cereb Blood Flow Met23, 1340-1348.
Bernheim F & Bernheim MLC. (1941). Note on the oxidation of various sugars by brain tissue. J Biol Chem140, 441-444.
Berthold C-H. (1978). Morphology of normal peripheral axons. In Physiology and Pathology
of Axons, ed. Waxman SG, pp. 3-63. Raven Press, New York.
Berthold C-H & Rydmark M. (1995). Morphology of normal peripheral axons. In The Axon, ed. Waxman SG, Kocsis JD & Stys PK, pp. 13-48. Oxford, OUP.
This article is protected by copyright. All rights reserved.
Brown AM, Baltan Tekkok S & Ransom BR. (2004). Energy transfer from astrocytes to axons: the role of CNS glycogen. Neurochem Int45, 529-536.
Brown AM, Evans RD, Black J & Ransom BR. (2012). Schwann cell glycogen selectively supports myelinated axon function. Ann Neurol72, 406-418.
Brown AM & Rich LR. (2017). An improved method that allows simultaneous recording of stimulus evoked A and C fibre conduction in mouse sciatic nerve. Proc Physiol Soc
39.
Brown AM, Sickmann HM, Fosgerau K, Lund TM, Schousboe A, Waagepetersen HS & Ransom BR. (2005). Astrocyte glycogen metabolism is required for neural activity during aglycemia or intense stimulation in mouse white matter. J Neurosci Res 79, 74-80.
Brown AM, Tekkok SB & Ransom BR. (2003). Glycogen regulation and functional role in mouse white matter. J Physiol549, 501-512.
Brown AM, Wender R & Ransom BR. (2001a). Ionic mechanisms of aglycemic axon injury in mammalian central white matter. J Cereb Blood Flow Met21, 385-395.
Brown AM, Wender R & Ransom BR. (2001b). Metabolic substrates other than glucose support axon function in central white matter. J Neurosci Res66, 839-843.
Champe PC & Harvey RA. (2008). Biochemistry. Lippincott Williams & Wilkins, Baltimore.
This article is protected by copyright. All rights reserved.
Cummins KL, Perkel DH & Dorfman LJ. (1979). Nerve fiber conduction-velocity distributions. I. Estimation based on the single-fiber and compound action potentials. Electroencephalogr Clin Neurophysiol46, 634-646.
Dalle C, Schneider M, Clergue F, Bretton C & Jirounek P. (2001). Inhibition of the I(h) current in isolated peripheral nerve: a novel mode of peripheral antinociception?
Muscle Nerve24, 254-261.
Devuyst G & Bogousslavsky J. (1999). Clinical trial update: neuroprotection against acute ischaemic stroke. Curr Opin Neurol12, 73-79.
Dirnagl U, Iadecola C & Moskowitz MA. (1999). Pathobiology of ischaemic stroke: an integrated view. TiNS22, 391-397.
Docherty RJ, Charlesworth G, Farrag K, Bhattacharjee A & Costa S. (2005). The use of the rat isolated vagus nerve for functional measurements of the effect of drugs in vitro. J
Pharmacol Toxicol Methods51, 235-242.
Erne-Brand F, Jirounek P, Drewe J, Hampl K & Schneider MC. (1999). Mechanism of antinociceptive action of clonidine in nonmyelinated nerve fibres. Eur J Pharmacol
383, 1-8.
Garthwaite G, Brown G, Batchelor AM, Goodwin DA & Garthwaite J. (1999). Mechanisms of ischaemic damage to central white matter axons: a quantitative histological analysis using rat optic nerve. Neuroscience94, 1219-1230.
Gaumann DM, Brunet PC & Jirounek P. (1992). Clonidine enhances the effects of lidocaine on C-fiber action potential. Anesth Analg74, 719-725.
This article is protected by copyright. All rights reserved.
Grundy D. (2015). Principles and standards for reporting animal experiments in The Journal of Physiology and Experimental Physiology. J Physiol593, 2547-2549.
Harris JJ & Attwell D. (2012). The energetics of CNS white matter. J Neurosci32, 356-371.
Hodgkin AL. (1954). A note on conduction velocity. J Physiol125, 221-224.
Hothersall JS, Baquer NZ & McLean P. (1982). Pathways of carbohydrate metabolism in peripheral nervous tissue. I. The contribution of alternative routes of glucose utilization in peripheral nerve and brain. Enzyme27, 259-267.
Hwang JJ, Jiang L, Hamza M, Dai F, Belfort-DeAguiar R, Cline G, Rothman DL, Mason G & Sherwin RS. (2017). The human brain produces fructose from glucose. JCI Insight2, e90508.
Izumi Y & Zorumski CF. (2009). Glial-neuronal interactions underlying fructose utilization in rat hippocampal slices. Neuroscience161, 847-854.
Jirounek P, Bretton C & Dalle C. (2002). Axon-glia interactions modulate axonal excitability in mammalian unmyelinated nerves. J Physiol Paris96, 237-241.
King RC. (1999). Atlas of Peripheral Nerve Pathology. Arnold, London.
Klein R. (1944). Oxidation of fructose by brain in vitro. J Biol Chem153, 295-300.
Lacomis D. (2002). Small-fiber neuropathy. Muscle Nerve26, 173-188.
This article is protected by copyright. All rights reserved.
McCommis KS & Finck BN. (2015). Mitochondrial pyruvate transport: a historical perspective and future research directions. Biochem J466, 443-454.
McIlwain H. (1953). Substances which support respiration and metabolic response to electrical impulses in human cerebral tissues. J Neurol Neurosurg Psychiatry 16, 257-266.
McIlwain H & Bachelard HS. (1985). Biochemistry and the Central Nervous System. Churchill Livingstone, London.
Meakin PJ, Fowler MJ, Rathbone AJ, Allen LM, Ransom BR, Ray DE & Brown AM. (2007). Fructose metabolism in the adult mouse optic nerve, a central white matter tract. J
Cereb Blood Flow Metab27, 86-99.
Mohseni S. (2001). Hypoglycemic neuropathy. Acta Neuropathol (Berl)102, 413-421.
Morrison BM, Tsingalia A, Vidensky S, Lee Y, Jin L, Farah MH, Lengacher S, Magistretti PJ, Pellerin L & Rothstein JD. (2015). Deficiency in monocarboxylate transporter 1 (MCT1) in mice delays regeneration of peripheral nerves following sciatic nerve crush. Exp Neurol263, 325-338.
Navarro X, Kennedy WR & Fries TJ. (1989). Small nerve fiber dysfunction in diabetic neuropathy. Muscle Nerve12, 498-507.
Nave KA. (2010). Myelination and support of axonal integrity by glia. Nature468, 244-252.
Newsholme EA & Leech AR. (1983). Biochemistry for the Medical Sciences. John Wiley and Sons, New York.
This article is protected by copyright. All rights reserved.
Martin AR, Fuchs PA, Brown DA, Diamond ME & Weisblat DA, pp. 129-142. Sinauer Associates, Inc, Sunderland, MA, USA.
Ozaki K, Sano T, Tsuji N, Matsuura T & Narama I. (2010). Insulin-induced hypoglycemic peripheral motor neuropathy in spontaneously diabetic WBN/Kob rats. Comp Med
60, 282-287.
Patton HD. (1982). Special properties of nerve trunks and tracts. In Physiology and
Biophysics: IV Excitable Tissues and Reflex Control of Muscle, ed. Ruch T & Patton
H, pp. 101-127. W.B. Saunders Company, Philadelphia.
Pellerin L, Bouzier-Sore AK, Aubert A, Serres S, Merle M, Costalat R & Magistretti PJ. (2007). Activity-dependent regulation of energy metabolism by astrocytes: an update.
Glia55, 1251-1262.
Pellerin L & Magistretti PJ. (1994). Glutamate uptake into astrocytes stimulates aerobic glycolysis: a mechanism coupling neuronal activity to glucose utilization. Proc Natl
Acad Sci USA91, 10625-10629.
Ransom B. (2009). The neuronal microenvironment. In Medical Physiology, ed. Boron WF & Boulpaep EL, pp. 289-309. Saunders Elsevier, Philadelphia.
Ritchie JM. (1995). Physiology of axons. In The Axon, ed. Waxman SG, Kocsis JD & Stys PK, pp. 68-96. OUP, Oxford.
Rushton WA. (1951). A theory of the effects of fibre size in medullated nerve. J Physiol115, 101-122.
Salter MG & Fern R. (2008). The mechanisms of acute ischemic injury in the cell processes of developing white matter astrocytes. J Cereb Blood Flow Metab28, 588-601.
This article is protected by copyright. All rights reserved.
Stecker MM & Stevenson MR. (2015). Anoxia-induced changes in optimal substrate for peripheral nerve. Neuroscience284, 653-667.
Stys PK, Ransom BR & Waxman SG. (1991). Compound action potential of nerve recorded by suction electrode: a theoretical and experimental analysis. Brain Res546, 18-32.
Stys PK, Waxman SG & Ransom BR. (1992). Ionic mechanisms of anoxic injury in mammalian CNS white matter: role of Na+ channels and Na+-Ca2+ exchanger. J
Neurosci12, 430-439.
Suzuki A, Stern SA, Bozdagi O, Huntley GW, Walker RH, Magistretti PJ & Alberini CM. (2011). Astrocyte-neuron lactate transport is required for long-term memory formation. Cell144, 810-823.
Tomlinson DR & Gardiner NJ. (2008). Glucose neurotoxicity. Nat Rev Neurosci9, 36-45.
Velumian AA, Wan Y, Samoilova M & Fehlings MG. (2010). Modular double sucrose gap apparatus for improved recording of compound action potentials from rat and mouse spinal cord white matter preparations. J Neurosci Meth187, 33-40.
Wang SS, Shultz JR, Burish MJ, Harrison KH, Hof PR, Towns LC, Wagers MW & Wyatt KD. (2008). Shaping of white matter composition by biophysical scaling constraints. J
Neurosci28, 4047-4056.
Waxman SG & Bennett MV. (1972). Relative conduction velocities of small myelinated and non-myelinated fibres in the central nervous system. Nat New Biol238, 217-219.
This article is protected by copyright. All rights reserved.
Yang X, Hamner MA, Brown AM, Evans RD, Ye ZC, Chen S & Ransom BR. (2014). Novel hypoglycemic injury mechanism: N-methyl-D-aspartate receptor-mediated white matter damage. Ann Neurol75, 492-507.
Declaration of Interest
None declared. Funding
This research did not receive any specific grant from funding agencies in the public, commercial, or not-for-profit sectors. All costs were covered by institutional funding from the University of Nottingham.
Author Contribution
AMB was responsible for the conception and design of the study, LRR carried out all the electrophysiology studies, AMB and LRR carried out the lactate sensor studies, LRR analysed the data, AMB wrote the paper with input from LRR. Both authors approved the final version of the work submitted for publication and agree to be accountable for all aspects of this work.
Acknowledgements