The use of Virtual Reality and physical tools in the development and
validation of ease of entry and exit in passenger vehicles
Glyn Lawsona, Paul Herriottsb, Louise Malcolmb, Katharina Gabrechta, Setia Hermawatia a
Human Factors Research Group, Faculty of Engineering, The University of Nottingham, United Kingdom
b
Jaguar Land Rover, Gaydon, Warwickshire, CV35 0RR Corresponding author:[email protected]
Coates B72, Faculty of Engineering, University Park, The University of Nottingham, NG7 2RD +44(0)115 951 4003
Abstract
Ease of entry and exit is important for creating a positive first impression of a car and to
increase customer satisfaction. Several methods are used within vehicle development to
optimise ease of entry and exit, including CAD reviews, benchmarking and buck trials.
However, there is an industry trend towards digital methods to reduce the costs and time
associated with developing physical prototypes. This paper reports on a study of entry
strategy in three properties (buck, car, CAVE) in which inconsistencies were demonstrated
by people entering a vehicle representation in the CAVE. In a second study industry
practitioners rated the CAVE as worse than physical methods for identifying entry and exit
issues, and having lower perceived validity and reliability. However, the resource issues
associated with building bucks were recognised. Recommendations are made for
developing the CAVE and for combinations of methods for use at different stages of a
vehicle’s development.
Keywords:entry exit, automotive
Highlights:
Inconsistent entry strategies were observed in a CAVE virtual environment
The CAVE needs development to support design for ease of entry and exit
Representation of vehicular hard points is necessary for optimising entry and exit
Various combinations of methods are required at different stages of vehicle
1. Introduction
Entering and exiting a vehicle are complex motions that require control and strength
(Gransitzki 1994). These motions create high biomechanical stresses from bending, turning,
twisting, stretching and leaning (Bhise, 2011). Previous research has shown that car
designers and engineers need to pay particular attention to the ease of entry and exit for
several reasons. This is firstly because vehicle entry is the initial interaction the customer
has with the vehicle and is a key influence on purchasing decision (Causse et al., 2012;
Tetlock, 1983; Zhan et al., 2013). Secondly, entry and exit requires attention due to the
number of problems drivers have getting in and out of cars. In a large postal questionnaire
survey of older and younger drivers in Great Britain, 25% of older drivers and 14% of
younger drivers reported problems entering cars, while 32% of older and 18% of younger
drivers reported problems getting out of cars (Herriotts, 2005). Thirdly, minimising the
demands and stresses that occur on entry and exit can improve customer satisfaction
(Herriotts & Johnson, 2013). However, car design is a compromise between several vehicle
attributes and entry and exit may not always be prioritised in the trade-off between
packaging, styling, safety and other aspects (Koester and Hamilton, 1994). For example to
improve off-road capability the step up height for a sports-utility vehicle (SUV) may be higher
than optimal for customers when entering the vehicle; or the low roof of a sports car may
cause customers to stoop or to drop down into the vehicle as priority is given to sports car
styling and aerodynamics.
A variety of methods are used to assess the suitability of a design for the customer. These
are described below in the vehicle development process. At the beginning the ergonomist
data is then used to generate a “buck”, an early basic physical model of the target vehicle
(Figure 1). This can then be used for expert reviews and for user trials with participants
representing the target population to validate and develop ease of entry and exit (Andreoni
et al, 2004; Sternini and Cerrone, 1995). As the design develops, the quality and fidelity of
the buck increases, followed by the production of a prototype vehicle, at which point the
entry and exit condition can be validated with confidence. This traditional process is heavily
reliant on physical properties that are expensive and time consuming to produce (Ait El
Menceur et al, 2008; Laughery, 2005; Sӧdermann 2005). In addition, traditional user trials
with significant sized groups of people are cost and time intensive (Pudlo et al. 2006).
However, this process has been validated in numerous car companies and is known to result
in vehicles that accommodate the range of drivers and passengers (Herriotts & Johnson,
Figure 1. Vehicle buck – geometrically accurate representation of a vehicle. Bucks can be used to represent design targets or the current design intent. This image shows a passenger exiting a left-hand drive buck.
The vehicle development process is under increasing pressure as product life cycles are
shortening and automotive manufacturers today are faced with the challenge of bringing new
products to market in shorter intervals (Bernard et al., 2012; Schrader et al., 2002). To
achieve these aims, it is critical to evaluate the customers’ experience very early in the
vehicle design process, which can also reduce the costs of design changes as the
development cycle progresses (Laughery, 2005; Monnier et al, 2006). There is a general
trend in design and engineering to reduce the total development costs and time by using
computer aided engineering technologies. A robust virtual tool can reduce the need for
expensive physical prototypes (Hanson et al, 2006; Jayaram et al, 2001). Furthermore, with
virtual prototyping more design iterations are possible within a shorter time (Wang, 2002).
Digital vehicle models and digital human models are used to assess the ergonomics of
vehicles during the early phases of design, providing simulation of the physical interactions
between target customers and the vehicle (Chateauroux & Wang, 2010). Digital Human
Modelling (DHM) uses digital manikins that can be changed in size and shape to represent
the target range of users. DHM is used throughout the automotive industry to evaluate
driving position, vision, reach and posture, but has not traditionally been used for entry and
exit. There has however been a recent focus on research into DHM for entry and exit (e.g.
Chateauroux & Wang, 2010; Cherednichenko et al., 2006; Kawachi et al., 2005; Monnier et
al, 2006; Reed & Huang, 2008). With DHM the manikin can be moved as a real person
moves, but cannot reliably register discomfort or satisfaction. As entry and exit is a dynamic
process, and as human behaviour is so complex, people vary in the movement strategies
used when getting in and out of a vehicle. Currently DHM tools cannot predict these
Monnier et al (2006) presented a DHM system for evaluating entry and exit using motion
capture to digitise the movements of 23 people entering and exiting four different car
models. They then identified the movement strategies used and significant vehicle
parameters before applying an algorithm to simulate motion and subjective discomfort
ratings for individuals and the subject population. However, Monnier et al.’s (2006) system
lacks validation and further work is required on the discomfort prediction, which currently
excludes dynamic parameters. Moreover, the system initially requires data capture from real
people using bucks or cars, which may limit the benefits. Other authors have also had
difficulty in using DHM to predict real world behaviour. Reed and Huang (2008) developed a
framework for control of complex motions in DHM, such as entry and exit. While the authors
were able to model different entry strategies using the framework, it lacked the ability to
predict subjective responses. Reed & Huang (2008) concluded that for DHM to be a valid
tool there must be a documented relationship between kinematic or dynamic variables and
subjective responses. This has not yet been validated for complex movements such as
entry and exit.
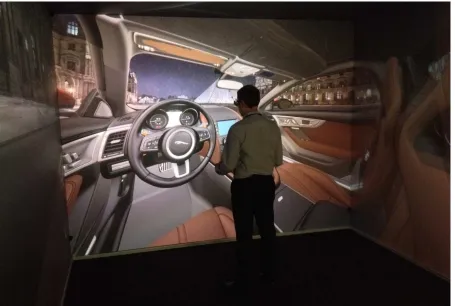
In addition to DHM, Virtual Reality (VR) CAVEs are now being used in automotive design. A
VR CAVE is a semi-immersive environment where images are projected on to three walls
and the ceiling (Figure 2). A user wears 3D glasses to enable depth perception in the
environment (Cruz-Neira et al, 1992). When the user moves in the CAVE, his or her head
position is tracked in order to present the images in real-time and to provide the correct
perspective (Rebelo et al. 2010). A CAVE has the advantages of a large field-of-view,
freedom to look around, and a lack of intrusion from the interface (Cruz-Neira et al, 1992).
However, accurate depth perception is essential for ergonomics assessments and subjective
perceptions of distance have been reported to be less in virtual environments than those in
the real world (Klein et al., 2009; Renner et al., 2013). This has been attributed to differences
compositional factors (e.g. rich or sparse virtual environment, use of texture) and human
factors (e.g. experience with VR, sense of presence). Research to understand the impact of
these differences on applications of virtual environments is lacking (Renner et al., 2013).
Additionally, convergence/accommodation conflict can occur where visual objects in the
CAVE appear at a variety of stereoscopic depths despite being presented on the screen at
the same accommodation plane (Baitch and Smith, 2000). In addition to depth perception
issues, this conflict can lead to visual discomfort or simulator sickness (Chen et al., 2014;
[image:6.595.73.528.283.589.2]Häkkinen et al., 2006; IJsselsteijn et al., 2000).
Figure 2. CAVE 3D stereoscopic environment
The use of CAVEs has been analysed in a number of applications including driving
simulators (Kim et al, 2005; Mollenhauer et al, 2005) and other aspects of automotive
ergonomics including reach and visibility (Reuding & Meil, 2004). Reuding and Meil (2004)
conducted a study to investigate the reliability of the CAVE for in-vehicle reach and visual
design option A vs. design option B, due to differences in performance between the CAVE
and the real world.
While VR CAVEs are the subject of academic research (e.g. Juan & Perez, 2009; Repperger
et al., 2003; Whalstrom et al., 2010) little work has been done on their acceptability for entry
and exit work by automotive industry professionals. For entry and exit activities to occur in a
virtual world there must still be some hardware (e.g. steering wheel, pedals, and seat) as a
participant cannot achieve a driving position in free space. The use of this hardware poses
potential issues, such as depth perception differences between virtual and real objects as a
result of accommodation conflicts in which the accommodation of the virtual image is always
at the virtual display whereas accommodation of the physical object will be closer (Drascic
and Milgram, 1996). Hardware may also cause obscuration of the virtual world, issues due
to registration accuracy and accommodation errors, as found in previous research into the
use of haptic devices represented in virtual environments (Olsson et al., 2012). Even the
presence of the participant’s own body in the virtual environments can cause occlusion
issues (Bouguila et al., 2000), for example, the hand could obscure the virtual image of the
cant rail, but the cant rail cannot obscure the hand, as it obviously would in the real world.
Occlusion is considered by Drascic and Milgram (1996) as the strongest indicator of depth
because of its dominance over all other cues. That is, despite any ambiguity in the
environment, in the real world objects which are far away cannot obscure those which are
closer. The impact of these issues on the use of CAVEs for optimising entry and exit is
unknown. Finally, research in the field of virtual reality in automotive design has often
focussed on validity (e.g. Dymott et al, 2003; Lorenz et al., 2008), which is only one criterion
for the success of a measure (Wilson, 2005). Ergonomists have previously been criticised
for accepting a method too readily without considering its merits (Annett, 2000). Other
criteria include utility, resources and system stability (Reuding & Meil, 2004) which are
Importantly, the nature of the design process changes from concept to prototyping, therefore
it is likely that more than one method has use for optimising entry and exit. To the
knowledge of the authors, no work has analysed against a range of criteria, methods which
may have use for optimising ease of entry and exit, nor looked at which tools should be used
at different stages of the vehicle development process. Use of the methods is dependent
upon their acceptability to industry practitioners.
Objectives / research questions
To understand the utility of the CAVE for optimising vehicle entry and exit in
comparison to a real car and to a “buck” – the current industry standard
To investigate industrial practitioners’/stakeholders’ perceptions of methods for
optimising entry and exit
To identify when in the vehicle development process tools for optimising entry and
exit should be used.
2. Study 1: External validity of methods for studying entry and exit
As mentioned, little previous work has been conducted to investigate the utility of a CAVE for
optimising ease of entry and exit. Therefore, the first study aimed to compare the entry
experience of occupants using a CAVE 3D immersive stereoscopic environment with the
corresponding real production car. That is, study 1 aimed to determine if a virtual reality
CAVE is a valid tool for assessing ease of vehicle entry. Although the study focussed on
ease of entry, the authors believe that the issues raised in the ease of entry study should be
representative of both entry and exit.
As the current approach for optimising entry and exit within Jaguar Land Rover relies on
vehicle bucks, this condition was also included in the study as a second comparison to the
CAVE. While the buck is typically geometrically accurate to the design intent at the time of
plastic mouldings) – Figure 1. Thus, it was pertinent to assess the validity of both the CAVE
and the buck as tools for optimising ease of entry and exit.
It is known that people enter cars using a number of strategies but that individuals display
stability of strategy within a vehicle (Ait al Menceur et al, 2008; Johansson 2002; Rigel,
2005) and could change their strategy when entering a vehicle with a different geometry (Ait
al Menceur et al, 2008; Cherednichenko et al., 2006). This stability of strategy would
therefore be expected across a real car and a valid model of that car; i.e. CAVE or buck.
The stability of entry method was used as an indicator of tool validity. In fact, many other
measures (e.g. number of contact points) would be impossible to record consistently across
the three different properties, particularly as the visualisation of the CAVE is regenerated
based on the head position of the person wearing the tracked glasses and impact would
therefore not be visible to an observer.
It was hypothesised that the ingress strategy of each participant remains the same across
the physical vehicle and CAVE conditions for Car A, and the vehicle buck and CAVE
conditions for Car B, and that individuals’ ingress strategy remains the same within a
condition.
2.1 Method
2.1.1 Participants
A total of 20 participants (14 male, 6 female) were recruited from Jaguar Land Rover
employees. Participants held valid driving licences and were not directly involved in the
development of the cars being evaluated. Mean age was 26.9 (range 20-53, SD = 8.48).
Participant stature ranged from 1575 mm to1952 mm (mean = 1766 mm, SD = 105.4), mean
weight was 77.1kg (range 53.3-109.8kg, SD = 22.8).
2.1.2 Apparatus
Virtual Reality CAVE: The HoloVis 4K CAVE is a virtual reality facility, comprising a
space with three walls and a ceiling acting as screens on to which high resolution
images are projected (Figure 2). Within this environment the architecture of the car
is modelled with the addition of a physical seat and wheel. The seat is set at the
appropriate vehicle height to ground. Participants wear stereo glasses with head
trackers to see in 3D within the space. Representations of both a saloon car (Car A)
and an SUV –Sports Utility Vehicle (Car B) were created in the CAVE.
Physical buck: A buck is a physical model of a vehicle (Figure 1 shows a buck
similar to that used for this trial; the actual buck used in the trial is commercially
sensitive and therefore cannot be shown). While it is dimensionally accurate to
design intent to within a few millimetres, it is manufactured of materials that are not
representative of those in a car e.g. wood and foam. In this trial, a buck for the SUV
(Car B) was used.
Production car: A production car is a manufactured vehicle as offered for sale to the
public. The product version of Car A was used in this trial.
All properties were left-hand drive to ensure consistency across conditions.
2.1.3 Procedure
Participants entered the driver’s seat of the vehicle in four conditions; two conditions for Car
A, (CAVE and a production car), and two conditions for Car B, (CAVE and physical buck).
The experimental design was chosen to reflect the extremes of car type produced by Jaguar
Land Rover. Unfortunately the SUV and saloon cars were not available in all conditions: real
car, CAVE & buck; however, as the stability of entry strategy was the chosen measure of
validity, this had minimal impact on the results.
Participants were first asked to set up the seat and steering wheel to their preferred driving
were videoed to enable post trial analysis. Each participant evaluated each of the four
conditions.
The study received approval from The University of Nottingham Faculty of Engineering
Ethics Committee.
2.2 Results
Post-trial postural analysis of the videos was undertaken to enable entry strategies to be
classified. Entry strategies are generally divided into foot first or hip first movements (Ait al
Menceur et al, 2008). To provide more detailed information entry strategies were classified
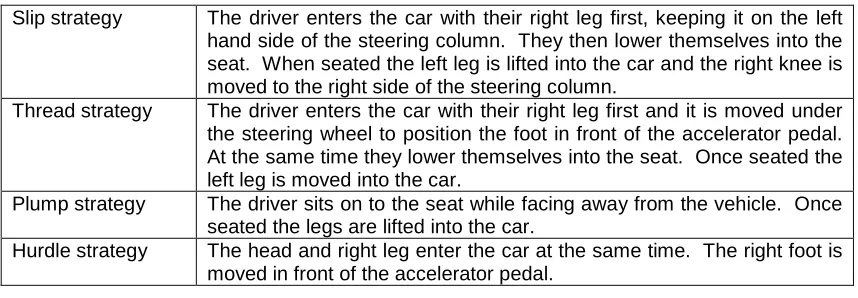
[image:11.595.66.495.376.525.2]into one of the four categories defined by Rigel (2005) and described in Table 1.
Table 1. Four strategies for entry (left-hand drive vehicles) (Rigel, 2005).
Slip strategy The driver enters the car with their right leg first, keeping it on the left hand side of the steering column. They then lower themselves into the seat. When seated the left leg is lifted into the car and the right knee is moved to the right side of the steering column.
Thread strategy The driver enters the car with their right leg first and it is moved under the steering wheel to position the foot in front of the accelerator pedal. At the same time they lower themselves into the seat. Once seated the left leg is moved into the car.
Plump strategy The driver sits on to the seat while facing away from the vehicle. Once seated the legs are lifted into the car.
Hurdle strategy The head and right leg enter the car at the same time. The right foot is moved in front of the accelerator pedal.
For both the production car and the physical buck the slip strategy was used by ninety
percent of participants, with the other ten percent using the thread strategy. While the slip
strategy was also the most common for the CAVE conditions, there was greater variation in
entry methods used as shown in Figure 3. In the CAVE condition for Car B (SUV), thirty
Figure 3. Number of participants adopting each entry strategy
To determine stability of the entry method a comparison was made of the strategies used in
the physical and virtual conditions.
Figure 4 Percentage of participants who exhibited stability in entry strategies in each condition.
0 2 4 6 8 10 12 14 16 18 20
Slip Thread Plump Hurdle Inconsistent
n
Entry strategy
Car A - Production Car Car A - CAVE
Car B - Physical buck Car B - CAVE
0 10 20 30 40 50 60 70 80 90 100 Production Car
CAVE Physical buck CAVE
St ra te gy St ab ili ty (% )
[image:12.595.115.478.478.695.2]Figure 4 shows that for both the Production Car A and Physical Buck Car B all of the
participants were consistent in their entry strategies, while in CAVE conditions for Car A and
Car B the majority were consistent (N=18). However while almost all were consistent within
each condition, the strategies used often changed between the physical conditions and
CAVE, with stability dropping to 60% and 55% for Cars A and B respectively as shown in
Figure 5. These results are indicative of a change in entry strategy stability between
[image:13.595.116.477.277.489.2]physical and virtual properties.
Figure 5 Percentage of participants who exhibited stability between the physical condition and CAVE for each vehicle.
2.3 Discussion
The stability of entry strategy within the physical vehicle, buck and virtual conditions shows
participants responded to the cues provided to them in each condition and entered the
vehicles accordingly. However, greater instability was seen across physical to virtual
properties. Thus, we can hypothesise that the cues in the virtual environment are not
representative of the cues on a physical vehicle and lead to a weaker understanding of the
vehicle geometry being assessed, and hence inconsistency in the approach adopted by the
participants.
0 10 20 30 40 50 60 70 80 90 100
Car A / CAVE Car B / CAVE
St
ra
te
gy
St
ab
ili
ty
(%
The high proportion of participants using the slip strategy supports the findings of Rigel
(2005), where 80% of 225 participants adopted this strategy. This is greater than the
percentages reported in comparable research. Ait al Menceur et al. (2008) classified the slip
strategy as one-foot ingress movement with lateral sliding. In their study 51% of the
participants adopted this strategy. This is due to the differences in participant samples.
While the present study and Rigel (2005) did not use older adults or those with prostheses,
they were included in the Ait al Menceur et al (2008) study and it was found that they were
more likely to use a two-feet strategy aligned to the plump strategy.
The increase in use of the hurdle strategy in the CAVE conditions may be understood with
reference to Rigel’s (2005) work. Rigel (2005) explained that one of the main factors
determining entry strategy is safety by avoidance of collision. Thus, participants in the
physical property often used the slip strategy to most effectively avoid a head collision with
the cant rail. In the virtual world, there was no risk of physical collision with the cant rail and
therefore participants could adopt the hurdle strategy without risk of physical impact. It may
also be that they wanted to look at the cant rail for as long as possibly in the virtual
environment, which would necessitate a head movement towards the cant rail (due to limited
field of view with the CAVE glasses) which in turn promoted the hurdle strategy. The
collision avoidance explanation is supported by the work of Arlt (1998) who found that with a
soft trim the safety distance during entry was less than with a harder trim.
3. Study 2: Interviews with JLR stakeholders
Study 1 provided data on the validity of the CAVE when designing for ease of entry and exit.
However, other aspects relate to the success of a method (Wilson, 2005), including
acceptance to stakeholders, in this case ergonomists and engineers responsible for
optimising the ease of entry and exit on future vehicles. In Study 2, a questionnaire was
designed and administered to understand stakeholders’ perceptions of methods for
i.e. face validity) to other practical aspects of using these methods in the automotive
industry, such as identifying and communicating issues, informing design, and the costs and
effort required to use each method. This information could only be obtained from
experienced professionals from within the automotive industry.
Study 2 included the end users’ views on the CAVE and buck properties evaluated in study
1, but also included other methods currently used or under consideration for use for
optimising entry and exit. This range of methods was chosen because Study 1 demonstrated
that the CAVE is unlikely to satisfy all entry and exit requirements if used as the sole design
method. Thus, other methods, and quite possibly a combination of methods, are most likely
to effectively optimise entry and exit. Given that each method requires some level of
resource to implement, there may also be savings through the strategic and timely use of
certain methods. Therefore, we also aimed to establish when in the vehicle development
process each method should be used.
3.1
Method
3.1.1
Participants
A total of 10 stakeholders (9 male, 1 female) were recruited from JLR, made up of
ergonomists and engineers. All stakeholders had some responsibility towards optimising
entry and exit, including; manage delivery of entry and exit targets for vehicle programmes;
setting entry and exit targets; entry and exit target validation and sign-off; responsibility for
vehicle package; and running user trials. Mean age was 38.9 (SD=6.9, range: 29-49).
Participants had a mean of 3.4 years in their current post (SD=2.1, range 1-8) and a mean of
13.1 years in the automotive industry (SD=11.9, range 1-34).
3.1.2 Materials
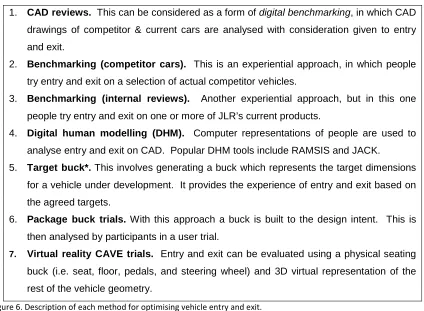
Definitions of entry and exit methods which were provided to participants are shown in
Figure 6. The methods were chosen based on current methods used, or methods under
1. CAD reviews. This can be considered as a form ofdigital benchmarking, in which CAD drawings of competitor & current cars are analysed with consideration given to entry and exit.
2. Benchmarking (competitor cars). This is an experiential approach, in which people
try entry and exit on a selection of actual competitor vehicles.
3. Benchmarking (internal reviews). Another experiential approach, but in this one
people try entry and exit on one or more of JLR’s current products.
4. Digital human modelling (DHM). Computer representations of people are used to
analyse entry and exit on CAD. Popular DHM tools include RAMSIS and JACK.
5. Target buck*.This involves generating a buck which represents the target dimensions
for a vehicle under development. It provides the experience of entry and exit based on the agreed targets.
6. Package buck trials.With this approach a buck is built to the design intent. This is
then analysed by participants in a user trial.
7. Virtual reality CAVE trials. Entry and exit can be evaluated using a physical seating
[image:16.595.81.505.67.378.2]buck (i.e. seat, floor, pedals, and steering wheel) and 3D virtual representation of the rest of the vehicle geometry.
Figure 6. Description of each method for optimising vehicle entry and exit.
* The term “buck” is well-understood within the automotive industry, and did not require further explanation.
A questionnaire was developed to elicit participants’ opinions towards the entry exit
methods. This required participants to rate the methods against the criteria shown in Figure
7. These were derived from established criteria on which to judge a human factors method
(e.g. Wilson, 2005) and also the purpose of entry and exit investigations within JLR.
Participants were also provided with space to make general comments about each of the
methods.
1. This method is useful for identifying entry and exit issues
2. This method is useful for communicating entry and exit issues to the project team
and to decision makers
3. This method is inexpensive to implement
4. This method is quick to implement
5. This method is easy to use / implement
6. This method has high validity (i.e. the results represent those obtainable from a
7. This method has high reliability (i.e. the results are repeatable)
8. This method can be used to inform the vehicle development process
Figure 7. Criteria against which each method was rated (on a 7-point Likert-style scale ranging from 1: strongly disagree to 7: strongly agree)
The second part of the questionnaire involved presenting participants with a list of the
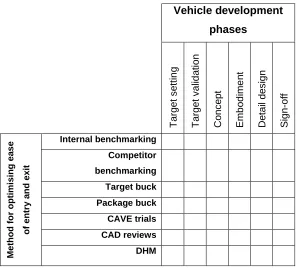
methods and various stages of the vehicle development cycle. This is shown in Figure 8.
The stages of the vehicle development cycle/activities overlap but are broadly sequential in
the order shown.
[image:17.595.150.447.291.559.2]Vehicle development phases T a rg e t s e tt in g T a rg e t v a lid a ti o n C o n c e p t E m b o d im e n t D e ta il d e s ig n S ig n -o ff M e th o d fo r o p ti m is in g e a s e o f e n tr y a n d e x it Internal benchmarking Competitor benchmarking Target buck Package buck CAVE trials CAD reviews DHM
Figure 8. Usage of methods for various phases of vehicle development
3.1.3 Procedure
Participants were welcomed, given the participant info sheet, asked if they had any
questions, and asked to complete demographics regarding their age, gender, current role,
time in role, time in the automotive industry and responsibilities towards entry and exit.
Thereafter, they were provided with the descriptions of each of the methods shown in Figure
6. The presentation order of the methods was determined through an incomplete balanced
Participants were then asked to complete the questionnaire described above. For each
method, they rated it against the criteria shown in Figure 7. They were also invited to make
comments to support their ratings.
Finally, they were asked to indicate for which vehicle development phases they thought each
method would be suitable, as shown in Figure 8. They were told that they could tick more
than one phase per method and that they did not have to tick any particular method for any
particular phase.
The study received approval from The University of Nottingham Faculty of Engineering
Ethics Committee.
[image:18.595.72.524.335.644.2]3.2 Results
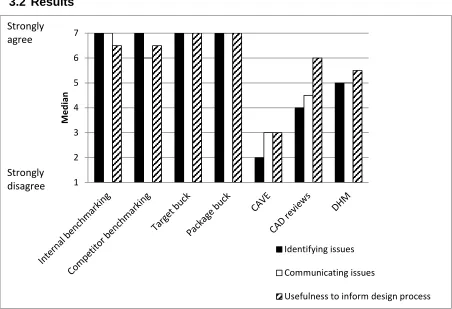
Figure 9. Median ratings for each of the seven methods for optimising ease of entry and exit. The ratings relate to aspects of the vehicle development process (identifying and communicating issues; informing the development process).
Median ratings for question 1, 2 and 8 are shown in Figure 9. These all relate to aspects of
the vehicle development process. Ratings for “identifying issues” showed significant 1
2 3 4 5 6 7
M
ed
ia
n
Identifying issues
Communicating issues
Usefulness to inform design process Strongly
differences between the methods (x2= 42.195, df=6, p<0.001). Post-hoc analysis was
conducted according to the mean rank differences methods described by Field (2009) based
on Siegel and Castellan (1988) which addresses the concerns of over-caution of Bonferroni
adjustment (Perneger, 1998). The post-hoc tests showed that the CAVE was perceived as
less able to identify entry and exit issues than the physical methods (Internal Benchmarking
ܴu-ܴv=3.55, Competitor Benchmarking ܴu-ܴv=3.95, Target buck ܴu-ܴv=3.90, and Package
buckܴu-ܴv=4.65; tested at p<0.05; critical difference=2.90). DHM was perceived as less
useful for identifying issues than the package buck (ܴu-ܴv=3.25). No other significant
differences were found, although the difference between CAD and the Package buck
approached significance (ܴu-ܴv=2.85).
A significant difference was found in the ratings for communicating issues (x2= 44.357, df=6,
p<0.001). The CAVE was perceived as less useful for communicating entry and exit issues
than the physical methods (Internal Benchmarkingܴu-ܴv=4.05, Competitor Benchmarking
ܴu-ܴv=3.10, Target buckܴu-ܴv=4.00, and Package buckܴu-ܴv=4.40; tested at p<0.05; critical
difference=2.90). CAD and DHM were also perceived as less useful for communicating
issues than the package buck (ܴu-ܴv=2.95 andܴu-ܴv=3.2, respectively).
Again, ratings for “usefulness to inform” differed significantly between methods (x2= 32.107,
df=6, p<0.001). The CAVE was perceived as less useful than three of the physical methods
(Competitor Benchmarkingܴu-ܴv=3.33, Target buckܴu-ܴv=3.67, and Package buckܴu
-ܴv=4.06; tested at p<0.05; critical difference=2.90). DHM was perceived as less useful for
informing the development process than the package buck (ܴu-ܴv=3.11).
Thus, the physical methods, in particular the Package buck, are particularly strong for
supporting the vehicle development process. CAD reviews and DHM may be useful during
dynamic indication of movement or without the experience of entry and exit. The CAVE was
consistently weaker than the physical methods for identify issues, communicating issues,
and informing the process, attributed to the lack of vehicle hard points (fixed physical
elements of the car) experienced when entering or exiting a representation of a vehicle in the
[image:20.595.74.524.220.520.2]CAVE.
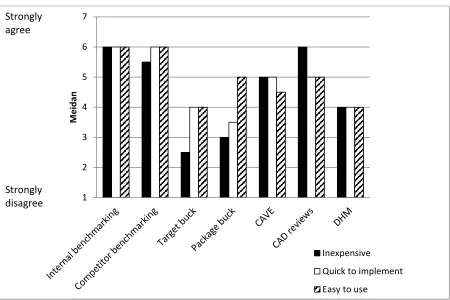
Figure 10. Median ratings for each of the seven methods for optimising ease of entry and exit. The ratings relate to logistics of implementing the methods. For clarity a higher rating is always more favourable (i.e. a median rating of 6 for “inexpensive” is cheaper than a median of 3).
The group of ratings in Figure 10 relate to questions associated with logistics of
implementing the methods. Ratings for “inexpensive” differed between the methods (x2=
32.371, df=6, p<0.005). The target buck was perceived as more expensive than internal
benchmarking (ܴu-ܴv=3.75), competitor benchmarking (ܴu-ܴv=3.15), or CAD reviews (ܴu
-ܴv=3.70). The package buck was perceived as more expensive than internal benchmarking
(ܴu-ܴv=3.25), and CAD reviews (ܴu-ܴv=3.20). 1
2 3 4 5 6 7
M
ei
da
n
Inexpensive Quick to implement Easy to use
Significant differences existed for “quick to implement” (x2= 23.296, df=6, p=0.001). The
post-hoc tests revealed that the only differences were that the target buck was less quick to
implement than internal benchmarking (ܴu-ܴv=3.167) and CAD reviews (ܴu-ܴv=3.278).
Differences also existed for “easy to use” (x2= 18.710, df=6, p=0.005). The only significant
post hoc difference was that competitor benchmarking is easier than DHM (ܴu-ܴv=3.167).
Participants’ comments supported these ratings, reporting that there is a cost and time
associated with building bucks; benchmarking and CAD reviews were perceived as cheaper.
[image:21.595.72.525.323.622.2]However, some concerns were raised about the availability of vehicles for benchmarking.
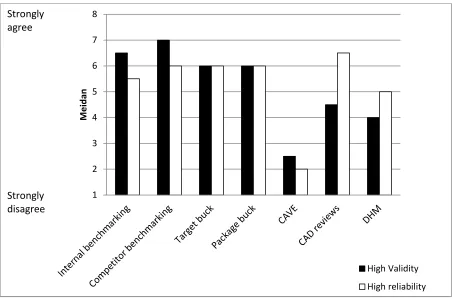
Figure 11. Median ratings for each of the seven methods for optimising ease of entry and exit. The ratings relate to the validity and reliability of the methods.
The ratings in Figure 11 relate to the validity and reliability of the methods. Validity differed
between the methods (x2= 30.460, df=6, p<0.001). The CAVE was perceived as less valid
than internal benchmarking (ܴu −ܴv=4.000), competitor benchmarking (ܴu-ܴv=4.111), and 1
2 3 4 5 6 7 8
M
ei
da
n
High Validity High reliability Strongly
the package buck (ܴu-ܴv=3.722). Competitor benchmarking was also perceived as more
valid than digital human modelling (ܴu-ܴv=2.944). Reliability also differed (x2= 21.505, df=6,
p=0.001). CAVE was perceived as less reliable than competitor benchmarking (ܴu
-ܴv=3.167), Package buck (ܴu-ܴv=3.556), and CAD (ܴu-ܴv=3.889).
Internal benchmarking, competitor benchmarking and the package buck were commented
on as valid methods for studying entry and exit, providing the selection of cars (or the buck)
represented the design intent. Participants mentioned that a robust method and skilled
operator is essential for reliable assessment with DHM. Concerns reported earlier about the
[image:22.595.70.526.346.593.2]inability of the CAVE to represent vehicle hard points also apply to its validity.
Figure 12. Number of times each method was deemed suitable for each activity (physical methods)
0 1 2 3 4 5 6 7 8 9
n Internal cars benchmarking
Competitor benchmarking Target buck
Figure 13. Number of times each method was deemed suitable for each activity (digital/combination methods)
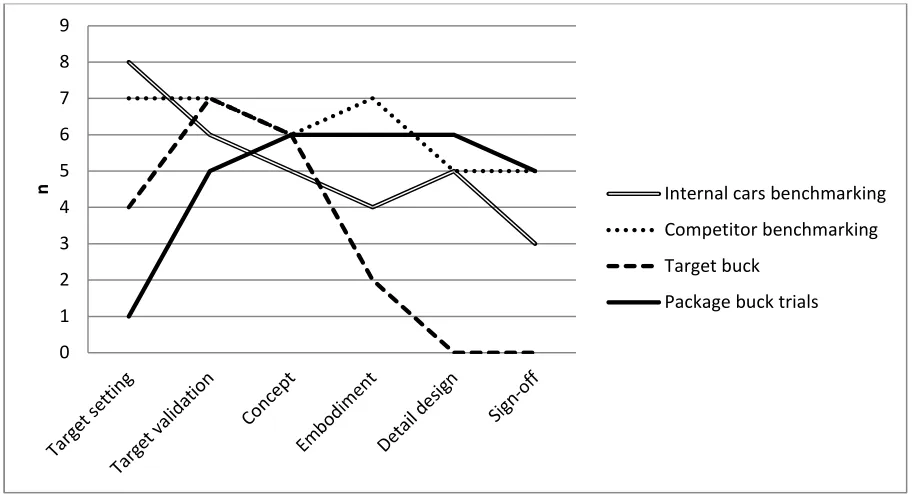
Figures 12 (physical methods) and 13 (digital/combination methods) show the number of
participants who thought that each method would be suitable for use at various stages of the
vehicle development.
Cochran’s Q test showed significant differences between the data for target setting
(Q=18.955, df=6, p=0.004). As post hoc testing required 21 pairs of comparisons with
McNemar’s test, Bonferroni became highly conservative (0.05/21=0.0024), with no pairs
showing significance. Furthermore, the method used before for multiple comparisons does
not apply to dichotomous data. Therefore, it was decided that an appropriate compromise
between stringency and the risk of type 1 error would be to look for significance at p<0.01.
However, none of the individual tests demonstrated significance, with only the difference
between the Package buck and Internal benchmarking approaching significance (N=8;
p=0.016). 0 1 2 3 4 5 6 7 8 9
n
Target validation showed no significant differences between the methods (Q=6.316, df=6,
p=0.389). There was also no difference between use of the methods during the concept
phase (Q=2.118, df=6, p=0.909).
There was a significant difference between the methods for the embodiment phase
(Q=18.769, df=6, p=0.005). The post hoc testing with McNemar’s test at p<0.01 showed
that the only difference approaching significance was between competitor benchmarking and
the CAVE (N=8, p=0.016).
Differences also existed at the detail design phase (Q=19.350, df=6, p=0.004). While none
of the post hoc comparisons with McNemar’s reached significance, the differences which
most closely approached significance were Target buck and package buck (N=8, p=0.031)
and Package buck and CAVE (N=8, p=0.031).
Differences were also seen between the methods for sign off (Q=12.769, df=6, p=0.047).
The post hoc comparisons which most closely approached significance was target buck and
package buck (N=8, p=0.063).
4 Discussion
This research has shown that while people are consistent in the entry strategies adopted in a
buck, a production car and a CAVE, they were inconsistent between a production car and a
CAVE, or buck and a CAVE. This difference suggests that the CAVE cannot currently
provide a valid indication of ease of entry, and thus should not be used in this way to support
design for ease of entry. As highlighted in the introduction, entry and exit are complex
interactions with the car, but entry is one of the first consumer experiences and it is
important that the design method used is valid to achieve this. Moreover, use of an invalid
available, particularly as entry and exit is reliant upon the fundamental geometry of the
vehicle package. Therefore, these changes are likely to be significant and costly.
Moreover, for optimising entry and exit, physical methods are generally perceived as being
better than digital methods by JLR stakeholders. That is, the physical methods are viewed
as being more reliable, have higher validity and are considered to be good at identifying and
communicating issues and useful to inform the design process.
However, physical methods also have issues – for example there is a time and cost
associated with building bucks which is less for the virtual methods. This time penalty of
physical bucks is in conflict with the industry aim to reduce development times. Thus, it is
understandable that there is motivation to make greater use of virtual technologies.
However, while the CAVE has great use in other applications in the vehicle development
process (e.g. all round vision, driving simulation) it is not appropriate in its current form for
experiential entry and exit analysis. The stakeholders’ primary concern with the CAVE was
lack of hard points. Thus, it may currently be limited to uses other than providing the
experience of entry exit from a customer’s perspective, for example design reviews of 3D
overlays of various A-pillars between vehicles. .
There may however be opportunities for developing the CAVE for use in entry exit analysis.
For example, the effect of graphics quality on distance perception has been recognised as
an open area requiring more research (Kenyon et al., 2007; Renner et al., 2013). Renner et
al. (2013) emphasise the importance of a virtual environment with a ground texture, as the
“compression” of texture at further distances can be an important cue (Renner et al., 2013).
Murgia and Sharkey (2009) found that the underestimation of depth was less in a rich virtual
environment with textured background surfaces. Similarly, Kenyon et al. (2007) found
improvements in size constancy (the ability to perceive objects of the same size at a variety
of distances) in richer virtual environments with surrounding objects providing depth cues.
participants’ ability to judge imminent contact between virtual objects. It may be that greater
use of cues such as these could improve depth perception in the CAVE. Bouguila et al.
(2000) found that providing force feedback helped improved depth perception in a
stereoscopic virtual environment. The force was implemented by strings from motors which
acted at certain depths, corresponding to virtual objects. Swapp et al. (2006) also
demonstrated improvements in spatial accuracy and spatial response tasks for a PC-based
co-located device with haptic feedback. Obviously these systems would need developing to
be suitable for entry and exit, but the same principle of combining visual and haptic feedback
may be worth investigation, particularly to address the lack of hard points in the CAVE.
However, none of the above will address issues of occlusion; the virtual components will
appear behind the physical components regardless of their distance from the viewer in the
real world. An alternative approach might be to consider different mixed reality systems
such as a see-through head-mounted display (HMD) (e.g. Rolland and Hua, 2005). Gao et
al. (2012) report developments on a light-weight occlusion-capable HMD system, but the
suitability of this for entry and exit would need testing as HMD systems have been reported
to cause ergonomics issues (Nichols, 1999) and even the use of a light-weight device may
influence the entry or exit task. Moreover, depth perception issues have been reported in
augmented reality systems (Singh et al., 2010) and HMDs tend to have limited field of view
(Zhou, 2008), which is likely to influence the entry and exit tasks.
As mentioned, physical bucks are not without fault; this study corresponded with the
previously established time and cost penalty associated with physical prototypes (Laughery,
2005) and therefore any method which reduces this is worthy of investigation. DHM may
offer some value within the development process, but the stakeholders were generally more
positive about experiential methods as they were deemed to be more capable in identifying
issues, communicating issues, and informing the process, attributed to their vehicle hard
property, as the seating buck evaluated was very obviously a buck; it did not have the level
of trim or finish of a production car. Thus, it may be that the ideal method combines the
flexibility to quickly review, and modify, several designs afforded by virtual prototyping with
the actual experience and hardware provided by physical bucks. For example, in recent
years many developments have been made in rapid prototyping. As the costs of these
reduce, and the capability to prototype large-scale products increases, it may be possible to
prototype design intent nearly immediately.
It must be recognised that the stakeholders in this study were limited to one automotive
company. Thus, their perceptions may be influenced by company policy or the availability
and use of methods within that organisation. Related to this, participants were less familiar
with DHM than the other methods. Therefore, their perceptions of this method should be
treated with caution.
A possible limitation of study 1 is the use of left hand drive properties which would be less
familiar to the participants than the more commonly used right hand drive in the UK. As an
international company, left hand drive is the norm for engineering development and bucks at
Jaguar Land Rover, and employees are familiar with left hand drive properties. While right
hand drive properties would have been preferable, a right hand drive buck was not available,
and it was considered that consistency was of greater importance hence the use of left hand
drive throughout.
5 Recommendations
Based on the findings of this study, we are able to create recommendations for the use of
tools in the automotive design process for entry and exit development and validation by
vehicle development stage.
There is no single tool that has a high level of acceptability at each stage of the vehicle
Figure 14 Tool availability and use in the Vehicle Development Process
The following tools are therefore recommended at these stages of the vehicle development
process:
Target setting - Benchmarking of internal cars and competitors, supported by CAD
reviews. Training and experience is required for assessing CAD images.
Target validation - The target buck and competitor benchmarking supported by the
package buck. The target buck must be accurate in order to be effective.
Concept – A combination of all the tools, with the exception of the CAVE. For DHM
to be effective training and experience is required.
Embodiment – Competitor benchmarking and package buck, supported by CAD
Detail design - The package buck supported by benchmarking of internal and
competitor vehicles.
Sign-off - package buck trials backed with a competitor vehicle for comparison
purposes.
The CAVE is not currently recommended for use in assessment of entry and exit. However,
future developments of a virtual environment that include physical cues or physical feedback
may address these issues. Further research work is needed in this area.
6. Conclusions
This study has shown that a physical representation of a design (a buck) can yield consistent
and valid entry strategies, which were not observed in a CAVE 3D immersive environment.
This was attributed to the lack of physical geometry in the CAVE which is present in bucks
and in real cars. Industry stakeholders from an automotive company also rated the CAVE
worse than physical methods for identifying entry and exit issues, and having lower
perceived validity and reliability than physical methods. The digital methods were in general
weaker for communicating issues, indicating the importance of the experience of entry and
exit for supporting the design process. However, there is a time and cost associated with
building bucks. To best optimise entry and exit various combinations of methods are
required at different stages of the vehicle development process. While the CAVE has
proven use in other applications (e.g. driving simulators, exterior vision) it requires
development before it can be used to provide the customer experience of entry and exit.
Acknowledgments
The authors would like to acknowledge Brian Waterfield of the Jaguar Land Rover Virtual
References
Ait El Menceur, M. O., Pudlo, P., Gorce, P., Thevenon, A., & Lepoutre, F. 2008. Alternative movement identification in the automobile ingress and egress for young and elderly population with or without prostheses.International journal of industrial ergonomics,38, 1078-1087.
Andreoni , G., Rabuffetti, M., & Pedotti, A. 2004. Kinematics of head movements while entering and exiting a car.Ergonomics,47(3), 343-359.
Annett, J. 2002. A note on the validity and reliability of ergonomics methods. Theoretical Issues in Ergonomics Science,3(2), 228-232.
Arlt, F 1998. Untersuchung zielgerichteter Bewegungen zur Simulation mit einem CAD-Menschmodell. Dissertation, Lehrstuhl für Ergonomie, Technische Universität München, Munich.
Baitch, L & Smith, R.C. 2000. Physiological correlates of spatial perceptual discordance in a virtual environment. In: Proceedings of the Fourth International Projection Technology Workshop, Ames, Iowa, 2000.
Bernard, A.,Daaboul, J., Laroche, F., and Cunha, D. 2012. Mass Customisation as a Competitive Factor for Sustainability.Enabling Manufacturing Competitiveness and Economic Sustainability2012, Part 1, 18-25.
Bhise, V. D. 2011.Ergonomics in the automotive design process.Boca Raton: CRC Press.
Bouguila, L., Ishii, M., Sato, M. 2000 Effect of coupling haptics and stereopsis on depth perception in virtual environment. Proceedings of the 1st Workshop on Haptic Human Computer Interaction. 31st August – 1stSeptember 2000.
Causse, J., Wang, X., & Denninger, L. 2012. An experimental investigation on the requirement of roof height and sill width for car ingress and egress.Ergonomics, 55(12), 1596-1611.
Chateauroux, E., & Wang, X., 2010. Car egress analysis of younger and older drivers for motion simulation.Applied Ergonomics, 42, 169-177.
Chen, J., Zhou, J., Sun, J. 2013. Visual discomfort induced by adjustment of convergence distance in stereoscopic video. In: Broadband Multimedia Systems and broadcasting (BMSB) IEEE, London, 5-7 June 2013, pp 1-5.
Cherednichenko, A., Assman, E., & Bubb, H. 2006. Computational approach for entry simulation.SAE Technical Paper Series.2006-01-2358.
Drascic, D., and Milgram, P. 1996. Perceptual Issues in Augmented Reality. Proceedings of SPIE Vol. 2653. Stereoscopic Displays and Virtual Reality Systems III, San Jose, California, Feb 1996,pp 123-134.
Dufour, F., & Wang, X. 2005. Discomfort assessments of car ingress/egress motions using the concept of neutral movement.SAE Technical Paper Series.2005-01-2706.
Dymott, R., Janes, B., Harker, S., Scheuchenpflug, R., Ruspa, C., and Quattrocolo, S. 2003. Older drivers in Virtual Reality assessment of vehicle ergonomics. In: D de Waard, K.A. Brookhuis, S.M. Sommer, W.B. Verwey (Eds) Human Factors in the Age of Virtual Reality. Maastricht, the Netherlands: Shaker Publishing.
Field, A. 2009.Discovering Statistics Using SPSS(3rdEd). London: SAGE publications.
Gao, C., Lin, Y., & Hua, H. 2012. Occlusion Capable Optical See-through Head-Mounted Display Using Freeform Optics.In: Mixed and Augmented Reality (ISMAR) IEEE, 5-8 Nov 2012, Atlanta GA, 281-282.
Gransitzki K., 1994. Biomechanics of entering a car.Second International Congress on Physiological Anthropology, University of Kiel, Germany, September 12-16.
Häkkinen, J., Pölönen, M., Takatalo, J., Nyman, G. 2006. Simulator sickness in virtual display gaming: a comparison of stereoscopic and non-stereoscopic situations.MobileHCI’06,ACM, Helsinki, Finland, September 12-15.
Hanson, L., Blome, M., Dukic, T., Ho, D., Berg, G. 2006. Guide and documentation system to support digital human modelling applications. International Journal of Industrial Ergonomics, 36, 17-24.
Herriotts, P. & Johnson, P. 2013. Are you sitting comfortably? A guide to occupant packaging in automotive design. In N.Gikkas (ed). Automotive Ergonomics: Driver-Vehicle Interaction (p. 17-39). Boca Raton: CRC Press.
Herriotts, P. 2005. Identification of vehicle design requirements for older drivers.Applied Ergonomics, 36 (3), 255-262.
Hu, H.H., Gooch, A.A., Thompson, W.B., Smits, B.E., Riser, J.J., Shirley, P. 2000. Visual cues for imminent object contact in realistic virtual environments. Proceedings IEEE Visualization, October 2000, 179-185.
Jayaram, S., Vance, J., Gadh, R., Jayaram, U., Srinivasan, H. 2001. Assessment of VR technology and its applications to engineering problems. Journal of Computing and Information Sciences in Engineering, 1(2001), 72-83.
Johansson, L. 2002. Car ingress and egress: verification and evaluation of dimensions relevant for ergonomic comfort. MSc Thesis, Lulea University of Technology, Sweden.
Juan M.C., & Perez, D. 2009. Comparison of the levels of presence and anxiety in an acrophobic environment viewed via HMD or CAVE.Presence, 18(3), 232-248.
Kawachi, K., Aoki, K., Mochimaru, M., and Kouchi, M. 2005. Visualization and Classification of Strategy for Entering Car.SAE Technical Paper. 2005-01-2683.
Kenyon, R.V., Sandin, D., Smith, R.C., Pawlicki, R., Defanti, T. 2007. Size-Constancy in the CAVE. Presence, 16(2), 172-187.
Kim, J., Matsui, Y., Hayakawa, S., Suzuki, T., Okuma, S., & Tsuchida, N. 2005. Acquisition and Modeling of Driving Skills by Using Three Dimensional Driving Simulator.IEICE TRANSACTIONS on Fundamentals of Electronics, Communications and Computer Sciences (E88-A) 3, 770-778.
Klein, E., Swan, J.E., Schmidt, G.S., Livingston, M.A., Staadt, O. 2009. Measurement Protocols for Medium-Field Distance Perception in Large-Screen Immersive Displays. IEEE Virtual Reality 2009, 14-18 March, Lafayette, Louisiana, USA.
Koester, D. and Hamilton, R. 1994. A Methodology for Evaluating Barriers and Aids to Vehicle Ingress/Egress.SAE Technical Paper940388, 1994, doi:10.4271/940388.
Laughery, R. 2005. Simulation and modelling for analysing human performance. In: J.R. Wilson, and N. Corlett, (Eds.),Evaluation of Human Work.3rd ed. London: Taylor & Francis, 219-238.
Lorenz, S., Kaiser, R., Assmann, E., Engstler, F., Zollner, R. 2008. Mixed reality for use in ergonomic car design: effect of different procedures on the seating position. Ergonomieabsicherung im Fahrzeug mittels Mixed Reality,2008(62), 3-14.
Mollenhauer, M.A., Romano, R.A., and Brumm, B. 2004. The Evaluation of a Motion Base Driving Simulator in a CAVE at TACOM,24th Army Science Conference, Orlando, Florida, December, 2004.
Monnier, G., Renard, F., Chameroy, A., Wang, X. & Trasbot, J., 2006. A motion simulation approach integrated into a design engineering process. SAE International. Digital Human Modeling for Design and Engineering Conference. Lyon, France July 4-6, 2006.
Nichols, S. 1999. Physical ergonomics of virtual environment use. Applied Ergonomics 30(1999), 79-90.
Olsson, P., Nysjo, F., Seipel, S. Carlbom, I. 2012. Physically co-located haptic interaction with 3D displays.IEEE Haptics Symposium 2012, Vancouver, BC, Canada March 4-7, 2012.
Perneger, T.V. 1998. What’s wrong with Bonferroni adjustments. British Medical Journal, 216(7139),
1236-1238
Pudlo, P., Lempereur, M., Lepoutre, F., & Gorce, P 2006. Prediction of the car entering motion. SAE Technical Paper Series.2006-01-2357.
Rebelo, F., Duarte, E., Noriega, P., & Soares, M. M. 2010. Virtual Reality in Consumer Product Design: Methods and Applications. In: Karwowski, W., Soares, M. M., Stanton, N. A. Ed. Human Factors and Ergonomics in Consumer Product Design: Methods and Techniques.pp. 381-402. Boca Raton: CRC Press.
Reed, M. P., & Huang, S. 2008. Modelling vehicle ingress and egress using the human motion simulation framework.SAE Technical Paper Series.2008-01-1896.
Renner, R.S., Velichkovsky, B.M., Helmert, J.R. 2013. The Perception of Egocentric Distances in Virtual Environments – A Review. ACM Computing Surveys, 46(2), pp. 23:1-23:40
Repperger D.W., Gilkey, R.H., Greeen, R., LaFleur, T., Haas, M.W. 2003. Effects of haptic feedback and turbulence on landing performance using an immersive cave automatic virtual environment (CAVE).Perceptual and motion skills, 3(1), 820-832.
Reuding, T., & Meil, P. 2004. Predictive Value of Assessing Vehicle Interior Design Ergonomics in a Virtual Environment. Journal of computing and information science in engineering, 4,109-113.
Rigel, S. 2005. Entwicklung und Validierung einer Methode zur quantitativen Untersuchung der Ein-und Ausstiegsbewegung in einen Pkw.Dissertation Technischen Universität München.
Roland, J., & Hua, H. Head-mounted displays. 2005. Encyclopedia of Optical Engineering (2005), 1-13.
Schrader K. Remlinger, W. Meier, M. 2002. Mixed Reality with RAMSIS. Presented at SAE Digital Human Modeling Conference. München 2002.
Seron, F. J., Gutierrez, D., Magallon, J. A., Sobreviela, E. J., & Gutierrez, J. A. 2004. A CAVE-like environment as a tool for full-size train design.Virtual Reality, 7(2), 82-93.
Siegel, S., and Castellan, N.J. 1988. Nonparametric statistics for the behavioral sciences(2nd Ed.). New York, NY:McGraw-Hill.
Singh, G., Swan II, J.E., Jones, J.A., Ellis, S.R. (2010). Depth judgement measure and occluding surfaces in near-field augmented reality. Proceedings of ACM SIGGRAPH applied Perception in Graphics and Visualization (APGV2010), 149-156.
Sternini, D. and Cerrone, M. 1995. Set-up of an experimental procedure for measuring the human body movements when entering and exiting the vehicle, in L. Francione (ed.), Proceedings of Third International Conference on Vehicle Comfort and Ergonomics, pp 257-265. Bologna: Associazione Tecnica dell’Automobile.
Swapp, D., Pawar, V., Losco, C. 2006. Interaction with co-located haptic feedback in virtual reality. Virtual Reality,(2006), 10, 24-30.
Tetlock, P.E. 1983. Accountability and the perseverance of first impressions. Social Psychology Quarterly, 46, 285-292.
Wang, G.G. 2002. Definition and Review of Virtual Prototyping. ASME Journal of Computing and Information Science in Engineering, 2 (3), pp. 232-236.
Whalstrom, M., Aittala, M., Kotilainen, H., Yli-Karhu, T., Porkka, J., Nykanen, E. 2010. CAVE for collaborative patient room design.Virtual Reality,14(3), 197-211.
Wilson, J. R. 2005. Methods in the understanding of human factors. In: J.R. Wilson, and N. Corlett, (Eds.),Evaluation of Human Work.3rd ed. London: Taylor & Francis, 1-31.
Zhan, J. Porter, M. M, Polgar, J. & Vrkljan, B. 2013. Older drivers’ opinions of criteria that inform the cars they buy: A focus group study.Accident analysis & prevention,281-287.
Zhou, F., Duh, H.B.L., & Billinghurst, M. 2008.Trends in augmented reality tracking, interaction and display: A review of ten years of ISMAR. In: Proceedings of the 7th IEEE/ACM International