Collimated fast electron beam generation in critical density plasma
T. Iwawaki, H. Habara, S. Baton, K. Morita, J. Fuchs, S. Chen, M. Nakatsutsumi, C. Rousseaux, F. Filippi, W.
Nazarov, and K. A. Tanaka
Citation: Physics of Plasmas (1994-present) 21, 113103 (2014); doi: 10.1063/1.4900868
View online: http://dx.doi.org/10.1063/1.4900868
View Table of Contents: http://scitation.aip.org/content/aip/journal/pop/21/11?ver=pdfcov
Published by the AIP Publishing
Articles you may be interested in
Effects of nanosecond-scale prepulse on generation of high-energy protons in target normal sheath acceleration Appl. Phys. Lett. 102, 224101 (2013); 10.1063/1.4809522
Hot-electron generation from laser–pre-plasma interactions in cone-guided fast ignition Phys. Plasmas 20, 052706 (2013); 10.1063/1.4807040
Generation of very low energy-spread electron beams using low-intensity laser pulses in a low-density plasma Phys. Plasmas 18, 033109 (2011); 10.1063/1.3569825
Density effects on collimation of energetic electron beams driven by two intense laser pulses Phys. Plasmas 16, 043106 (2009); 10.1063/1.3112706
Collimated fast electron beam generation in critical density plasma
T. Iwawaki,1,a)H. Habara,1S. Baton,2K. Morita,1J. Fuchs,2S. Chen,2M. Nakatsutsumi,2,3 C. Rousseaux,4F. Filippi,5W. Nazarov,6and K. A. Tanaka1
1
Graduate School of Engineering, Osaka University, 2-1, Yamada-oka, Suita, Osaka 565-0871, Japan
2
LULI, CNRS-Ecole Polytechnique-Universite Pierre et Marie Curie-CEA, 91128 Palaiseau, France 3
European X-Ray Free-Electron Laser Facility (XFEL) GmbH, Germany
4
CEA, DAM, DIF, F-91297 Arpajon, France
5
La SAPIENZA, University of Rome, Dip. SBAI, 00161 Rome, Italy
6
School of Chemistry, University of St. Andrews, North Haugh, St. Andrews, Fife KY16 9ST, Scotland, United Kingdom
(Received 4 July 2014; accepted 14 October 2014; published online 7 November 2014)
Significantly collimated fast electron beam with a divergence angle 10(FWHM) is observed when an ultra-intense laser pulse (I¼1014W/cm2, 300 fs) irradiates a uniform critical density plasma. The uniform plasma is created through the ionization of an ultra-low density (5 mg/c.c.) plastic foam by X-ray burst from the interaction of intense laser (I¼1014W/cm2, 600 ps) with a thin Cu foil. 2D Particle-In-Cell (PIC) simulation well reproduces the collimated electron beam with a strong mag-netic field in the region of the laser pulse propagation. To understand the physical mechanism of the collimation, we calculate energetic electron motion in the magnetic field obtained from the 2D PIC simulation. As the results, the strong magnetic field (300 MG) collimates electrons with energy over a few MeV. This collimation mechanism may attract attention in many applications such as electron acceleration, electron microscope and fast ignition of laser fusion.VC 2014 AIP Publishing LLC.
[http://dx.doi.org/10.1063/1.4900868]
I. INTRODUCTION
In the frame of the fast ignition (FI) scheme of inertial confinement fusion,1several methods have been proposed to heat the core plasma by an external source.2Direct heating method (super-penetration) is one such method owing to the simple target and laser geometry.3 In this scheme, ultra-intense laser pulse (UILP) irradiates an imploded plasma directly and propagates into the corona region with relativis-tic self-focusing (RSF). When the UILP reaches crirelativis-tical den-sity surface, relativistic induced transparency (RIT) allows the pulse to propagate as a single channel up to critical4or 10 times critical density.5 In the end, the laser energy is transferred to electrons at the critical or overcritical density interface.5In our previous work, the emission divergence of fast electron beam has been found significantly narrower (33(FWHM)) than that obtained at the plain foil target (66(FWHM)) when the UILP penetrated into several tens lm overdense plasma.6However, the understanding of phys-ical mechanism has been left as an issue.
This motivated us to investigate the characteristics of the fast electron generated around critical density plasmas in detail in well characterized experimental platform. For this purpose, we create homogeneous critical density plasma inside a small capillary tube filled with ultra low-density plastic foam. The foam is heated by X-ray burst produced by irradiating a thin Cu foil with an ns infrared laser pulse. The plasma density profile is estimated by a 1D hydro-radiative simulation as well as 2D X-ray radiography measurement that show creation of homogeneous critical density plasma over several hundred microns inside the tube.7 When an
UILP (1019W/cm2) irradiates the plasma, energetic electron beam is created via JB heating, B-loop acceleration, and betatron resonance acceleration.8–10 The spatial distribution of the generated electron beam emitted from the tube toward the laser direction is observed with an imaging plate (IP) stack. The beam divergence of fast electrons is 1162 (FWHM), i.e., around a quarter of the one (4566 (FWHM)) measured in the case of the standard foil target. This significant narrow divergence is also observed in 2D Particle-In-Cell (PIC) simulation. To understand the physical mechanism of the collimation, we calculated the motion of electrons that follows Lorentz force using magnetic field obtained from 2D PIC calculation. It is found that the struc-ture of magnetic field associated with the laser propagation in critical density plasma strongly collimates strongly fast electrons that with energy over a few MeV.
II. PRODUCTION OF ULTRA-LOW DENSITY FOAMS
In-situ polymerisation is a method of moulding foams to desired shape and inside hollow metallic or plastic compo-nents of laser targets. Production of ultra-low density foams inside targets eliminates handling of fragile low density foams. The diameter and depth of the targets, the aspect ra-tio, and also the design of the target is crucial and predomi-nantly dictates the methods used for their synthesis. The formation of in-situ foams in laser targets involves filling and polymerisation step; depending on the target aspect ra-tio, the correct acrylate monomer/mixture of monomers are dissolved in a suitable solvent and using a micro needle injected inside the target cavity. The solution is then illumi-nated with correct wavelength of UV light appropriate to the monomers utilized. The solution inside the target cavity gels
a)
iwawaki-t@eie.eng.osaka-u.ac.jp
within seconds and targets containing the wet gel are then transferred to correct solvent for exchange. Finally the target containing the wet foam is transferred to a critical point dryer, and using liquid CO2as critical solvent the wet gels
are dried. As a consequence of these steps, some components of the targets are fixed after the foam filling process to mini-mize the damage to the final target.
III. EXPERIMENTAL RESULT
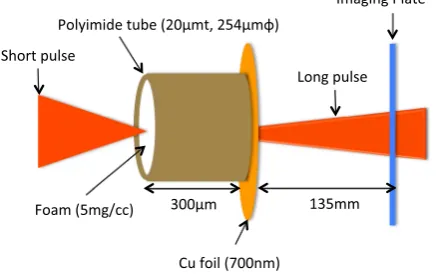
The experiment was performed at the ELFIE facility at LULI,Ecole Polytechnique using two laser beams. The ex- perimental setup is shown in Fig. 1. The target consists of polyimide tube, ultra-low density foam and thin Cu foil. The wall thickness, the length, and the inside diameter of the pol-yimide tube are 20lm, 300lm, and 254lm, respectively. The plastic (C15H20O6) foam is filled in the tube with the
ultra-low density of 5 mg/cc that corresponds to the critical density of 1021/cc when the foam is ionized. The thin Cu foil (0.7lm thick) is attached to one side of the tube for produc-tion of X-ray burst to ionize the foam material.7X-rays are created by irradiation of the Cu foil with an infrared (k¼1.057lm) laser pulse (60 J/600 ps) at focused intensity of 1014W/cm2. The plasma density and temperature have been estimated by the 1D hydro-radiative simulation, CHIC.11 In addition, we have measured the density of the solid and ionized foam by performing 2D X-ray radiography. The source was a burst of KaX-rays produced by irradiating a 20lm glass wire with a high intensity short pulse laser. The spectrum of X-rays was predominantly KaX-rays from non-ionized silicon atoms at 1.74 keV; this was confirmed using step filters and post-processing of the data. The X-ray absorption in the cold foam matched the transmission prop-erties as tabulated in CXRO.12As for the ionized foam in the temperature range that we were expecting (20–40 eV), the transmission data showed that the electron density of the ion-ized foam was 1021/c.c. 600–800 ps after irradiation of the heating beam. Since the nano structures of the foam may dis-appear after the time (¼10 ps) given by the ratio of the nano scale divided by the sound speed, the plasma within the tube should be rather uniform at this timing. This analysis was
performed with the aid of the code FLYCHK.13This X- ray absorption technique is rather insensitive to the range of tem-peratures of 10–40 eV, whereas the transmission depends more on the electron density, hence we are convinced that the desired density was achieved in the heating process.14
The UILP is then focused on the surface of the critical density plasma from the open side of the tube (from the left in Fig.1) after the foam becomes the expected density. The laser wavelength is 1.057lm with 300 fs time duration. The laser is focused with anf/3 off-axis parabola to a 10lm di-ameter spot producing an intensity of 1019W/cm2 in vac-uum. The pointing accuracy is at least one tenth or smaller than the diameter of the entire foam plasma. The emission pattern of electron beam from the target is detected by a SR IP set at 135 mm behind the target.15,16 This IP is covered with a 7lm thick Al foil to protect the IP from laser light. Electrons with energies over 25 keV can be detected through the Al foil based on the continuous-slowing-down approxi-mation (CSDA) range calculation.17 A thin Al foil target is also used for comparison. The Al target is 20lm thick with 1 mm1 mm square. Through the experiment, the short pulse is kept at normal incidence. Typical experimental results of electron beam divergence on IP are shown in Fig.
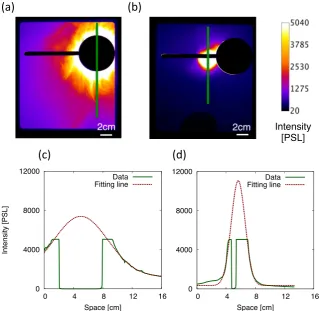
2. Figs. 2(a) and2(b) indicate the fast electron divergence for the Al foil and the tube target, respectively. The black circle and line in each figure correspond to the entrance of the long pulse beam to the target and the entrance to a detec-tor (not presented in the paper), respectively. In order to observe the electron beam as emitted from the target but avoiding the overlap with the black circle, the tube target was tilted in the horizontal plane with respect to the short and long pulse beam axis by 7. It is clearly shown that the electron beam from the tube target is significantly colli-mated compared to that obtained from the Al foil target. Green solid lines in Figs.2(c)and2(d)indicate line profiles of the green lines in Figs. 2(a) and 2(b), respectively. Red dashed lines in Figs.2(c)and2(d)show the results of fitting the line profile (green solid line) using Gaussian fitting. Considering the fitting results and the experiment setup, the divergence angle from the foil target is 4566 (FWHM), consistent with past studies.6,18,19 On the other hand, the angle from the tube target is only 1162(FWHM), around quarter in comparison to the foil target case.
Although IP is sensitive also to X-rays and protons, fast electron signal is predominantly recorded in these patterns. As to the signal in the foil target, there is a uniform back-ground (1000 PSL). This may come from X-rays. The pro-ton divergence was separately measured to be 35 (FWHM) for 1.7 MeV and is narrower than the observed divergence. Thus, the signal in Fig.2(a)is considered to be fast electrons. As to the signal in the tube target, the contribution from X-rays should be smaller than the foil due to the low target Z number (Z¼3.7) and can be neglected. Protons are mainly accelerated in the radial direction based on the PIC in Ref.
[image:3.607.63.282.580.717.2]10. Our PIC simulation (the details are given in Sec. IV) indicates also similar large divergence and the signal inten-sity on the IP from protons could be 20 times smaller than that from electrons.16,20,21Thus, the narrow divergence sig-nal is due to fast electrons.
FIG. 1. Experimental setup. A long (600 ps) pulse laser irradiates a thin Cu foil (0.7lm) to generate X-ray burst that ionizes the entire foam target to create uniform critical density plasma. An UILP comes from the left side for producing a plasma channel in the plasma.
IV. PIC SIMULATION
In order to understand the experimental results, we con-ducted 2D PIC simulations (FISCOF (Refs. 22–25)) using the experimental configurations. The electron density of the tube target is set to be the critical density. The vertical size and the thickness of the critical density plasma are 140lm and 60lm, respectively. The target thickness is shorter than the actual target due to the calculation capacity. Since the laser channeling is observed in this simulation up to 40lm in depth, this simulation setup can model the experiment. Preformed plasma is also attached on the surface and the density exponentially decays to 0.1Ncwith the scale length of 2lm referring to the CHIC calculation. This preformed plasma is necessary to represent the plasma expansion due to the X-rays flash created by the long pulse laser beam. On the other hand, the electron density of the foil target is set to be 10 Nc. This electron density is lower than the actual target due to the calculation capacity. Though the relativistic criti-cal density (cNc¼3.4 Nc) is lower than the target density, this simulation setup can model the interaction in the over-dense plasma. The vertical size and the thickness of the plasma are 70lm and 1lm, respectively. Preformed plasma is also attached with a 1lm scale length from 5.0 to 0.1Nc. The temporal distribution of the incident laser intensity is a Gaussian with 300 fs (FWHM) pulse duration. The maxi-mum intensity is set to be 31019W/cm2with the spot size of 10lm. The pulse is injected at 5lm in front of the foot of preformed plasma. Fast electrons are observed at 10lm from rear surface of the plasmas. Figure3(a)shows the angu-lar distributions of fast electrons (>25 keV) for both plasma cases from the simulation. The red solid and green dotted
lines indicate the cases of the critical density plasma and the foil, respectively. Fast electrons from the critical density plasma have a small divergence angle of 12 (FWHM) from laser axis. Within this angle, 48% of the total fast electron energy is confined. Comparatively, the electron beam from the foil target shows a large divergence of an angle 25 (FWHM). There is some difference on the divergence angle of the foil between the experiment and PIC. This difference could be due to the scale length of the preplasma used in the PIC (1 lm).26,27 Longer preplasma will produce electrons with a larger divergence due to Weibel instability growth. Figure3(b)shows the electron energy spectra for both target cases from the simulation. The red solid and green dotted lines also indicate the cases of the critical density plasma and the foil, respectively. Here, we note that the most elec-trons carried energies of over 1 MeV, namely, 90% for the critical density plasma and 83% for the foil.
In this simulation, we observed also protons created in the critical density plasma. The cut off energy, average energy and divergence angle are 5 MeV, 0.5 MeV, and 138 (FWHM), respectively. Assuming the conversion efficiency from laser to proton energy of 1% and using proton sensitiv-ity for IP,20,21signal intensity on the IP from protons are 20 times smaller than that from electrons.16
V. POST PROCESS ANALYSIS
[image:4.607.47.367.57.368.2]the magnetic field is known to function as an electron colli-mator28–30or scatterer.26,27Here, we explain the collimation mechanism as the result of the magnetic field.
A. Foil target
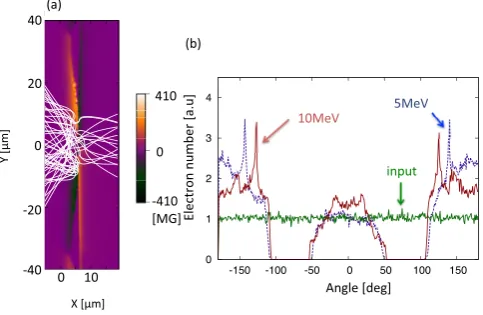
Figure4(a)shows typical magnetic field structure taken at the timing of 600 fs as calculated by the PIC code in Sec.IV. Here, the maximum laser intensity reaches the criti-cal density surface at 400 fs. The laser pulse propagates from the left toward x direction. The initial plasma location is 5lm<x<6lm and35lm<y<35lm with density of 10
Nc. The surface magnetic fields become enhanced through the positive feedback loop by surface propagation of fast electrons.31The strength of the fields on the target front sur-face reaches 400 MG and is higher than the one at behind the target.
Here, we introduce test electrons to understand how the magnetic field affects on the electron collimation using a uniform incident angular distribution as shown by the green solid line in Fig. 4(b). The motions of the electrons in this magnetic field are calculated using Lorentz force,
F¼ e(v3B). Initial source position of the test electrons is set at the critical surface with 10lm diameter taking into account of laser spot size. The tracks of 5 MeV electrons are shown by white lines in Fig.4(a). Most of electrons are reflected by the surface magnetic field to the backward and only a few electrons can pass through the target. Direction angles of the electrons are recorded when the electron passes the simulation boundaries as shown in Fig. 4(b)for the different electron energies. The electron numbers in each angle are normalized by the numbers of the input dis-tribution. When the electron energy is 5 MeV (blue dashed lines in Fig. 4(b)), the electron numbers in 20 20 is not so different from the input. However, the number drops for100 50and 50100, and increases for180 100 and 100 180. These trends are same also as 10 MeV electrons (red solid lines). Those electrons merge into the surface current that reinforce the strength of surface magnetic field as a positive feedback. On the other hand, in the case of 10 MeV electrons, forward electrons observed between 20 and 20 seem to increase because the elec-tron energy is high enough to break through the surface magnetic field. In addition, electron motion is concentrated to the forward by the rear magnetic field.
[image:5.607.48.411.56.226.2]Here, we introduce the parameter “Enhancement factor (EF)” to estimate this collimation effect. This value is defined as the maximum electron normalized by the input electron numbers between45 and 45. Namely, the mag-netic field works as a collimator when this value >1 and a reflector when <1. EF for 10 MeV electrons is 1.5 in Fig.4(b)compared to no increase for 5 MeV electrons. Thus, the collimation effect becomes significant for higher energy electrons. Figure5shows relation of EFs and magnetic field strength as a function of time. Red, blue, and green solid lines in Fig.5indicate the time development of the EFs for 0.5, 5, and 10 MeV electron energies, respectively. While each EF peaks at around 200–300 fs, the magnetic field strength peaks at 500 fs. Comparing these three solid lines, the collimation effect works until 300 fs especially to low energy electrons. However, the effect becomes weak after 300 fs especially for low energy electron with the develop-ment of magnetic field as shown black dashed line. Namely, after 300 fs, the collimation effect works only for high energy electrons (10 MeV). The strong magnetic field FIG. 3. Electron beam divergences (a) and spectra (b) that detected at the ob-servation line separated 10lm from the target rear surface in PIC simula-tion. The red solid line corresponds to the critical density plasma case and the green dotted line to the foil target case.
FIG. 4. (a) Typical structure (orange and back) of magnetic field induced by electron beam at 600 fs. The strength reaches as high as 400 MGauss. Electrons (5 MeV) are guided by the magnetic field (white lines). (b) Electron angular distribution detected at simulation boundaries. The hor-izontal axis is angle from the laser axis and the vertical axis is electron num-ber. Green line indicates the input distribution. Blue and red lines show the distribution of electrons for energies 5 MeV and 10 MeV.
[image:5.607.52.294.532.689.2]starts working as a reflector for low energy electron. The rea-son may be explained using the Larmor radius represented as
rL¼mec2
ffiffiffiffiffiffiffiffiffiffiffiffiffi
c21 p
=ðeBÞ. Here, me and c are the electron mass and the electron Lorenz factor. The radius becomes small when the magnetic field is strong and the electron energy is low. Here, the radiuses of 0.5 and 10 MeV electron in 300 MG magnetic field are 0.1 and 1.1lm, respectively. Therefore, if the electron energy is high enough, the electron breaks through the strong magnetic field region without cru-cial modification of the propagation direction. This post pro-cess analysis and PIC calculation in Fig. 3(b) support the large divergence of fast electrons for the case of foil target.
B. Critical density plasma
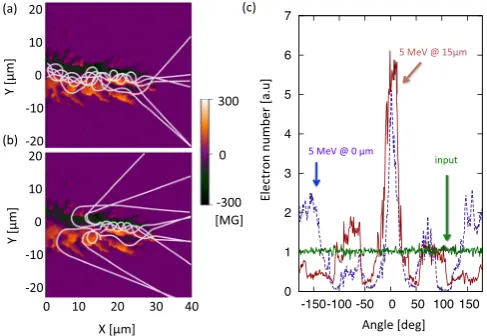
Next, electron motion in critical density plasma is calcu-lated by using the laser conditions same as the foil target. Figure 6(a) shows typical structure of the magnetic field taken at the timing of 600 fs calculated by PIC simulations in Sec. IV. The initial plasma location is 0lm<x<60lm and70lm<y<70lm with density ofNc. Here, the maxi-mum laser intensity reaches the critical density surface at 400 fs. This field is created by fast electron current propagat-ing into the plasma from the left to the right in the figure. The magnetic field is located in the region of the plasma channel. The return currents can cover the boundary and neutralize the outside magnetic field.32
Tracks of 5 MeV electrons are shown as white lines in Fig. 6(a). The input electron source position is set at
x¼0lm corresponding to entrance of the critical density plasma and at the y-axis same as the foil case. It is found that a number of electrons are bound around the field and propagate to forward direction rather different from the foil target case. The UILP penetrates inside the critical density plasma due to relativistic effect. The observed penetrated length is 40lm. Therefore, the electron source is not a point localized at the entrance but rather is elongated along the
plasma channel. Then, we consider different source posi-tion, for example, center of magnetic fields (x¼15 lm). Figure6(b)represents the same magnetic field as Fig.6(a). White lines in Fig.6(b)show the tracks of 5 MeV electrons assuming the source position at x¼15lm. In the results, backward electrons are pulled into the forward direction. A portion of these electrons is also bound around the field and propagates to the forward. Others escape from the field before arriving at the end of the magnetic field. These trends can be also seen in Fig. 6(c), which represents the angular distribution in the two cases corresponding to Figs.
6(a)and6(b). The green solid line shows the input source. The blue dashed line corresponds to the casex¼0lm, and the red solid one to the casex¼15lm. One can see that the forward current increases significantly and the backward current is smaller than that in the foil target. Backward elec-trons (180<H<130 or 130<H<180) increase to a level twice the input when the source position is set at the entrance of the field. However, in the case of middle source position, the backward peaks shift to smaller angles (100<H<50or 50<H<100) where the electrons can easily escape from the field. In addition, the forward electrons slightly increase.
[image:6.607.57.287.57.227.2]Figure7shows the temporal evolution of forward elec-trons for different electron energies and magnetic fields. The blue and purple solid lines indicate the EFs of 0.5 and 5 MeV electron from the source at x¼0lm, respectively. In addi-tion, the electron energy at x¼15lm is also shown by the red dotted line. Until 400 fs, each EFs exceed 1 and the lower energy (0.5 MeV) electrons appear to have a higher EF. On the contrary after 400 fs, the higher energy electrons have higher EF. EF of low energy electrons decreases to less FIG. 5. Time evolution of “EF” and surface magnetic field for Al solid foil
target. Red, blue, and green solid lines indicate the EFs for electron energies 0.5, 5, and 10 MeV, respectively. Black dashed line expresses the magnetic field strength. At the early time until 300 fs, every EF is larger than 1. After 300 fs, EFs decrease and become less than 1 at 600 fs except for the 10 MeV. The maximum laser intensity reaches the critical density surface at 400 fs.
[image:6.607.314.558.58.226.2]than 1 after 600 fs, whereas the EF of high energy electron is kept higher than 1. In case of critical density plasma, it is easy even for low energy electrons to enter the target because the surface magnetic field is weak (10 MG). Once the electrons enter the target, these electrons are trapped im-mediately by the magnetic field generated in the plasma channel. The maximum magnetic field in the plasma channel (black dashed line in Fig.7) reaches hundreds of MG result-ing in the Larmor radius less than 1lm and smaller than the size of magnetic field. In our estimation, 11% of the 0.5 MeV electrons are trapped in the field at 600 fs. In addi-tion, even if the electrons are bound around the field, it is dif-ficult to propagate along the field but rather escape at large angle. On the other hand, if the energy is high enough, the electron are bound around the field and propagate in forward direction with a good collimation even if the source position isx¼0lm (blue lines in Figs.6(c)and7). In fact, this effect becomes more prominent when the source is embedded in the field (red dotted line in Figs.6(c)and7). From the above observation, the magnetic field in the critical density plasma works as a collimator for the electrons that have energy over a few MeV.
Due to the sheath potential at the rear side of the target, electrons under the average energy or lower than the temper-ature (Te¼2.3 MeV in Fig.3(b)) may be trapped within the target.15,23 Therefore, the observed collimated fast electrons in Fig.2(b)are mainly the ones with energy larger than the average energy (in the plasma) collimated through the mag-netic field and escaped from the tube target.
VI. DISCUSSION
So far we have shown that the electron beam divergence is strongly related to both structure and strength of the mag-netic fields and electron energy. For the foil target, the sur-face magnetic field plays a dominant role on electron
divergence. For the critical density plasma, the surface field becomes minor compared to the field inside the plasma chan-nel. This magnetic field inside the channel makes electron collimation. Here, we assume the main part of electron beam is generated after the peak intensity reaches the target (after 400 fs). Then, in the foil target case, it can be assumed that high energy electron (10 MeV) can pass through the sur-face magnetic field easily and the collimation effect becomes effective as shown in Fig. 5. In the critical density plasma, the collimation effect becomes effective for over a few MeV electrons. The collimation in critical density plasma works much better than that in the foil target as shown in Figs. 5
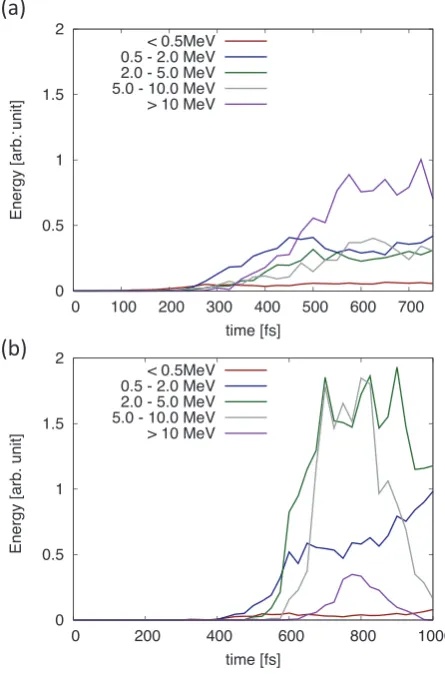
[image:7.607.60.282.56.217.2]and7. These trends are also explained by PIC simulations as shown in Fig. 8. Figure 8 shows the total electron energy observed in the simulation at the observation line indicating the electron flux in the forward direction for (a) the foil tar-get and (b) the critical density plasma, respectively. The energy is divided into five bands:<0.5, 0.52.0, 2.05.0, 5.010.0, and>10.0 MeV. In the case of foil target, only higher energy electrons tend to reach the observation line especially after 500 fs, while, in case of the critical density plasma, it is clear that even lower energy electrons can pass FIG. 7. Time dependence of EFs and the maximum strength of magnetic
field in the plasma. The purple and blue solid lines indicate the EFs with the source atx¼0lm for 0.5 and 5 MeV, respectively. The red dotted line also indicates EFs for the source set atx¼15lm and the energy at 5 MeV. The tendency of low energy electron represented by the purple line is same as Fig.5. The 5 MeV electron shown by the blue line indicates high collimation effect especially at 600 fs. When the source position is set atx¼15lm, the collimation effect works more efficiently. Black dashed line expresses the magnetic field strength. The maximum laser intensity reaches the critical density surface at 400 fs.
FIG. 8. Energy of electrons that pass through the observation line (forward direction) within per unit time. Red, blue, green, gray, and purple lines indi-cate different electron energy bands at<0.5, 0.52.0, 2.05.0, 5.0 10.0, and>10.0 MeV, respectively. The foil target case is shown by (a) and the critical density plasma case is shown by (b). In the foil target, only high energy electrons can pass through the target. On the other hand, in the criti-cal density plasma, over a few MeV electrons can be bound and propagate along the magnetic field region.
[image:7.607.322.545.343.680.2]through the line. The flux is more than several times this one obtained in foil target. These results can also explain the dif-ference of the electron beam behavior.
Based on the results given so far, it is possible to con-sider a case for the fast electron collimation in further over-dense plasmas. When the magnetic field in plasma channel is created by the forward going electrons, same argument can be applied in the over-dense region as the one in the critical density plasma, represented asB(r)¼(2p/c)enever. Here,ne,
ve, and r are background electron density, electron speed, and radius of the plasma channel, respectively. In case of this critical density plasma, the maximum strength of the magnetic field was 300 MG. Using the channel radius 5lm and the background electron densityNc, the electron speed in the channel is estimated to be 0.18 c. Assuming the same speed when the UILP with the wavelength 1lm penetrates 10 times critical density plasma with the diffraction limit (r¼0.5lm), the maximum strength of the magnetic field is also estimated to be 300 MG. This strong magnetic field could collimate significantly the fast electron beam.
VII. CONCLUSION
Significantly collimated fast electron beam (>25 keV) has been observed from the uniform and long critical density plasma irradiated with an ultra-intense laser pulse at 1019W/ cm2. The divergence was 11 (FWHM), much smaller than that the 45from the standard foil target. 2D PIC simulations for the two types of target indicated the same trend. Based on our post process analysis using magnetic fields taken from the 2D PIC simulations, it is possible to explain the experiment by considering the both structure and strength of the magnetic field. Therefore, we conclude that the ence of the electron beam divergence is caused by the differ-ence of the structure and strength of the magnetic field in the two targets. Similar magnetic field collimation has been observed in guiding cone wire target,28 target surface,31 re-sistivity controlled solid target29 and preformed magnetic field structure.30 However, a difference in our case is that strong magnetic fields are used for the collimation along the plasma channel in a critical and/or over-critical density. In addition, the generated electron beam has higher density and lower averaged energy compared to those from the wake field acceleration33,34and the surface waves acceleration35,36 where relatively low density plasma is used. There may be an attractive application of this collimation and high inten-sity electron beam over a few MeV electrons to the direct heating of high density core such as super-penetration mode in fast ignition.32,37
ACKNOWLEDGMENTS
The authors gratefully acknowledge the support of the staff of the ELFIE in the execution of this work (11-TW-F4). Moreover, we thank Professor H. Sakagami at National Institute for Fusion Science for his permission of use of 2D-PIC FISCOF code and Dr. P. Nicolai at Universite Bordeaux for conducting 1D CHIC hydro-radiative simulation. A part of this work was supported by Grants-in-Aid for Scientific Research, type A (Grant No. 22246122) and type B (Grant
No. 23360412) and JSPS Research Fellowship for young scientists (25 858), Cooperation toward Leadership in Innovative Creation (CLIC) Internship Program and X-ray free electron laser priority strategy program of MEXT (12005014 Osaka University).
1M. Tabak, J. Hammer, M. E. Glinsky, W. L. Kruer, S. C. Wilks, J.
Woodworth, E. Michael Campbell, M. D. Perry, and R. J. Mason,Phys. Plasmas1, 1626 (1994).
2R. Kodama, K. Mima, K. A. Tanaka, Y. Kitagawa, H. Fujita, K. Takahashi,
A. Sunahara, K. Fujita, H. Habara, T. Jitsuno, Y. Sentoku, T. Matsushita, T. Miyakoshi, N. Miyanaga, T. Norimatsu, H. Setoguchi, T. Sonomoto, M. Tanpo, Y. Toyama, and T. Yamanaka,Phys. Plasmas8, 2268 (2001).
3K. A. Tanaka, R. Kodama, H. Fujita, M. Heya, N. Izumi, Y. Kato, Y.
Kitagawa, K. Mima, N. Miyanaga, T. Norimatsu, A. Pukhov, A. Sunahara, K. Takahashi, M. Allen, H. Habara, T. Iwatani, T. Matusita, T. Miyakosi, M. Mori, H. Setoguchi, T. Sonomoto, M. Tanpo, S. Tohyama, H. Azuma, T. Kawasaki, T. Komeno, O. Maekawa, S. Matsuo, T. Shozaki, K. Suzuki, H. Yoshida, and T. Yamanaka, Phys. Plasmas7, 2014 (2000); K. A. Tanaka, M. M. Allen, A. Pukhov, R. Kodama, H. Fujita, Y. Kato, T. Kawasaki, Y. Kitagawa, K. Mima, N. Morio, H. Shiraga, M. Iwata, T. Miyakoshi, and T. Yamanaka, Phys. Rev. E 62, 2672 (2000); K. A. Tanaka, R. Kodama, Y. Kitagawa, K. Kondo, K. Mima, H. Azechi, Z. Chen, S. Fujioka, H. Fujita, T. Johzaki, A. Lei, T. Matsuoka, K. Mima, N. Miyanaga, K. Nagai, H. Nagatomo, H. Nishimura, T. Norimatsu, K. Shigemori, H. Shiraga, M. Tanpo, Y. Tohyama, T. Yabuuchi, J. Zheng, Y. Izawa, P. A. Norreys, R. Stephens, and S. Hatchett, Plasma Phys. Controlled Fusion46, B41–B49 (2004).
4
S. Ivancic, W. Theobald, D. Haberberger, D. H. Froula, K. S. Anderson, D. D. Meyerhofer, K. Tanaka, H. Habara, and T. Iwawaki, in Proceedings of the 55th Annual Meeting of the APS Division of Plasma Physics, Denver, CO, 11–15 November 2013.
5
A. L. Lei, A. Pukhov, R. Kodama, T. Yabuuchi, K. Adumi, K. Endo, R. R. Freeman, H. Habara, Y. Kitagawa, K. Kondo, G. R. Kumar, T. Matsuoka, K. Mima, H. Nagatomo, T. Norimatsu, O. Shorokhov, R. Snavely, X. Q. Yang, J. Zheng, and K. A. Tanaka,Phys. Rev. E76, 066403 (2007).
6
T. Tanimoto, A. L. Lei, T. Yabuuchi, H. Habara, K. Kondo, R. Kodama, K. Mima, and K. A. Tanaka,J. Phys.: Conf. Ser.112, 022095 (2008).
7R. J. Mason, R. A. Kopp, H. X. Vu, D. C. Wilson, S. R. Goldmanet al.,
Phys. Plasmas5, 211 (1998).
8
W. L. Kruer and K. Estabrook,Phys. Fluid28, 430 (1985).
9A. Pukhov and J. Meyer-ter-Vehn,Phys. Plasma5, 1880 (1998). 10A. Pukhov, Z.-M. Sheng, and J. Meyer-ter-Vehn,Phys. Plasma
6, 2847 (1999).
11
P. H. Maire, R. Abgrall, J. Breil, and J. Ovadia,SIAM J. Sci. Comput.29, 1781 (2007).
12B. L. Henke, E. M. Gullikson, and J. C. Davis,At. Data Nucl. Data Tables 54, 181–342 (1993).
13
H.-K. Chung, M. H. Chen, W. L. Morgan, Y. Ralchenko, and R. W. Lee,
High Energy Density Phys.1, 3–12 (2005).
14S. Chen, F. Filippi, J. Fuchs, S. Baton, M. Nakatsutsumi, C. Rousseaux, T.
Iwawaki, K. Morita, H. Habara, and K. A. Tanaka, “Density controlled plasma creation using ultra-low density plastic foam,” Phys. Plasmas (unpublished).
15
T. Yabuuchi, K. Adumi, H. Habara, R. Kodama, K. Kondo, T. Tanimoto, K. A. Tanaka, Y. Sentoku, T. Matsuoka, Z. L. Chen, M. Tampo, A. L. Lei, and K. Mima,Phys. Plasma14, 040706 (2007).
16
K. A. Tanaka, T. Yabuuchi, T. Sato, R. Kodama, Y. Kitagawa, T. Takahashi, T. Ikeda, Y. Honda, and S. Okuda,Rev. Sci. Instrum.76, 013507 (2005).
17See http://physics.nist.gov/PhysRefData/Star/Text/ESTAR.html for
ESTAR—National Institute of Standards and Technology, Physical Meas. Laboratory.
18
J. S. Green, V. M. Ovchinnikov, R. G. Evans, K. U. Akli, H. Azechi, F. N. Beg, C. Bellei, R. R. Freeman, H. Habara, R. Heathcote, M. H. Key, J. A. King, K. L. Lancaster, N. C. Lopes, T. Ma, A. J. MacKinnon, K. Markey, A. McPhee, Z. Najmudin, P. Nilson, R. Onofrei, R. Stephens, K. Takeda, K. A. Tanaka, W. Theobald, T. Tanimoto, J. Waugh, L. Van Woerkom, N. C. Woolsey, M. Zepf, J. R. Davies, and P. A. Norreys,Phys. Rev. Lett.
100, 015003 (2008).
19
Y. T. Li, J. Zhang, Z. M. Sheng, J. Zheng, Z. L. Chen, R. Kodama, T. Matsuoka, M. Tampo, K. A. Tanaka, T. Tsutsumi, and T. Yabuuchi,Phys. Rev. E69, 036405 (2004).
20T. Bonnet, M. Comet, D. Denis-Petit, F. Gobet, F. Hannachi, M. Tarisien, M.
21
J. F. Ziegler, Transport of Ions in matter (TRIM), See http:// www.srim.org.
22
H. Sakagami and K. Mima, in Proceedings of the 2nd International Conference on Inertial Fusion Sciences and Applications, Kyoto, 2001 (Elsevier, 2002), pp. 380–383.
23
H. Habara, K. Ohta, K. A. Tanaka, G. R. Kumar, M. Krishnamurthy, S. Kahaly, S. Mondal, M. K. Bhuyan, R. Rajeev, and J. Zheng,Phys. Rev. Lett.104, 055001 (2010).
24S. Inoue, S. Tokita, K. Otani, M. Hashida, M. Hata, H. Sakagami, T.
Taguchi, and S. Sakabe,Phys. Rev. Lett.109, 185001 (2012).
25
Y. Uematsu, S. Ivancic, T. Iwawaki, H. Habara, A. L. Lei, W. Theobald, and K. A. Tanaka,Rev. Sci. Instrum.85, 11E612 (2014).
26A. Debayle, J. J. Honrubia, E. d’Humie`res, and V. T. Tikhonchuk,Phys.
Rev. E82, 036405 (2010).
27
V. M. Ovchinnikov, D. W. Schumacher, M. McMahon, E. A. Chowdhury, C. D. Chen, A. Morace, and R. R. Freeman,Phys. Rev. Lett110, 065007 (2013).
28
R. Kodama, Y. Sentoku, Z. L. Chen, G. R. Kumar, S. P. Hatchett, Y. Toyama, T. E. Cowan, R. R. Freeman, J. Fuchs, Y. Izawa, M. H. Key, Y. Kitagawa, K. Kondo, T. Matsuoka, H. Nakamura, M. Nakatsutsumi, P. A. Norreys, T. Norimatsu, R. A. Snavely, R. B. Stephens, M. Tampo, K. A. Tanaka, and T. Yabuuchi,Nature432, 1005–1008 (2004).
29
S. Kar, A. P. L. Robinson, D. C. Carroll, O. Lundh, K. Markey, P. McKenna, P. Norreys, and M. Zepf,Phys. Rev. Lett.102, 055001 (2009).
30
R. H. H. Scott, C. Beaucourt, H.-P. Schlenvoigt, K. Markey, K. L. Lancaster, C. P. Ridgers, C. M. Brenner, J. Pasley, R. J. Gray, I. O. Musgrave, A. P. L. Robinson, K. Li, M. M. Notley, J. R. Davies, S. D. Baton, J. J. Santos, J.-L. Feugeas, Ph. Nicola€ı, G. Malka, V. T. Tikhonchuk, P. McKenna, D. Neely, S. J. Rose, and P. A. Norreys,Phys. Rev. Lett.109, 015001 (2012).
31
H. Habara, K. Adumi, T. Yabuuchi, T. Nakamura, Z. L. Chen, M. Kashihara, R. Kodama, K. Kondo, G. R. Kumar, L. A. Lei, T. Matsuoka, K. Mima, and K. A. Tanaka,Phys. Rev. Lett.97, 095004 (2006).
32
A. Pukhov and J. Meyer-ter-Vehn,Phys. Rev. Lett.76, 3975 (1996).
33
T. Tajima and J. M. Dawson,Phys. Rev. Lett.43, 267 (1979).
34N. Nakanii, K. Kondo, Y. Kuramitsu, Y. Mori, E. Miura, K. Tsuji, K.
Kimura, S. Fukumochi, M. Kashihara, T. Tanimoto, H. Nakamura, T. Ishikura, K. Takeda, M. Tampo, H. Takabe, R. Kodama, Y. Kitagawa, K. Mima, and K. A. Tanaka,Appl. Phys. Lett.93, 081501 (2008).
35N. Naseri, S. G. Bochkarev, and W. Rozmus,Phys. Plasmas17, 033107
(2010).
36
L. Willingale, P. M. Nilson, A. G. R. Thomas, J. Cobble, R. S. Craxton, A. Maksimchuk, P. A. Norreys, T. C. Sangster, R. H. H. Scott, C. Stoeckl, C. Zulick, and K. Krushelnick,Phys. Rev. Lett.106, 105002 (2011).
37T. Matsuoka, A. Lei, T. Yabuuchi, K. Adumi, J. Zheng, R. Kodama, K.
Sawai, K. Suzuki, Y. Kitagawa, T. Norimatsu, K. Nagai, H. Nagatomo, Y. Izawa, K. Mima, Y. Sentoku, and K. A. Tanaka,Plasma Phys. Controlled Fusion50, 105011 (2008).