ZIRCONIA-BASED ELECTROCERAMIC MATERIALS FOR
SOFC APPLICATIONS
Alan John Feighery
A Thesis Submitted for the Degree of PhD
at the
University of St Andrews
1999
Full metadata for this item is available in
St Andrews Research Repository
at:
http://research-repository.st-andrews.ac.uk/
Please use this identifier to cite or link to this item:
http://hdl.handle.net/10023/13601
‘Studies of possible solid oxide fuel cell anode materials
in the MgOiTiOicZrOa ternary system’
A thesis submitted for the degree of M.Phil.
John D.W. Sutherland
School of Chemistry, University of St. Andrews, The
Purdie Building, St. Andrews, Fife, KYI6 9ST.
January 1997
All rights reserved
INFORMATION TO ALL USERS
The quality of this reproduction is dependent upon the quality of the copy submitted.
In the unlikely event that the author did not send a com plete manuscript and there are missing pages, these will be noted. Also, if material had to be removed,
a note will indicate the deletion.
uest
ProQuest 10166332
Published by ProQuest LLO (2017). Copyright of the Dissertation is held by the Author.
All rights reserved.
This work is protected against unauthorized copying under Title 17, United States C ode Microform Edition © ProQuest LLO.
ProQuest LLO.
789 East Eisenhower Parkway P.Q. Box 1346
-t.
■ m
■ . m * • , . ■
- \ . . ^ 1 :
-■ i' :
C
I .-Tv;
i
•If.
► : Ë ' J .
4 '
4 ;■c
r / \
-:;rk
^ .■ r ■
' J '*
i m :
y _' --, T■ ■ ■ 10.-
■ JÏT
■1
i T!-■■■ . . . - h i '
■■ 4 À f
Contents
Section
Page number
Declaration
Acknowledgements Abstract
Key to abbreviations used in the thesis
Chapter 1; Introduction 1
1.1 Project Overview 1
1.2 The Chemistry of Zirconia 1
1.2.1 Aliovalent doping 5
1.3 The Chemistry of Magnesium Titanate 6
1.3.1 Introduction 6
1.3.2 The Structure of Magnesium Titanate Spinel
and its properties 7
1.4 An Introduction to the Chemsitry of Solid Oxide
Fuel Cells 9
1.4.1 Introduction 9
1.4.2 Choice of materials problem 10
1.4.3 Selection of materials for the electrolyte 11 1.4.4 Selection of materials for the cathode 11 1.4.5 Selection of interconnecting materials 12 1.4.6 Selection of materials for the anode 13
1.4.7 Cell Design and Fabrication 14
1.4.8 Summary 15
1.5 Mixed-conducting oxides 15
1.6 Phase diagrams 18
1.6.1 Introduction 18
1.6.2 Binary-phase diagrams 20
1.6.3 Ternary-phase diagrams 21
1.7 Conclusions 23
1.8 References
Chapter 2: Experimental 28
2.1 Structure of Chapter 28
2.2 Experimental Techniques 28
2.2.1 X-ray diffraction 28
2.2.2 Thermal analysis 30
2.2.3 A c. impedance spectroscopy 30
2.3.1 Synthesis and characterization of the Mg2Ti0 4
spinel phase 39
2.3.2 Synthesis of (ZrOz)x (Mg2Ti0 4)y samples 39
2.3.3 Synthesis of the (Zr02)x (MgO)y (7%)% samples
by the carbonate technique 40
2.3.4 Quenching techniques 41
2.5 References 41
Chapter 3: Results and Discussion 43
3.1 X-ray results 43
3.2 The Mg0:Ti02:Zr02 phase diagram 43
3.3 Queched samples 50
3.4 Annealing techniques 51
3.5 DTA analysis 51
3.6 A c. impedance results 54
3.7 References 55
Chapter 4: Conclusions 56
4.1 Conclusions 56
4.2 Suggestions for future work 58
4.3 References 59
Appendix 1:: ICroger-Vink notation
been composed by myself, that it is a record of my own work and that it
has not been accepted in partial or complete fulfilment of any other
professional qualification.
Signed
...
Date
I was admitted to the Faculty of Science of the University of st.
Andrews under Ordinance General 12 on 1st October 1995, and as a
candidate for the degree of M.Phil. on 1st October 1995.
Signed
...
Date...
I hereby certify that this candidate has fulfilled the conditions of the
Resolution and Regulations appropriate to the degree of M.PMi,
Signature of Supervisor
... Date
...
In submitting this thesis to the University of St. Andrews, I understand
that I am giving permission for it to be made available for use in
accordance with the Regulations of the University Library for the time
being in force, subject to any copyright vested in the work not being
affected thereby. I also understand that the title and abstract will be
published, and that a copy of the work may be made and supplied to any
Certain words have been abbreviated for convenience. The
following list shown below shows the abbreviation symbol used
and its expanded form.
Abbreviation
MzT
S
M l
I
M T2
P
ZT
O
Z(c)
C
T
M
Expanded form
Spinel
Spinel phase
Ihnenite
Ilmenite phase
Distorted pseudobrookite
Distorted pseudobrookite phase
Ortliorhombic
Orthorhombic phase
Cubic-fluorite
Cubic-fluorite phase
Tetragonal Zr
0 2phase
The MgOiTiOziZrO] ternary system was investigated as a possible novel anode material in a solid oxide fuel cell. Titanium-substituted yttria- stabilised zirconias have the necessary electrical conductivity properties for a ZrOz-based fluorite electrode but problems have been encountered such as a decrease in unit-cell size upon reduction leading to mechanical failure. By incoporating magnesium into the titanium-stabilised zirconia structure, it was thought that the cubic-fluorite structure might be stabilised.
A phase diagram study was made of the MgOiTiOz ZrOi temaiy system at 1500°C. Upon researching the literature phase diagram of the MgOiTiOiiZrOz system, it was found that the authors had not studied the single-phase region in the ZrOz-rich area extensively and did not use a consistent temperature for their analysis of samples. This has meant that the phase diagram has had to be reinvestigated. The results obtained at 1500°C are in disagreement with the previously published phase diagram. A large area bounded by single-phase cubic-fluorite was detected; however the central region of this domain contained both tetragonal and cubic-fluorite domains. This implies that for the central region of this phase area that the cubic- fluorite phase is not stable at 1500°C.
Selected stabilised cubic-fluorite samples with ~ 10 atom% Mg were annealed at I OOO^C after preparation at 1500°C and it was found that due to the presence of other phases present at 1000®C, that the cubic-fluorite phase is thermodynamically unstable at lower temperatures. DTA analysis revealed that as the titanium content in the cubic-fluorite solid-solution increased, the phase transition from tetragonal phase (+ MgO) to cubic-fluorite phase decreased. These results were used to provide a basis for a temperature phase diagram showing the likely phase transitions that occur at a particular temperature range.
Chapter 1
Introduction
In the search for new improved energy systems for the 21st century, the emphasis is on environmentally friendly, efficient means of energy conversion and storage. At the forefront of those technologies is the Solid Oxide Fuel Cell (SOFC) which it is hoped will find widespread application in the conversion of chemical to electrical energy.
In Solid Oxide Fuel Cells, the most important challenge facing today’s materials scientists is the selection of materials for the fuel electrode. In this thesis, a study was made of the Mg0 :Ti0 2:Zr0 2 phase diagram with a view to
obtaining single phase pure cubic-fluorite samples. These samples would then be tested with respect to their suitability as an anode material for a Solid Oxide Fuel Cell by means of experiments such as Ac-impedance spectroscopy and thermal analysis (TGA-DTA).
Cubic O
Figure
LU Structures of the monoclinic, tetragonal and
cubic
5.156 A a = #5.094 A, A = 5.124 A b= 5.191 A c = 5.177 A .
G= 5.304 A P = 98.9“
Table LI : Crystallographic data for the three polymorphs of
zirconia
At room temperature, zirconia exists in the monoclinic form and undergoes a martensitic transformation at 1170®C to form the tetragonal structure. Further heating to above 2370®C causes the tetragonal structure to undergo a tranformation to the cubic-fluorite structured
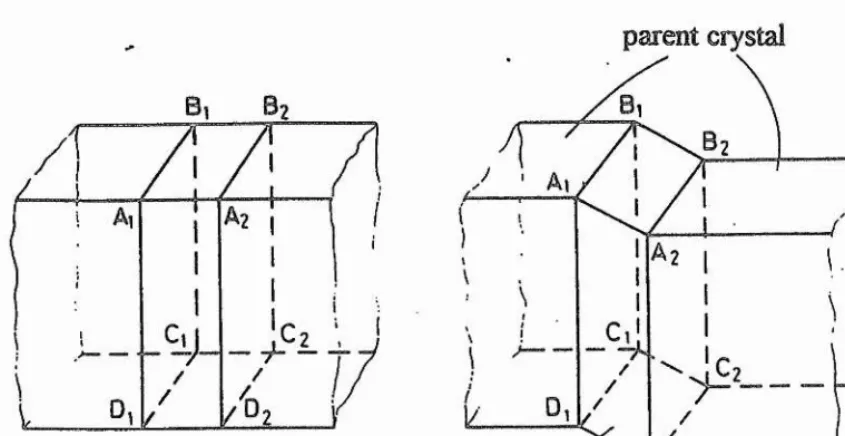
The martensitic transformation of monoclinic to tetragonal Z1O2 is one
of the most studied transformations in a non-metallic system^. Martensitic transformations occur by a shearing mechanism to give plates of product within the parent crystal (Figure 1.2). At the parènt-product interfaces AiBiCiDi and A2B2C2D2, the structures match well and there is a orientation
relationship between the crystal structures of the two phases. As the parent and product phases have the same composition and closely related crystal structures there is no need for activation energy to support diffusion as only very small atomic displacements of about less than one bond-length are required to support the transformation. Transformation rates are often independent of temperature but may be subject to applied stresses and strains.
parent crystal
(a)
product
^ 2 [image:14.613.67.490.76.294.2](b)
Figure
1 .2Formation of a martensite plate within a parent
crystal
100
COOL T—^ M , 8 0
z 6 0
HEAT
1 —o T
1200
600 800 C 1 0 0 0
temperatures and the percentage transformation within that range does not change with time as long as the temperature remains constant. If the temperature is changed, the new ‘equilibrium’ state is reached extremely rapidly.
The tetragonal phase of zirconia was first determined by Teufer\ It consists of a distorted fluorite structure which is characterized by an 8-fold co-ordination of zirconium atoms and two completely different sets of Zr-0 distances which are 2.445Â and 2.065Â, respectively^. For tetragonal zirconia, with P42/nmc symmetry, the zirconium and oxygen ions are at the following sites:
Atom Position Fractional Co-ordinates
Zr 2: (a) (0,0,0)
0 4 (d) (0, ^ Z ) 0, z)
(0, H H+z) (H 0,
Tetragonal zirconia has been obtained at room temperature but its formation is dependent upon crystallite size and cooling regime; crystallite sizes of less than 30nm or rapid cooling are required*. Tetragonal stabilised zirconia is commonly obtained from the preparation of zirconia by ‘wet’ chemical processing routes such as sol-gef, where crystallites of diameter between 10-20nm have been obtained.
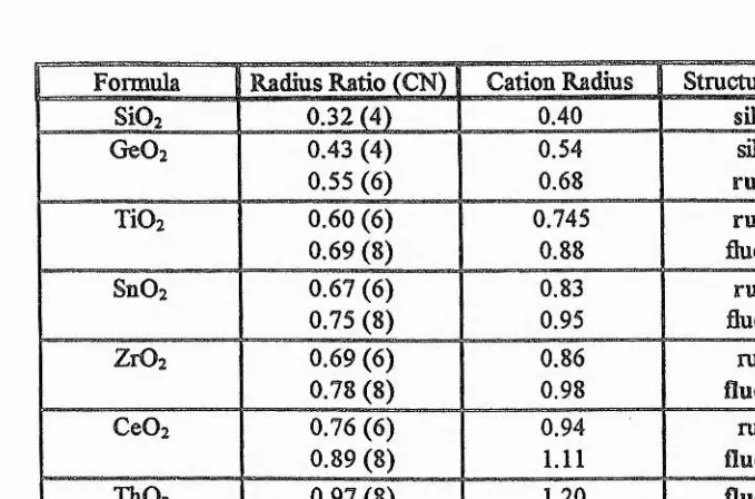
The instability of the cubic stabilised zirconia structure at room temperature is rather unusual when compared to other M^"p2 and M'* " 0 2
This unusual behaviour can be explained by the radius ratio (rcatîonfranion) as described by Pauling. Ionic compounds with the general formula MX2 are
expected to have one of three structure types, depending upon their co ordination number; silica (CN=4), rutile (CN=6) and fluorite (CN=8). A minimum radius ratio of 0.732 is required for the structure to have the fluorite structure with CN=8, whereas a minimum of 0.414 is expected for the rutile structure^ with CN=6. Some examples of and M'*"02 compounds, along with their radius ratio, co-ordination number, cation ratio and structure type commonly observed are shown in Table 1.2 , based upon the ionic radii data provided by Shannon and Prewitt*®, R(0^')=1.24Â, R(f-)=1 .17Â.
For compounds with a radius ratio close to unity, the fluorite structure is observed with CN=8. Examples of compounds which have the fluorite structure include CeO:, Th02, CdF2 and CaF2. The radius ratio for zirconia
with a co-ordination number of 8 is just larger than the minimum value of 0.732; whereas with a co-ordination number of 6, it is significantly larger than a MX2 compound which has the rutile structure (e.g. Ti02). Such a borderline
situation suggests that the zirconium ions are slightly too small to sit in an eight-fold site which would provide the cubic-fluorite structure but too large for an octahedral six-fold site. So, a compromise is made with zirconium having a co-ordination number of 7; producing monoclinic symmetry. In addition to a co-ordination number of 7, the Zr-0 bond lengths are quite different, with 3 average values of 2.07Â and 4 average Zr-0 distances of 2.17Â.
GeOz 0.43 (4) 0.54 silica
0.55 (6) 0.68 r utile
TiOi 0.60 (6) 0.745 rutile
0.69 (8) 0.88 fluorite
SnOz 0.67 (6) 0.83 rutile
0.75 (8) 0.95 fluorite
ZrO; 0.69 (6) 0.86 rutile
0.78 (8) 0.98 fluorite
CeOz 0.76 (6) 0.94 rutile
0.89 (8) 1.11 fluorite
ThOz 0.97 (8) 1.20 fluorite
CdFa 0.98 (8) 1.21 fluorite
CaF: 1.08 (8) 1.26 fluorite
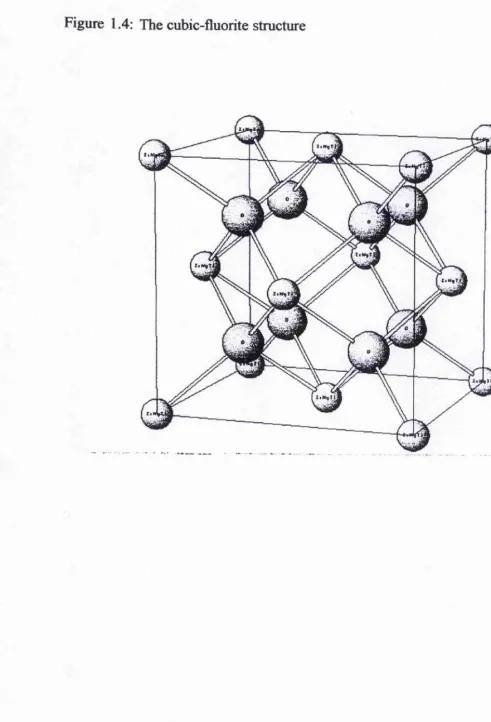
[image:17.628.138.516.236.485.2]The cubic fluorite structure is shown in Figure 1.4,It consists of a close packed array of zirconium ions with oxygen occupying all the tetrahedral sites. In the fluorite structure, with Fm3„, symmetry, the zirconium and oxygen ions are located at the following sites:
Atom Position Fractional co-ordinates
Zr 4 (a) 0 0 0
0 8 (c)
+(000, OHH)
1.2.1 AHovalent dopfog
It is possible for zirconia to undergo solid solution formation with MgO, CaO, Y2O3 and rare earth oxides**. By introducing aliovalent dopants
such as Mg^^, Ca^^ and into the zirconia, the tetragonal and cubic polymorphs of zirconia can be stabilised at room temperature. Such a stabilisation involves the substitution of an aliovalent cation for zirconium, with an corresponding introduction of oxygen vacancies as the charge compensating species. This substitution reaction is shown in equations 1 and 2, using the Kroger-Vink notation (Appendix 1) for and M^"*" respectively. The introduction of oxygen vacancies leads to oxide-ion conductivity in doped zirconia due to the decrease in co-ordination number.
MO -5 2 a _ , M „" + V„” + O, Equation 1
M
2O
32M„ + V.“ + 30„*
Equation 2
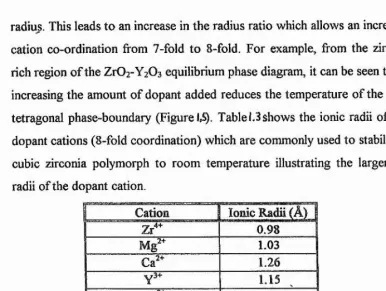
radius. This leads to an increase in the radius ratio which allows an increase in cation co-ordination from 7-fold to 8-fold. For example, from the zirconia- rich region of the Zr0 2-Y2 0 3 equilibrium phase diagram, it can be seen that by
increasing the amount of dopant added reduces the temperature of the cubic- tetragonal phase-boundary (Figure Table 1.3 shows the ionic radii of some dopant cations (8-fold coordination) which are commonly used to stabilise the cubic zirconia polymorph to room temperature illustrating the larger ionic radii of the dopant cation.
Cation Ionic Radii
(A)
z/"
0.981.03 1.26
1 1.15
1.20 .
I
Ce"*Ill ...J
Table 1.3 ; Ionic radii of some dopant cations which could be used to stabilise ZrOz The stabilisation of cubic and tetragonal polymorphs of zirconia is possible by the addition of larger tetravalent ions like Ce"*^ again illustrating the stabilising effect of increasing the radius ratio through doping.
One of the most extensively studied stabilised-zirconia systems is the binary Zr0 2-Y2 0s phase system*^’*'* due to its wide range of properties
obtained with different solid solution compositions and heat treatments. Other stabilised-zirconia systems such as the Mg0 :Ti0 2 :Zr0 2 phase system have not
been as extensively studied, but show promise for further investigation.
1.3 The Chemistry of Magnesium Titanate
1,3.1 Introductioû
[image:20.612.93.479.67.358.2]2500
T
Cub
2000
1500
ss
1000
500
Mon.
ss
[image:21.616.108.464.132.477.2]ZrO
Figure
i-S:
Phase diagram of the zirconia rich region of the Z
1O
2-Y
2O
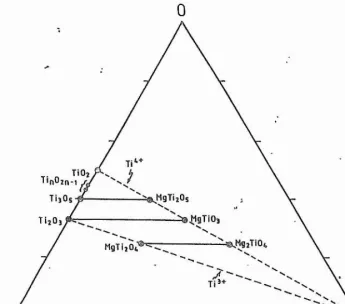
3pseudo-brookiîe (Tij0 5“MgTi2O5X the spinel (MgTi204-Mg2Ti04X the
coîTundum-ilmenite (Ti2 0 3-MgTi0 )) and rocksalt (MgO-TiO) structures
(Figure !.(>). More recent investigations have revealed solid solution formation in the spinel^^'^\ ilmenite’^'^* and pseudobrookite systems’^. Such systems are thought to exhibit high electrical conductivity at low oxygen partial pressures, thus making them possible candidates for insertion into an anode of a solid oxide fuel cell. In this section, discussion is restricted to the spinel structure and its interesting properties.
1.3.2 The Structure of Magnesium Titanate Spinel and its properties
Magnesium titanate (Mg2Ti0 4) is known to exist in the inverse spinel
form. Spinels take their name from the mineral MgAl2 0 4 whose structure was
first determined by Bragg^° and Nishikawa^\ The spinel structure (Figure 1,7) has the general formula AB2O4 in which A and B can be from a wide variety of cations.
In the spinel structure, the anions form a face-centred cubic lattice with 64 tetrahedral ‘A’ sites and 32 ‘B' octahedral sites, of which only 8 and 16 respectively are occupied*^. This enables us to write a general formula for the spinel structure as A^“'B2“'^0 4. In the case of MgAJ204, the Mg^"" ions are
present in the tetrahedral sites with the .Aj*“ ions in the octahedral sites.
Inverse spinels, of which Mg2Ti0 4 is an example, exist where the A ions
and half the B ions interchange positions to give B“'*[AB]°''0 4. The spinels
MnFe2 0 4 and MgPe2 0 4 are known as intermediate spinels as their cation
arrangements lie between the extremes of normal and inverse spinels.
TiOj/
iî»
[image:23.616.81.427.37.341.2] [image:23.616.59.417.417.758.2]TiO
MgO
Figure Phase relationships in the M gO-TiO-0 system
1 / 0 . 5 / 0
3 /0 .7 /0
3 /0 .7 /8
o r i g i n
3/0.7/O 1/0.5/8
VO, 5 /0 ^ 3 /0 .7 /
- - - - (T)
V 0.7/O
1 /8 .5 /0
. 5 /0 3/O .7/0 V O .5 /0
@
1 /O .i/fl 3 / 0 .7 / ^
I
I
r
3 /0 .7 /B
1 /0 .5 /0
®
~^K0 ^ 9 o ,
Figure ).l
The spinel structure
Atom Position Fractional coordinates
O 32e u rn ; ü m ; uSû; ûtnl '
^ ^ — M, ^ — m; 1 -f a, 1 - a, ^ -f- m;
+ face centring
9 I6d iJLl.122.2A2.2Il.8 8 * * 8 * 8 ' 888' 8 8 8 ' + face centring
A 8a 0 0 0 : ^ 4 - face centring
(where A and B represent different cations)
Much work has been carried out on the reduced magnesium titanate spinel solid solution (MgTi2 0 4-Mg2Ti0 4) as it exhibits superconductivity at
temperatures of around 50K^. Such a high superconductivity transition temperature for a non-cuprate containing compound is rather unusual as previous research on other related systems have found much lower transition temperatures (e.g. for LiTi2 0 4 13K^) for superconductivity.
Magnesium titanate spinels at high temperatures (20-1000K) exhibit thermally activated behaviour (Ea = 50-400meV) which is reminiscent of small polaron «type semi conductivity^"*. The high temperature stability and properties of magnesium titanate spinels have been investigated at temperatures up to 1500K and exhibit many properties suitable for insertion into an anode in solid oxide fuel cells such as the thermal expansion coefficient having a magnitude similar to that of yttria-stabilised zirconia^^. However, the ionic conductivity values of Mg2Ti0 4 spinel are much lower
than the ideal value of conductivity required (>10^S/cm at 900®C with a solid oxide fuel cell operating potential of between -1.0 and -0.7V^*^) for the anode material. Insertion of a pentavalent cation such as niobium or tantalum into the Ti0 2 starting material may increase the ionic conductivity due to the
1.4.1 Introduction
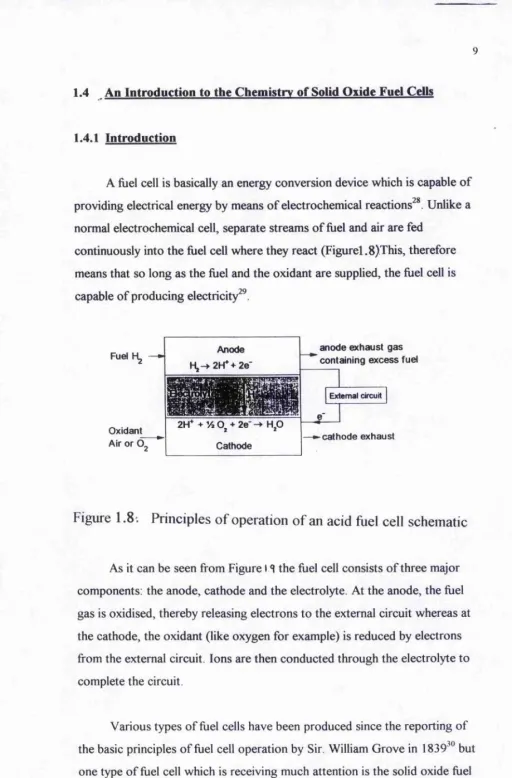
A fuel cell is basically an energy conversion device which is capable of providing electrical energy by means of electrochemical reactions^*. Unlike a normal electrochemical cell, separate streams of fuel and air are fed
continuously into the fuel cell where they react (Figurel.8)This, therefore means that so long as the fiiel and the oxidant are supplied, the fuel cell is capable of producing electricity^^.
Fuel Hg
O xidant Air o r 0 „
A node
H,-^2H*+2e-2H* + % 0 , + 2 e -^ H ,0 C ath o d e
a n o d e e x h a u s t g a s co n tain in g e x c e s s fuel
External circuit
c a th o d e e x h a u st
Figure 1.8; Principles of operation of an acid fuel cell schematic
As it can be seen from Figure 19 the fuel cell consists of three major components: the anode, cathode and the electrolyte. At the anode, the fuel gas is oxidised, thereby releasing electrons to the external circuit whereas at the cathode, the oxidant (like oxygen for example) is reduced by electrons from the external circuit. Ions are then conducted through the electrolyte to complete the circuit.
[image:25.613.32.544.13.791.2]EXCESS FU ir I TO BURNER. FUEL
H;. CO
ANOOE CO * H2O— ^ C 0 2 + Hz
OUTER CIRCUIT
20“
OXIDANT
AIR OR O2 CATHODE
EXHAUST OVERALL REACTION
[image:26.613.95.420.230.454.2]CD + — o CO;
Figure
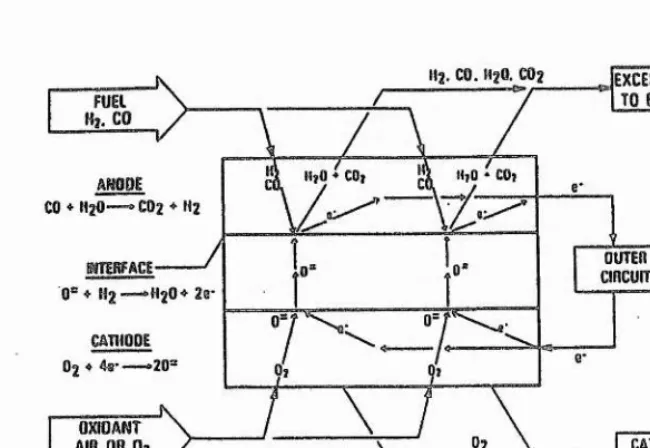
Schematic diagram of reactions occuring in SOFC’s
ceîP*. The solid oxide fuel cell is so called due to the choice of material selection being based mainly on metal oxides.
Solid oxide fuel cells operate at around 1000°C in order to encourage good conductivity and rapid reaction kinetics. Such a high temperature encourages the reforming of the fuel gases (ideally gases like methane) within the cell. The efficiency of the energy conversion is quite high due to minimal thermal losses during the energy transfer from chemical to electrical energy. Corrosion of the fuel cell is not a problem as there are no highly reactive metals present. As there are no liquids present in the solid oxide fuel cell, the cell can be manufactured into an unique shape for any particular application. Such a feature allows for cell design with additional performance.
Economically, solid oxide fuel cells are potentially favoured over other fuel energy systems due to their low construction costs, very high energy efficiency and adaption to local circumstances.
The major stumbling block and consequently the most important factor in the construction of solid oxide fuel cells is the choice of materials. The component materials, themselves, must be chemically stable in the severe oxidising and reducing environments of the cathode and anode respectively. Materials with different thermal coefficients will cause fractures and cracks in the cell on heating and cooling of the gases when mixed. The electrolyte should ideally be very dense to prevent gases from mixing during normal operating conditions with the electrodes being porous to facilitate the movement of the gases to their respective reactive sites.
11
ionically and electronically as it increases the surface area of reaction. Figure 1.9 is the schematic diagram of a simple solid oxide fuel cell.^ The oddant (oxygen gas) is fed into the cathode, where it is reduced to provide O^’ ions. Such ions are then transferred via the electrolyte to the anodic component (fuel electrode). The fuel (hydrogen gas) is fed to the anode, where it gets oxidised by 0^‘ producing water and electrons (Equation 3), which are passed to the external circuit.
Hz + O^* > HzO + 2e‘ (Equation 3)
1.4.3 Selection of materials for the electrolyte
The main areas of research for a suitable electrolyte have centred upon the need for the material to be stable, flexible and easily synthesised as well as being a good ionic conductor^^. Promising results have been obtained for yttria stabilised zirconia (YzOs-ZrOz) as it has been shown to have an acceptable ionic conductivity, very little electronic conductivity^^ and a thermal expansion coefficient of 10.8 x 10*^ K‘* for (YzO.Oo.os (Zr02)o.9z^^. However, yttria stabilised zirconia can suffer structural damage after prolonged periods of use and on heating and cooling^^.
Other materials that have been investigated include the cubic fluorite phase of stabilised 8-bismuth-sesquioxide (BizOs) which exhibits ionic conductivity of at least one to two magnitudes higher than yttria stablilised zirconia**'^. Unfortunately stabilised Ô-BizOs is easily reduced at low oxygen partial pressures to bismuth metal. This means that it is necessary to protect the material from reducing conditions'"^.
1.4.4 Selection of materials for the cathode
atmospheres, adequate compatibility with ytrria stabilised zirconia based electrolytes and a similiar thermal expansion coefficient to other ffiel cell components^®. By substituting La^^ in LaMnOs, a p-type perovskite with Sr^*, one can improve the conductivity by increasing the Mn"*^ content^^ (see equation 4).
LaMnOj —
La^'^i-xSr^^
Mn'*** O
3(Equation 4)
By substituting 10mol% Sr^% an increase in electronic conductivity from 75 to 125 Scm'^ at lOOOT is noted^^. The thermal expansion coefficient of LaMnOa is quite similar to that of yttria stabilised zirconia (11.2 x 10"® IC*) and increases slightly upon the addition of strontium. A significant problem which has recently received much attention is the reaction between the cathode and electrolyte during co-sintering and in reducing atmospheres during fuel cell temperatures resulting in poorly conducting phases such as LazZrzO? which increase ohmic losses and reduce fuel cell performance^®.
1.4.5 Selection of interconnecting materials
13
1,4.6 Selection of materials for the anode
The anode material currently used is a nickel/yttria-stabilised zirconia cermet, which incorporates active particles of nickel in an inactive yttria- stabilised zirconia support'^®. In order to provide very high electronic conduction as well as protection from the reducing conditions of the anode, metals are used as anode materials. The metal which satisfies these conditions as well as its low cost and high catalytic activity is nickel.
Oxidation of the fuel at the anode involves the adsorption of the fuel onto the nickel as shown in equations 5 and 6:
Hz + 2Ni 2W1H ' (Equation 5)
2NÎH + Go"' HzO + 2Ni + + 2e‘ (Equation 6)
The nickel metal is dispersed in yttria-stabilised zirconia to support the nickel particles, to prevent the fusion of the nickel particles at high temperatures and to help match the thermal expansion of the electrolyte.
1.4.7 Cell Design and Fabrication
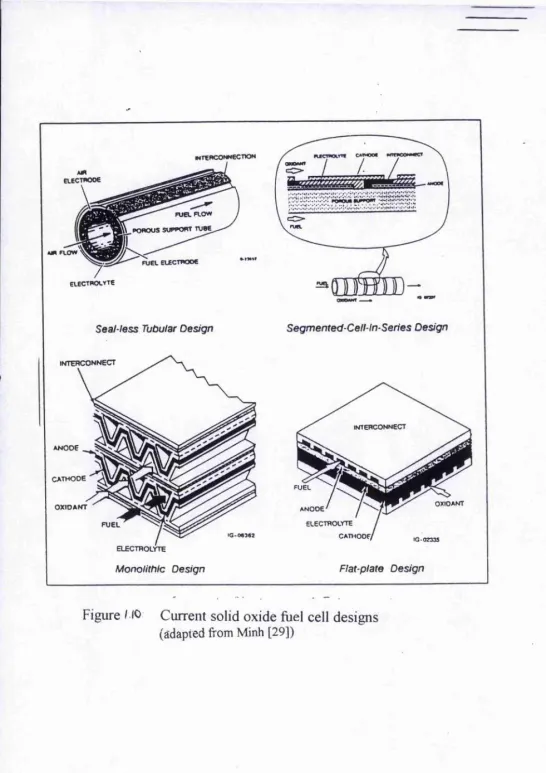
Several cell configurations have been proposed: seal-less tubular design, segmented cell-in-series design, monolithic design and flat plate design^^ (Figure MO). All of these designs involve the basic structure of the simple fuel cell (Figure 1.8). Unfortunately, due to the cells having a rather low voltage output (typically below IV DC**^), the cells tend to be used in series or in parallel; such cells are known as ‘stacks’. These ‘stacks’ have already been tested at power outputs of between 135W and IkW^®.
The seal-less design, devised by Westinghouse is probably the most advanced of all the cell configurations proposed. Such a cell configuration involves supporting layers of anode, cathode and electrolyte material on a porous support tube, closed at one end"*^. For cell operation, oxygen flows inside the cell on the outside of the support tube. An advantage of this design is the simple separation of the gases via the support tube, eliminating the need for gas-tight seals as the production of gas tight seals has been a major design problem. The main disadvantages of this cell configuration is the rather poor gas diflusion through the support tube which leads to poor cell performance as well as the complex procedure of applying the electrode and electrolyte layers onto a curved support tube. Such cells have been tested for periods up to 3000 hours with typical cell performance of about 0.68V at 250mA/cm^, 0.17W/cm^'*\
W T t «CONNECTION
AW
aECTnooe
FUEL FLOW
POmOUS SUPPORT TUBE
n.ow
FUEL ELECTRODE
ELECTROLYTE
S e a l-le ss Tubular D esig n S e g rn e n te d -C e ll-ln -S e rie s D esig n
IM TERCONNECT
a n o d e
CATHODE
OXIDANT
a
1
FUEL
ELECTROLYTE
Monolithic Design
i n t e r c o n n e c t
F U E L
a n o d e
ELECTROLYTE
C A T H O O F i
O X I D A N T
[image:32.620.9.555.0.773.2]F lat-plate D esig n
Figure
I
Current solid oxide fuel cell designs
The simplest design of the fuel cell components is the flat plate stack. This design, due to its simplicity requires gas tight seals along the edges of the ceramic plates. As the resistance of the cell depends only on the thickness of the component layers, the production of ultra-thin plates will minimise the resistance. By producing thin cell component plates which have very liittle resistance, there is the possibility of lower operating temperatures. Thin plate designs have produced power densities of 0.2W/cm^
The different cell configurations have led to a variety of methods of depositing/fabricating fuel cell components such as electro-vapour deposition, tape casting'^ and calendering'^^. Using yttria-stabilised zirconia electrolytes of thickness of 1-1 Ogm by such methods have led to high power densities at low temperatures'^^ such as 0.55W/cm^ at 800°C and 0.91W/cm^ at 1000°C, using hydrogen gas as a fuel.
Solid oxide fuel cells offer a cleaner alternative means of producing electrical energy; however, there are still problems to be overcome namely, materials selection for the fuel cell components and the design of the ‘stacks’ and even, then, if competing technologies improve their efficiency, solid oxide fuel cells may not become a commercial reality.
16
One class of ceramics which are likely to meet those criteria are the fluorite-based metal oxides. It is possible to dope those oxides with early transition metals like Ti and Nb, so that electronic conductivity can be induced in reducing atmospheres. Unfortunately, very high levels of doping are likely to be required to achieve reasonable levels of electronic conduction and such levels are thought to be detrimental to ionic conductivity.
One of the most eîctensively studied high temperature oxide-ion conductors which has the cubic fluorite structure is yttria-stabilised zirconia^®’^^’^^. Conduction occurs via the migration of oxygen vacancies, which are the charge compensating species introduced as a result of aliovalent doping. Over a wide range of oxygen partial pressures, 1 - 10’^* atm, the ionic transport number is close to unity^^, indicating that conduction is purely ionic. Ionic conductivity is defined as:
a = S njeiPi (1.1)
i
where n, = number of charge carriers (number of oxygen vacancies) e; = charge of carrier
Pi = mobility of carrier
and ionic conductivity, a, normally shows an Arrhenius type behaviour,
a = A exp ( -Ea/kT) (1.2)
where Ea = the activation energy (eV) A = pre-exponential factor
k = Boltzmann constant, 1.38 x 10’^^ JK'^ T = temperature (K)
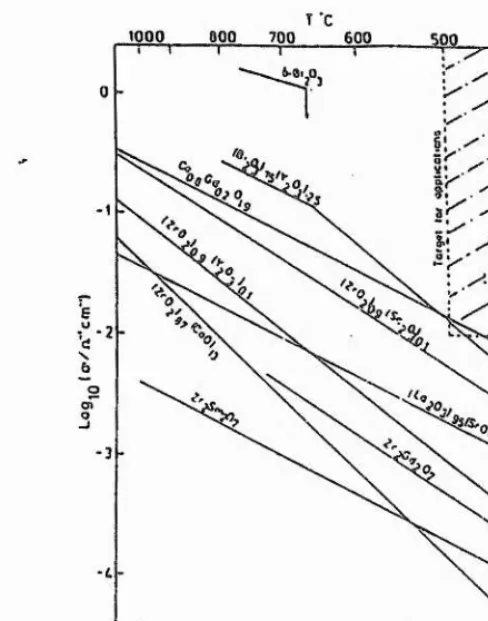
typical Arrhenius fashion with an activation energy of about 1 eV^^. Figure LI I shows the Arrhenius plots for a variety of oxide-ion conductors^'*; the shaded area represents the desirable values for practical applications. As it can be seen from FigureU I, the oxide-ion conductivities of stabilised zirconias are not the highest, as the highest values of oxide-ion conductivity are observed in doped and undoped Ô-BizOs and doped ceria. It should be noted, however, that doped and undoped ô-BizOa undergo phase transitions between 500 and 700®C and doped ceria may become electronically conductive under reducing conditions. The high conductivity observed between 800 and 1000°C and the absence of any notable phase transitions suggests that yttria-stabilised zirconia may be a useful high temperature oxide-ion conductor but at temperatures of between 500 and 700°C a decrease in activation energy is noted with increasing temperatures. This phenomen is due to vacancy-cation association^^.
Figure 1.12 illustrates the variation of ionic conductivity with dopant concentration, for a variety of dopants, at 800°C As the amount of dopant is increased, the amount of oxygen vacancies increases; an increase in conductivity with increasing dopant concentration may be expected. In reality, the conductivity reaches a maximum value for dopant concentrations between 8 and 14 mol%; different dopant types produce maxima in the ionic conductivity at different dopant concentrations. Table 14 lists the ionic radii of the different dopant cations; for a fixed dopant content, large ionic radii of a dopant and lower dopant cation valences generally result in lower values of conductivity being recorded.
Cation Ionic Radii (Â)
Zr'*^ 0.98 Yb’'" 1.12 1.20 y3+ 1.16 1.26 Nd"" 1.26
T ‘C
1000 BOO 7 0 0 6 0 0 5oa
8 0 100 12 0 14 0
1/TX10^ !<■’
Figure 1 .(I The ionic conductivities for some high temperature oxide-ion conductors, showing the desirable values for ;pmctical applications [54].
T3
C aO
m o l % H 2 O 3 , H O
[image:36.623.121.365.30.340.2] [image:36.623.119.433.313.726.2]After the conductivity has reached a maxima, a large and dramatic decrease in conductivity is noted, due to the interaction of the oxygen vacancies with the cations, thereby reducing the mobility of the oxygen vacancies.
Titanium-substituted zirconias give the excellent electronic conductivity properties required for a ZrOz based fluorite material® but problems have been encountered such as a decrease of the unit cell size on reduction^^. Some related systems such as the Mg0 :Zr0 2 :Ti0 2 phase system have not been as
extensively researched with respect to oxide-ion conductivity but should provide some interesting results for analysis.
1.6 Phase diagrams
1.6.1 Introduction
The field of phase equilibria and phase diagrams is one of the cornerstones of solid state chemistry. Phase diagrams are plots of temperature (occasionally pressure) against composition. They summarize in graphical terms the ranges of temperature and composition over which certain phases or mixture of phases exist under conditions of thermodynamic equilibrium. This means that the effect of temperature on solids and the reactions that may or not occur between solids can therefore be easily deduced from the appropriate phase diagram.
The fundamental rule on which phase diagrams are based upon is the phase rule developed by W.J. Gibbs. It is defined as:
F = C -P + 2 (1.3)
19
P = the number of phases
The quantity, F, deals with the number of variables that have to be specified to define the system completely, and usually includes the concentration of each phase present. This number is also called the variance or the number of degrees of fi'eedom. In a system of two different chemical substances, if one has a concentration that has a mole fi-action of 0.4, the concentration of the other is fixed at 0.6 because the sum of the two must be 1.0. The variance in concentration is therefore 1 not 2
The number of components, C, is the smallest number of independently variable chemical compounds that must be specified in order to describe the composition of each phase present in the system. For example, in the system liquid water, ice and water vapour, there is only one chemical present, namely water.
The number of phases is the number of physically distinct and mechanically separable portions of a system, each phase being itself homogeneous. The distinctions between different crystalline phases is usually clear. For example, the dififerences between chalk, CaCOs, and sand, SiOz, are obvious. The distinction between crystalline phases made fi'om the same components but of different composition is also usually clear. Thus, the magnesium silicate minerals enstatite, MgSiOs, and forsterite, Mg2Si0 4 are
different phases. They have very different composition, structure and properties. With some solids, it is possible to get different crystalline phases having the same chemical composition. This phenomen is Icnown as polymorphism (see Section 1.2). For, example, the two polymorphs of Ca2$i0 4 can be prepared at room temperature, the stable y form and the
Two component or binary systems have three independent variables: pressure, temperature and composition. In most systems of interest in the general area of solid state chemistry, the vapour pressure remains low for large variations in temperature and so, for work at atmospheric pressure, the vapour phase and the pressure variable need not be considered. In binary systems under these conditions an invariant phase occurs where three phases co-exist in equilibrium: an unvariant curve for two phases and a bivariant condition for one phase. Conventionally, temperature is the vertical scale and composition is the horizontal one in binary phase diagrams.
In the Mg0-Ti02 phase diagram (Figure U3), there are three intermediate compounds present: ilmenite (MgTiOs), spinel (Mg2Ti0 4 ) and
distorted pseudobrookite (Mg2TiOs). The distorted pseudobrookite and spinel
species were found to be unstable at room temperature due to the configurational entropy arising from cation disorder. Phase diagram studies by Wechsler and Navrotsky^^ reveal that at 1500°C with an approximate MgO content of 67mol%, the spinel structure is present. With a 1:1 ratio of magnesium oxide to titanium oxide, the ilmenite structure crystallizes. At 33 mol% MgO, the distorted pseudobrookite structure is formed.
1800
1700
1600
1500
1000
500
100
TiO%
[image:40.617.116.368.37.344.2]MgO Mol %
Figure
H3
The MgOiTiO] phase diagram
Adapted from ref [59]
3 0 0 0
2 5 0 0
20 00
:5C0
:000
300
L i q u i d
Cubic s s Liquid
i ^Ub i C S 5 e tr o g o n o
^ . j - Te»rogono! s s
/ Tetr ogonoi S S + MgO
---M o n o c ' i mc s s + Te t r og on o i s s * Monocl i ni c s s
MonocL mc s s + MgO
MgO Mo I %
Figure
Ul^.
An early version of the MgOiZrOj phase diagram
2500
2000
F SS + MgO
1500
r —
1000
500
[image:41.618.115.383.44.328.2]Mol % MgO
Figure
I.IS;Revised version of the MgO:ZrOz phase diagram
where M— monoclinic phase, T= tetragonal phase and F= cubic
fluorite phase. Adapted from ref [61 ]
2800 2600 2400 2200 2000 1800 1600
' 1...r ~ 2700*25®
v \ - \ \
\ \
'■ 1... ‘.... 1 1 1 " T " '
I r 0 2 \ \
-_ Cub \ \ _
ss \ \ Liquid
ZrO j Tet s s l N .
—
1 Z rO ; Tet ss + Liq. \
1 \
1 \ —
t \ "
1--- 1830*:?0o\(60% ) / I
1
1 ZrTiO^ s s j ^
1720*20® (73%) \ ss _ .1. \ ...i! 1 1 l l 1
0
ZrOz
20 40 60
Mol % 80 100
TiOî
21
the cubic-fluorite structure, leading to MgO peaks being observed, in addition to the cubic-fluorite structure.
The TiOi-ZrOz binary system has been investigated by Shevchenko et al^^ (Figure ).!(;) and consists mainly of a mixture of certain phases with veiy few significant single phase regions. As Ti"*^ has a slightly smaller ionic radius than Zr"*"^ itself, it is unlikely that Ti"*^ can stabilize the cubic-fluorite structure to room temperature (Section 1.2.1) leading to the fact that the cubic-fluorite structure will only exist at high temperatures (> 2330"C) with low concentrations of TiOz (< 18% mol). However, single phase samples of ZrTi0 4 have been characterized and were found to crystallize with the
orthorhombic structure^^.
1.6.3 Ternary Phase Diagrams
Three component or ternary systems have four independent variables: pressure, temperature and the composition of the two components. If the composition or concentration of two of the components in a particular phase is fixed, the third is automatically fixed by difference. In this section, for simplicity, the MgOiTiOiiZrOi phase system is not a volatile system, which means that the condensed phase rule, i.e. P + F = C + 1 = 4 can be applied. Under these conditions, the ternary system is, for example, invariant when four phases - generally three crystalline phases and liquid - coexist at one fixed temperature.
Ternary compostions within equilateral triangles are given by reference to a grid (Figure ÏM). Each of the three binary edges are divided into a hundred divisions. Point A corresponds to 100% A: the edge BC corresponds to 0% A; and the line XY to 10% A. Thus, the A content of any ternary composition is given by drawing a line through that composition and parallel to the BC edge. The A content is then read off from the intersection of this line with either the AB or AC edges, respectively. Point P in Figure has a composition of 30% A, 45% B and 25% C. Compositions can be either in atom per cent, in mole per cent or in weight per cent. In practice, it is usually preferable to use mole per cent for inorganic systems because the formulae of binary and ternary phases are then clearly related to the composition^.
The Mg0:Ti02:Zr02 phase diagram was studied by Coughanour et al^"^. In their analysis,for the study of ternary fields, some selected samples (Table / S) were subjected to suitable heat treatment and after quenching or cooling were analysed by X-ray techniques. It was found that no ternary compositions were observed but binary joins were established for the MgTi2 0s-ZrTi0 4 ,
MgTi2 0 5-Zr0 2, MgTi0 3-Zr0 2 and Mg2Ti0 4-Zr0 2 subsolidus equilibrium
systems. The authors admit that not a very high degree of accuracy was used in determining the solid-solution limits as the heat treatments of the samples were inconsistent from one sample to another but claim that the phase diagram proposed (Figure l.lS) shows the general trends of solid-solution formation.
The paper also suggests that single phase cubic-fluorite samples can be obtained within the Zr02-rich region by quenching the samples at temperatures in excess of 1400"C. However, if a slow cooling technique was employed, monoclinic Z1O2, cubic ZrÛ2 and some MgO would be observed.
90
80 20
70 .30
V.A
60 40
50,
40, 60 % B
30, 70
20, 80
90
90 80 70 60 50 40 30 20 10
V. C B
C
Figure 1-17 A ternary phase diagram .
TiO
IÜ Ü 3 One P h ase Areo
1 I Two P hose A rea Three P hase Area
MT,
MT, ZT
MgO Mol. % ZrO:
[image:44.620.7.539.36.786.2]atu re
13:3:31 M T j'Z T ... h r2 0 1,500c M T ,4 -Z T -i-tra cc T iO ;. 1:1:3 I 1.530 M T ;-i-Z T .
1:2:4 1 1.600 D o .
4:1:8 M T i-z'rO i.. 1,500 M T t -f trace M T (n o ZrO; 3 :2:8 do 2 1.500 M T j-h m o n o clin lo ZrOi-i-a t a ll). 1:1:2 28 k 1.300 trace Z T ,D o .
1:1:2 1.325 M T ;-f m on oclin ic ZrO*. 1:9:2 1 1,670 m o n o c lin ic Z r O j-ftr a c e
M T ;.
9:1 :9 M T -Z rO ;... ■ 2 1,500 M T - f t r a c e m o n o c lin ic . 3 :1:3 do : 2 1.325 M T -1-m onoclinic ZrO;-t-ZrOs. 3:2:3 do 1 1,610 M T -j-m on oclin tc ZrO ;-rtrace M T j.
trace cu b ic ZrO«. 1:1:1 ' }'i 1, 623 M T + m o n o c Iin ic ZrOj. 1:1:1 . 72 b 1.400 M T -f-cubIc ZrOj. . 1:3:1 • }> 1,750 C u b ic Z rO ;-fm onocU olc
[image:45.630.137.383.88.574.2]1:9:1
... } î
i Z rO s-ftrace M T . 1,700 M o n o clin ic Z rO j-f trace
cu b ic ZrOj.
10:1:3 M jT 'Z rO j . . . . 2 ' 1,500 M i T « - f s m a l I a m o u n t cu b ic ZrO i.
. 8:1:3 ' 2 1,300 , M jT «-f-cubic ZrOi. : 8:2:3 1 1.610 . D o ,
2:2:1 Î1 ' 1,750 M jT «-|-cu b tc ZrO;. I 2:2:1 . 72 ■ 0 1 .200 M }T '-fm o o o c lln ic ZrO;«.
2:3:1 ; .' -s 1.700 1 C u b ic ZrO î-i-trace M sT«. d o . . . , --- : ) i 1 1.750 i C u bic ZrO).
1 1:1:4 M T s -Z T -T iO } ... • 1' 1,425 ! M T .-f-Z T -1-T lO j, 1:1:9 ■ 1 1.425 : M T s-f TiOsH -trace Z T . 1:1:19 2 1.350 ! T IO .-f-M T ,. 1:3:9 1 1.425 T iO ;-t-.M T i+ Z T . 2:3:6 .M T j-Z T -Z rO s.... 2 1,500 i M T ;-fZ T .
1:2:3 3 1 ,450 M T ;-f - Z T - r m o n o c lin ic ' 2:1:3 M T -M T r Z tO ;.. 4 1. 450, ' M T ,-i-cu b ic Z rO ,-f-M T .ZrO ,. . 2:6:3 ■ 16 b 1,300 1 C u b ic ZrO s-t-m onoclInlc
3:2:2 .M -T -.M T -Z rO j.. ! ‘ j 1.625 : M ,T ‘+ M T - f e u b ic andZrO ,. 3:3:2 . 1 1.610, M îT '-l-cu b ic ZrO ,.m on oclin ic ZrO,. 3:3:1 M gO -M jT -Z rO j. 3i 1.650 C u b ic Z r O s -r M g O '- t-3:3:1 ' i 1.630 C u b ic ZrO j-i-M gO ',trace ^ r ,T '. 1:9:0 .M gO-ZrO;... 1 1. 670 C iib io ZrOj-h m onoclinic 1:9:0 72 ^ 1 .4 9 0 . 1 C u b ic ZrO ,. ZrO*. — ■ 1:9:0 . 3(1 b 'l.2 œ ' M o n o clin ic ZrO ,-t-sm all
1:4:0 ...... 1 1,610 i C u b i c Z r O j - t - s r a a l la m o u n t M gO .«
1:1:0 1 1,610
a m o u n ts of M gO® and m on oclin ic ZrO ,. C u b ic Z rO ;-f m onoclinic 1:1:0 48 b 1. 5151 C u b ic ZrOj-(-M gO.«Z rO ,+ MgO.®
1:1:0 :...... 80 . b 1.200 , M o n o clin ic ZrO j+M gO .®
i> T h e sp ecim en w as q u en ch ed from th e tem p eratu re In d icated . " so lid -so lu iio n form ation w as n o ted u i thi-i su b sta n ce.
Table 1.5: Literature results of solid state reactions in the
23
L7 Conclusions
As it can be seen from this literature review that the MgOiTiOgiZrO: phase diagram has not been well studied. As titanium stabilised zirconias have the excellent electronic conductivity required for a ZrOz-based fluorite material , but problems have been encountered such as a decrease in unit cell size upon reduction under Solid Oxide Fuel cell conditions. This might be overcome by the addition of an aliovalent cation such as Mg^^. By constructing an accurate phase diagram of the MgOiTiOziZrOz system at high temperatures, it will be possible to assess its suitability with respect to stability and its ability to perform under strongly oxidising/reducing conditions.
1.8 References
1- L.K. Lenz and A.H. Heuer, J. Am. Cer. Soc., 1982, 65, 192- 194.
2- J.D. McCullough and K.N. Trueblood, Acta. Cryst., 1959, 12, 507- 511.
3- G. Teufer, Cryst., 1962, 15, 1187-1188.
4- D.K. Smith and C.F. Cline, J. Am. Cer. Soc., 1962, 45, 249-250. 5- A.R. West, Basic Solid State Chemistry, John Wiley and Sons,
Chichester, 1991.
6- A.R. West, Solid State Chemistry and its applications,John Wiley and Sons, Chichester, 1990.
7- A. Wold and K. Dwight, Solid State Chemistry,Chapman and Hall, London, 1993.
8- R C. Garvie, J. Phy. Chem., 1965, 69, 1238-1243.
11- V. Stubican in: Advances in Ceramics, Vol 24, eds. S.Somiya, N. Yamamoto and H. Yanagida (The American Ceramic Society, Columbus, OH, 1988), 71-82.
12- M. Yoshimura, E. Tani and S. Somiya, Solid State Ionics, 1981, 3/4, 477-481.
13- I.R. Gibson, PhD. Thesis, University of Aberdeen, 1995. 14- C. Pascual and P. Duran, J. Am. Cer. Soc., 1983, 66, 23-27. 15- T.J. Cogle, C.A.S. Mateus, J.H. Binks and J.T.S. Irvine, J. Mater.
Œew, 1995,1, 289.
16- A. Feltz, M. Steinbruck, J. Less-Common Met., 1991, 167, 233. 17- A. Feltz, M. Steinbruck and F.W. Breit-Barth, Z Anorg. Allg. Chem.,
1990,137, 137.
18- A B. Sheikh and J.T.S. Irvine, J. Solid State Chem., 1993, 103, 30. 19- M. Steinbruck and A.Feltz, Z Anorg. Allg. Chem., 1991, 594, 157. 20- W.H. Bragg,, Nature, London, 1915, 95, 561.
21- S. Nishikawa, Prac. Toyko-Math. Phys. Soc., 1915, 8, 199.
22- A.A. Finch, A B. Sheikh, G. Mather, C Namgung and J.T.S. Irvine, Proceedings of the Fifth Int. Symp. on Superconductivity, Springer Verlag, 1992.
23- D.J. Johnson, J. Low Temp. Phys., 1976, 25, 145.
24- J.T.S. Irvine, Final report on Superconductivity in Reduced Titanate Spinels', Grant report ref. G48886, SERC, 1993.
25- D P. Fagg, S.M. Fray and J.T.S. Irvine, Solid State Ionics, 1994, 72, 235-239.
26- B.C.H. Steele, P H. Middleton and R. A. Rudkin, Solid State Ionics, 1990, 40/41,388.
27- D P Fagg, PhD. Thesis, University of Aberdeen, 1996.
28- A. Dicks, Electrochemistry Newsletter, Royal Society of Chemistry, 1996, 86, 24.
25
31- J.T.S. Irvine and D P. Fagg, Conference Abstract, Fuel Cells and Catalysis Conference, University College, London, 1996.
32- I.R. Gibson and J.T.S. Irvine, J. Mat. Chem., 1995, 6, 895-898. 33- R Maenner, E. Ivers-Tiffee, W. Wersing and W. Kleinlein, in Proc.
2nd Int. Symp. on Solid Oxide Fuel Cells, eds. F. Gross, P. Zegers, S C Singhal and O. Yamamoto (CEC, Luxembourg, 1991), p. 715 34- M. Miyayama, T. Nishi and H. Yanagida, J. Mater. Sci., 1987, 22,
2624-2628.
35- T. Takahashi, T. Esaka and H. Iwahara, J. Appl. Electrochem., 1977, 7, 303-308.
36- A. Hammouche, E.L. Schouler and M. Henault, Solid State Ionics,
1988, 28-30, 1205-1207.
37- J B Goodenough, Phys. Rev., 1955, 100, 564-573.
38- H. Taimatsu, K. Wada and H. Kaneko, J. Am. Cer. Soc., 1992, 75, 401- 405.
39- H.U Anderson in: Proceedings of Crystalline Ceramics, eds. H. Palmour III, R F Davis and T.M. Hare, Plenum Press, New York,
1978, 469-477.
40- S. Murakami, Y. Miyake, Y. Aliyama, N. Ishida, T Saito and N. Furukawa in: Proceedings of the Int. Symp. on Solid Oxide Fuel Cells, eds. O. Yamamoto, M. Dokiya and H. Tagawa, Science House, Japan,
1990.
41- D P Fagg, private communication.
42- M R Fry, Martin R. Fry and associates. Fuel Cells for Clean PoM>er Generation and Transport, EPSRC and BBSRC Clean Technology Unit, October 1994.
43- S.C. Singhal in.- Proceedings of the 2nd Int. Symp. on Solid Oxide Fuel Cells, eds. F Grosz, P. Zegers, S.C. Singhal and O. Yamamoto, CEC Publ. EUR 13546 EN, Brussels, Belgium, 1991, 25-33.
Mrazek, J J Piccaolo, R.B. Poeppel and S.A. Zwick, in; 1986 Fuel Cell Seminar Abstracts, Courtsey Associates, Washington D C 1986, 40- 43.
45- S. Saloirada and T. Yoshida in: Proceedings of the 2nd Int. Symp. on Solid Oxide Fuel Cells, eds. F. Grosz, P. Zegers, S.C. Singhal and O.Yamamoto, CEC Publ. EUR 13546 EN, Bmssels, Belgium, 1991, 64-67.
46- C.C. McPheeters and T.D. Claar in: 1986 Fuel Cell Seminar Abstracts, Courtesy Assoc., Washington D C , 1986, 64-67
47- N.Q. Minh, F. Liu, P.Staszak, T. Stillwagon and J.Van Ackeren in: 1988 Fuel Cell Seminar Abstracts, Courtesy Assoc., Washington DC., 1988, 105-108.
48- N.Q. Minh and C.R. Home in: Proceedings of the 14th Riso Symp. Mat. Sci. On High Temp. Electrochem. Behav. Fast Ion & Mixed
Conductors, eds. F.W. Poulsen, J.J. Bentzen, T. Jacobsen, E. Skou and M.J.L 0stergard, Riso National Laboratory, Roskilde, Denmark,
1993, 337-341.
49- J.T.S. Irvine, I.R. Gibson and D P. Fagg, Ionics, 1995, 1, 279-285. 50- J.E. Bauerle, J. Phys. Chem. Solids, 1969, 30, 2657-2670.
51- J.A. Kilner and B.C.H. Steele in: Non Stoichiometric Oxides, ed. O.T. Sorensen , Academic Press, New York, 1981, 233- 269.
52- M. Kleitz, H. Bernard, E. Fernandez and E. Schouler in: Advances in Ceramics, Vol. 3, eds. A.H. Heuer and L.W. Hobbs (Amer. Cer. Soc., Columbus, OH, 1981), 310-336.
53- J F Baumard and P. Abelard, in: Advances in Ceramics, Vol. 12, eds. N. Claussen, M. Ruble and A H. Heuer, The Amer. Cer. Soc.,
Columbus, Ohio, 1984, 555-571.
54- J.A. Kilner and R J Brook, Solid State Ionics, 1982, 6, 237- 252.
27
56- J.A. Kilner and B.C.H. Steele in; Non Stoichiometric Oxides, ed. O. Sorensen, Academic Press, New York, 1981, 233-269.
57- Riso Laboratory, private communication. 58- K.D.M. Harris, private communication.
59- B.A. Wechsler and A. Navrotsky, J. Solid State Chem., 1984, 55, 165- 180.
60- E.N.S. Muccillo and M. Leitz, J. Eur. Cer. Soc., 1996, 16, 453-465. 61- D. Viechnicki and V S. Stubican, J. Am. Cer. Soc., 1993, 48, 293. 62- V.S. Stubican, Ceram., 1988, 24A, 71-82.
63- A.V. Shevchenko, L.M. Lopato, I.M. Maister and O.S. Gorbunov, Russ. J. Inorg. Chem. (Engl. Trans!.), 1988, 25, 1379-1381.
64- C. Zheng, private communication.
Chapter 2
Experimen
tal
2.1 Structure of Chapter
As explained in the previous chapter, the principal aim of this project is to develop a more detailed phase diagram of the MgOiTiOziZrOi system. The first section of this chapter will explain the experimental techniques that were employed for sample analysis such as X-ray diffraction, thermal analysis and a.c.-impedance spectroscopy. The second section is concerned mainly with the synthetic details of the experiments that were performed during the course of this project.
2.2 Experimental Techniques
2.2.1 X-ray diffraction
X-ray diffraction was carried out using a Stoe STADI P automated diffractometer operating in transmission mode. With the associated software, it is possible to obtain useful information such as lattice parameters, crystallite size and the content of each phase present. Using a germanium monochrometer, Cu Kai radiation was selected and X-rays of wavelength
1.54056Â were used.
29
The detector could move through 10 - 140 20 in small increments - the stepwidth - which could be determined by the user.
Samples were prepared by lightly smearing an acetate foil with vaseline, on to which about 1 mg of powdered sample was applied. The acetate foil was fitted into a circular holder which was placed into the diffractometer. The holder was continuously rotated to minimise preferred orientation.
For lattice parameter determination, x-rays were collected over a 20 range of 10-70 20, typically using a stepwidth of 0.5093 and measuring for 10 seconds per step. Data analysis was performed using the associated Stoe software. The collected raw data was stored in the file RAWT)AT. Using the peak searching program PKS and by selecting the average peak width and the significant identity to background ratio, all reflections were determined from the raw data and an output file listing peak positions (20 and d-spacings), the peak widths (full width and half maximum, FWHM) and relative peak identity (I/Io) were obtained.
Differential thermal analysis (DTA) is a technique in which the difference in temperature between a sample and reference material is monitored against time or temperature while the temperature of the sample, in a specified atmosphere is programmed. The DTA curve is generally a plot of the difference in temperature (AT) on the horizontal axis against the temperature T (or occasionally the time) on the vertical axis^. An endothermie event gives a downwards ‘peak’ (Figure 2 A ),
Differential thermal analysis was carried out using a computer controlled TA SDT simultaneous DTA-TGA apparatus using pre-dried alumina (AI2O3) as the reference material. In all instances, thermogravimetry showed no significant change in mass during heating.
The platinium pans were cleaned out thoroughly, dried and pre weighed. Approximately 30 mg of both sample and reference material were weighed and inserted into separate platinium pans. The furnace was then sealed and an appropriate program was made up on the computer indicating the conditions for the sample being analysed. Figure 2.2 shows a sample program that was used to analyse the (Mg2Ti0 4 )o.2 (Zr02)o.g system from 50-
1400T.
2.2.3 A.c.-impedance spectroscopy
I
A Exo
thermic
[image:54.614.50.436.25.731.2]0
Figure 2,1
A D.T.Agraph showing evidence of an endothermie peak
Segment Description
1. Jump to 50°C
2. Isothermal for 5 minutes
3. Ramp 10°C/minute to 14CK3‘^C
4. Isothermal for 10 minutes
5. Ramp 10°C/minute to 200°C
6. Air cool (using Oj as purge gas)
7. Mark end of cycle 0
Figure 2.2
Sample program for TGA-DTA instrument. This program wasused to evaluate the (Zr0 2 )o.8 (Mg2Ti0 4)o.z system between
[image:54.614.108.375.48.245.2]extensively used to investigate the effects of corrosion^, segregation of impurities^, defect interactions and ageing phenomen®.
The a.c. measurement
The electrical properties of a variety of materials were initially studied by the d.c. resistance measurement. However, the applications of this technique are limited as it measures only the total resistance of the cell, which includes contributions from the material and the electrodes. A.c. impedance spectroscopy has the advantage that individual components of the material can be separated e.g. bulk grain boundary, sample/electrode interface, allowing detailed characterisation to be made. A comprehensive study of a.c. impedance spectroscopy and its applications has been made by MacDonald^.
The a.c. impedance technique involves the application of an a.c. voltage (V) of vaiying frequency across the sample:
V = Vo sin cot (2.1)
The resultant current (denoted by 1) leads the voltage by cp, the phase shift of the transfer function; therefore:
I = lo sin (cot + cp) (2.2) The transfer function can be defined as:
H((o) = |H(0)| e'"'
where |H(co)| = Vo/Io and |H| is the modulus of the transfer function.
The impedance is given by:
K
32
impedance is a vector quantity and can be defined using the complex numbers terminology:
z'» CL4)
complex real imaginary
The magnitude and direction of the complex impedance
Z*
can be expressed as real(Z’)
and imaginary(Z” )
components. The complex impedance can be plotted by cartesian(Z’
vs.Z” )
or polar co-ordinates (|Z| vs. <p). Figure2.3.Thus:
,Z' = |Zj(X)sq)
C2 5)
Z” -lZ|sincp
(2.6)
By measuring the amplitude and phase shift (cp) of the current for any frequency (o), with a fixed applied voltage (V), the impedance is calculated (equation 2.3) and Z’ and Z” can be determined (equations 2.5 and 2.6 respectively). By varying the frequency from 100-10^ Hz, a complex impedance plot such as Figure 2.4can be obtained.
Equivalent circuits
T
Figure
2.3
The complex impedance plane which can be plotted as cartesian (Z’Vs. Z’) or in polar form ( |Z| vs.<p). [image:57.617.115.385.62.299.2] [image:57.617.122.411.396.650.2]A
33
The simplest equivalent circuit can be obtained for either an ideal individual resistor or an ideal individual capacitor. For an ideal resistor, current and voltage are in phase and from equations 2.1 and 2.2:
where R is the resistance (O ); therefore, from equation 2.3:
Z = R
So, from a phase shift (p= 0, Figure 2,S*(a) is obtained. An alternative formalism is the complex admittance, Y” , which is equal to the inverse of the complex impedance (Z*)'\ so for an ideal resistor:
Y* = R-' (2.7)
For an ideal capacitor, the capacitance (F) is given by:
where q is the charge stored (C) and V is the voltage across the capacitor.
' - Î 4 3
For a capacitor, the current leads the voltage by 90" - out of phase - and from equation 2.1:
From equation 2.2:
I = CO c Vo
An ideal capacitor allows the flow of an a.c. current but blocks a d.c. current (i.e. Z’ = 0); from equations 2.3 and 2.4:
jC ù C
and Y* = jcoc (2.8)
producing the complex plane plot in Figure 23 (b).
Most components e.g. bulk can be modelled in terms of a resistive element in parallel. The complex impedance of the parallel RC element is defined as:
1 1 + ■1
z*r z*i z*2
or:Y»T = Y*1 4- Y*2
and from equations 2.7 and 2.8,
Y * T = i + j a c
R
i.e. Y’ = — and Y” = oc
R
A
9 9
(a)
9 9
(b)
= (Y«T)-‘ = [A y û > cJ-'
R
{l-jaRC)
\+jcûRC'(\-Jû>RC)
RO.-j(oRC)
\ + (û}RCŸ
R
R(<aRC)
I.e.
\ + {û)RCy
\ + {û)RC)
V - j Z”
"
'•
î
7ÏS5F*“'"”‘
w s
4
By varying the frequency from 0 to 10^-10® Hz, a complex plane plot,
illustrated in Figure 22, is obtained. When coRC = 1, a maximum Z” is
R
obtained and at this point Z’ = Z” = -^ •
From this simple derivation, the resistance and capacitance of an
unknown component can be determined by obtaining the real and imaginary
impedance over a wide range of frequencies. From Figure ZJ4- the resistance
equals the real impedance when the frequency equals zero i.e. at the intercept
on the x-axis. The capacitance is calculated from the equation:
oRC = 1 (2.10)
using the frequency (co) when Z” is at a maximum.
Real ceramic materials can consist of many like parallel RC elements,
connected in series. The equivalent circuit, for example, yttria-stabilised zirconia materials consists of three parallel RC elements and a diffusion