Client-side Energy Costs of Video Streaming
Oche Ejembi
School of Computer Science University of St Andrews, Fife, UKEmail: ooe@st-andrews.ac.uk
Saleem N. Bhatti
School of Computer Science University of St Andrews, Fife, UKEmail: saleem@st-andrews.ac.uk
Abstract—Through measurements on our testbed, we show how users of Netflix could make energy savings of up to 34% by adjusting video quality settings. We estimate the impacts of these quality settings on the energy consumption of client systems and the network. If users exercise choice in their video streaming habits, over 100 GWh of energy a year could be saved on a global scale. We discuss how providing energy usage information to users of digital video could enable them to make choices of video settings to reduce energy usage, and we estimate savings on associated electricity costs and carbon emissions.
I. INTRODUCTION
Video-on-Demand (VoD) is by far the most popular type of traffic on the Internet and its use is growing. According to the Sandvine Global Internet Phenomena report for 1H 2014 [1], VoD was responsible for 64% of all the downstream traffic experienced on fixed networks, and 40% on mobile networks in the US, with similarly large proportions experienced in Europe, Asia-Pacific, and Latin America. Cisco estimates that by 2018, 79% of all the world’s Internet traffic will be some form of video [2].
However, video consumes more resources – network capac-ity, device CPU utilisation, memory, I/O, disk space etc. – than the other popular uses of the Internet, such as text, audio and still images. So, video also consumes more energy.
A. Contributions and Structure
We measure the client-side energy usage of the popular video-on-demand service provider Netflix to make global Fermi estimates of how much energy could be consumed by users of this particular service. We make suggestions on how this energy usage could be reduced or made more sustainable. Our contributions are:
1) Using a simple measurement methodology, we make an empirical assessment of the client-side energy usage of the world’s most popular premium VoD provider. We then make global estimates of how much energy is consumed by this service’s subscribers.
2) We examine the network characteristics of this video application and investigate the energy impacts of the traffic at the client side.
3) Finally, we discuss ways in which these users could be empowered to make choices towards saving energy while using VoD services, based on measured energy usage information, and feedback to the users.
In Section II, we discuss recent, related work. This is followed by a presentation of our experiment methodology,
testbed and measurement strategies in Section III, with the results from our experiments in Section IV. We analyse the results in Section V, including a discussion of the implications for real-world scenarios in Section VI. Finally, we conclude and present avenues for future work in Section VII.
II. RELATEDWORK
Research in Green ICT and energy efficient systems now covers a wide range of topics. There have been high-level, analytical investigations of ICT energy usage e.g. Somavat et el. [3] for energy-efficient data- centres and servers [4], to user studies towards reducing energy usage in ICT [5].
Considering the scale of Internet traffic attributed to video, a surprisingly small amount of work has specifically looked at energy usage of multimedia, especially for non-mobile systems. Non-mobiles are responsible for the bulk of video traffic – 60% according to Nielsen [6] – and so also for the associated energy use and carbon emissions. In our previous work [7], we performed an empirical investigation into the energy usage for video decoding and encoding for different popular codecs on a commodity desktop hardware system. We observed a difference of up to a factor of 3 between software codecs for decoding, even at the same picture size (resolution) and bit rate, for our desktop client system. Similarly, Shehabi et al. [8], make an analytical life-cycle assessment of the energy used by streaming video in the US. They identify that the strongest opportunities for significant gains in energy efficiency are at the end-user level and the network.
A considerable amount of research has investigated vari-ous aspects of popular multimedia applications like Netflix, YouTube and BBC iPlayer, similar (in principle) to our focus in this paper e.g [9] and [10]. However, very little work has focused explicitly on the energy usage of these services and applications, and the few that do consider such issues focus on mobile devices with the aim of extending battery life [11]. We take the position that since the bulk of video traffic is consumed by non-mobile devices (according the Sandvine report [1] and Nielsen [6]), it is important to investigate energy usage of non-mobiles, especially as those systems will not have the same level of design or engineering optimisation for energy efficient operation. As the popularity of VoD continues to increase, so will the energy cost and any associated carbon emissions. However, where mains power is easily available, there is the danger that energy consumption by VoD could GreenCom2015 - 11th IEEE Intl. Conf. on Green Computing and Communications, Sydney, AUS, 11-14 Dec 2015
become a large drain on future energy usage, which would impact energy prices and energy supply.
III. METHODOLOGY
The aim of our experiment was to perform an empirical investigation of the energy, bandwidth and resource consump-tion of Netflix during normal playback operaconsump-tions. Based on that energy usage, we have made estimates of the energy consumption of desktop VoD users and how much energy could be saved if users exercise choice in their use of video.
A. Testbed
The testbed is shown Figure 1, with hardware similar to that used for our previous work [7]. For each experiment run, a single client host was used to playback videos streamed from Netflix – two of these units are shown in the left of the Figure 1. Each system is a Shuttle XPC Glamor SG31G2 with an IntelR CoreTM 2 Quad Q6600, 2.40GHz CPU, Intel
82G33/G31 chipset using an Express Integrated Graphics Controller core, with 4GB DRAM (128MB used for graphics, configured in the BIOS). To examine the effects of hardware-assisted video decoding, we performed experiments with a PCI-express NvidiaR G86 GeForceTM8400GS with 256MB
GDRAM housed in one of the systems. Both clients were connected to the Internet using 1Gbps Ethernet links to the University’s Joint Academic Network (JANET) connection, the UK NREN. This connectivity offers download rates that are well above the UK household average – a download rate of 600 Mbps has been observed, compared to the UK household average in 2014 of 18.7 Mbps [12]. So we were able to observe Netflix traffic in near ideal network conditions (little or no capacity bottleneck and/or congestion on the end-to-end path). The client hosts ran a minimal installation of Ubuntu Linux (v13.10 64-bit x86-64 server), and with a minimal set of back-ground processes running. This was to avoid any unnecessary load on the machines when measuring energy usage. We used the lightweight Openbox window manager, and the Mozilla Firefox (v29.0) web browser with the Pipelight plugin (v0.2.6, a Linux port of Silverlight, version 0.2.6) for playback of video content from the Netflix UK website. We measured energy usage through a Kill-a-Watt power meter 1, modified to send
power readings via a short-range radio link to a USB receiver on the experiment controller at 1-second intervals.
B. Measurement regime
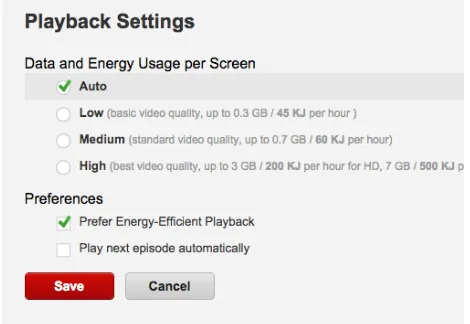
The Netflix homepage presents a wide selection of titles which a user may be interested in. These videos are se-lected using Netflix’s recommender algorithm, which takes into consideration user preferences and viewing history. We were presented with 202 unique titles for viewing. To gain a wide and representative sample space, we decided to run our experiments on them all. On personal computers/laptops users may select one of three preferred quality levels (LOW, MEDIUM and HIGH), or may allow Netflix to automatically
[image:2.612.313.568.51.191.2]1http://www.p3international.com/products/p4400.html
Fig. 1: Our video playback testbed. The black Shuttle systems (centre) were used for the playback experiments, and are connected to the Kill-A-Watt/MoteWatt power meter (centre-left, just above the keyboard). The mini-tower on the left is the experiment-controller, not part of the system being measured. The energy consumption of the display units was not measured: one shows the video being played back (centre), the other shows part of the measurement system (right).
choose based on current network conditions. This quality selection page is shown in Figure 2.
Fig. 2: Netflix playback quality settings for selection by the user.
[image:2.612.330.543.311.454.2]IV. RESULTS
We captured the CPU utilisation, memory usage, network usage and power consumption at 1 second intervals. In Figure 3, we present summary results from the entire corpus. This shows, as expected, that there is a difference (comparing medians) in energy usage, CPU utilisation and network us-age, between LOW, MEDIUM and HIGH quality playback. However, given the diversity of content, there are overlaps at the extreme ranges of values for LOW, MEDIUM and HIGH. For example, some HIGH quality streams use less energy than some LOW quality streams (Figure 3a).
A. Energy usage metric for video
Previously (see [7]), we have defined energy metrics for video. Pdv represents the amount of energy used to de-code/playback a second of a given video on a given system:
Pdv=
energy usage for video decoding/playback
tv
=Pa Pidle (1)
where Pdv is the mean energy usage per second of video (J/sv) by video decoding/playback (Pdv), and tv is the duration of the video stream in seconds. Pa is the mean measured power of the system during encoding or decoding of the video.Pidleis the mean measured power when the system lies idle, as summarised in Table I. The unitsJoules per second (of video content), i.e. J/sv are used instead of Watts (W =
J/s) to make clear the different assessment we are making, and to allow comparison directly with a similar metric, Pev, for encoding video, even when encoding is not real-time.
TABLE I: Definitions forPdv(Eqn. (1)). Pdv mean energy usage per second for video decoding [J/sv]
Pa measured meansystempower usage during video playback [W]
Pidle mean system power usage when idle [W]
tv duration of video sample [s]
B. Energy Usage
We captured the system wide energy usage when playing back video streams at the three available video qualities. This energy usage was a system-wide measurement, the result of a combination of several individual components of the computer such as the CPU, the memory and the network interface. We chose to investigate the energy use of system as a whole as we argue that this would be more relevant and significant to users / applications trying to be energy-aware: this is the real energy usage seen by the user when the application is running. However, different system components will have different energy usage (see Section IV-C).
In Figure 3a, we present standard boxplots of the mean energy used in video playback (Pdv) at the three available quality levels (i.e. LOW, MEDIUM and HIGH). This chart is a summary of our entire experiment’s corpus of 202 Netflix videos, grouped by the three quality levels. Each data point used for the boxplot is the mean energy used in decoding
(as calculated by equation 1) of 5 repetitions of a 2-minute playback of a single video title. We obtain average values of 10.8J/sv, 12.7J/svand 14.5J/svfor the respective quality levels. This corresponds to a difference of 34% between LOW and HIGH quality levels.
From Figure 3, we observe some significant variability in the energy and system resource usage over the entire corpus, even at the same quality levels. In Figure 4, we make a more fine-grained analysis of the corpus. We further group the energy usage data by genre. This highly-specific genre classification system is used by Netflix as part of its recommendation mechanism, e.g. a subscriber interested in SciFi and Fantasy films is more likely to watch other films in this genre (or a closely-related one) and as such will be recommended similar movies. The aim of this particular exercise was to investigate whether the general spatial and temporal characteristics of these genre have an effect on the overall energy and system resource used by the various genres. The only definite trend we observe in this case is the difference observed in grouping by quality level across the genres. This is because the genre system used by Netflix is based more on subjective classification of the artistic content of the video titles. However, future work could make a more detailed investigation of the relationship between the spatio-temporal characteristics of videos and energy/system resource usage. In Table II, we list the videos which consumed the least (best-case) and the most (worst-case) energy usage (Pdv). The values are the mean of 5 runs, with a 95% confidence interval that is less than 1J/svto adjust for experimental variation.
Quality Title Genre Pdv
Low ‘The Hobbit (Part 1)’‘Parade’s End’ AAABRF 7.9 (Best)12.8 (Worst )
Medium ‘Would You Rather’‘Fresh Meat (S1E1)’ HRFBRT 9.8 (Best)15.9 (Worst)
[image:3.612.328.546.403.470.2]High ‘Peter Pan’‘Toy Story’ CFFCFF 9.7 (Best)17.3 (Worst)
TABLE II: Comparison of the videos with the best (lowest) and worst (highest) energy usage metrics.
C. System resource usage
We measured the usage of system resources including CPU and memory utilisation, with the Unix process monitoring tool top, and the network bandwidth utilisation, with the opensource network monitoring tooltshark. In Figure 3b and 3c, we show boxplots summarising the CPU utilisation and network bitrate for the entire corpus, grouped by Netflix quality level. Each data point is the mean value for the resource used from 5 repetitions of playback of a video title.
0 5 10 15 20
LOW MEDIUM HIGH
Effective Power Usage Metric,
P
dv
(J/s)
Netflix Video Quality
(a) Mean power usage
0 20 40 60 80 100
LOW MEDIUM HIGH
CPU Utilisation (%)
Netflix Video Quality
(b) Mean CPU utilisation
0 2 4 6 8 10
LOW MEDIUM HIGH
Mean video data per second (Mb/s)
Netflix Video Quality
[image:4.612.55.554.53.182.2](c) Mean bitrate
Fig. 3: Summary of the resource usage (energy, CPU and network) for playback of the entire corpus of Netflix videos at the available quality levels. (202 videos. Each data point is the mean of 5 runs, each run is 120 seconds.)
6 8 10 12 14 16 18
AAA BRF BRT CHF CRF FPN GLF HRF RMC RMD SFF SPF TVC TVD WCF UST
Effective Power Usage Metric
P
dv
(J/s)
Netflix Genres
[image:4.612.52.295.220.395.2]Netflix Quality LOW MEDIUM HIGH
Fig. 4: Summary energy usage for several genres from the corpus of Netflix videos at the available quality levels. (The lines joining the boxplots are visual aids only, showing variation in median values.)
(e.g [3] and [13]) have shown that the CPU is typically the component that consumes the most significant proportion of energy in a system (disregarding the display). Other system components, such as memory and the network interface cards, also contribute to the overall energy usage to a much smaller (but not negligible), extent [13].
D. The effect of hardware decoding
We also investigated the effects of hardware assisted de-coding on energy usage. While most modern processors will have some form of graphics capabilities e.g MMX, SSE, QuickSync (on Intel chipsets), which allow them to playback video efficiently, some systems will also have a dedicated Graphics Processing Units (GPU). GPUs are often intended to support 3D rendering e.g. for gaming, but often also support video playback. The power usage for hardware-assisted video playback compared with that done solely using the CPU are shown in Figure 5. The insertion of our graphics card added 22W to the idle power of our desktop system (up from 78W, to 100W with the card installed). This means that the system consumed much more energy even while idle.
We did not observe any improvements in energy usage for video playback due to the GPU. This might be due to
the Linux environment in which we ran our experiments, in which Silverlight is not natively supported by the GPU drivers. However, the key takeaway point from this is that graphics cards which are optimised for 3D and games support, may not function properly for video, while adding extra idle power consumption to the system. Indeed, modern graphics cards may add upto ⇠40W to system idle power2, but the mean
decoding power with CPU only is typically less than this on our testbed (See Table II).
60 80 100 120 140 160 180
LOW MEDIUM HIGH
System Power Usage,P
a
(W)
Netflix Video Quality CPU playback GPU playback
Fig. 5: System wide power usage for video playback using a CPU vs using a GPU. The GPU adds considerable idle power to the system, but does not offer any gains in efficiency.
E. Network usage and energy implications
The network usage has energy implications not just on an individual client system (more detail in Section V), but on end-to-end delivery. All our experiments were performed within an office environment at the University of St Andrews, Scotland, UK. However, almost all the video traffic originated from Netflix servers located in London, England, UK, ⇠725 Km (⇠450 miles) away (with some small levels of signalling traffic from AWS servers in Luxembourg and Northern Ireland). Using traceroute, we can see that this traffic had to traverse an average of 11 hops, using energy at all the network devices and systems along the path.
In Figure 3c, we see that the bit rate for HIGH quality (mean 5.98 Mbps, maximum: 8.3Mbps) is⇠2.4 times more than for
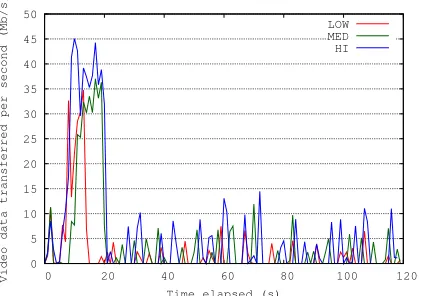
[image:4.612.334.532.340.478.2]LOW quality (mean: 2.39 Mbps, maximum: 2.97 Mbps) for our experimental runs. In Figure 6, we show a snapshot of bitrates sampled over each second for the playback of one video title: ‘House of Cards S1E1’. This graph highlights Netflix’s default streaming behaviour [14]; a large playback buffer is filled at the beginning of a streaming session and then smaller chunks of video are downloaded at intervals as viewing progresses.
0 5 10 15 20 25 30 35 40 45 50
0 20 40 60 80 100 120
Video data transferred per second (Mb/s)
Time elapsed (s)
[image:5.612.70.281.158.306.2]LOW MED HI
Fig. 6: Snapshot of bitrates for playback a single video, ‘House of Cards (S1E1)’, at each Netflix quality level.
We briefly investigated the effect of just the network traffic on the energy consumption at the client. We used iperf to investigate the energy usage of the system due to the NIC. This tool is relatively lightweight; during this test, less than 4% of the CPU and negligible (0-1%) of the memory is used. We found that at the range of bit-rates observed during streaming from Netflix (1 Mbps to 60 Mbps), the power used by the system varies by ⇠1W. So, for our client system, the total energy used is dominated by the energy for processing video playback by the CPU when compared to the NIC.
V. ENERGYSAVINGS ANDTRADE-OFFS
We make estimates on what our observations might translate to when extrapolated to VoD usage at global scales. These estimates are all in the spirit of a Fermi estimate, in order that the research community can understand the significance of impacts from even small savings at individual client systems. A. Estimating energy savings by user devices
In Section IV, we observed that different videos and genres can have widely varying energy usage profiles even at the same quality level, due to the different spatial and temporal characteristics of these videos. For example, a certain video / genre (such as a drama or documentary), may typically have fewer screen changes or inter-frame motion than, say, intense action films. These characteristics will have an impact on how much CPU, and thus energy, is required to playback a given video. This is clear in Figure 3a, where we observe that some videos which are LOW quality actually consume as much energy as other videos which are MEDIUM and HIGH quality. Overall, we do observe a discernible trend in the difference in the median values for energy (and other system resource
usage) with values of 10.8J/sv, 12.8J/svand 14.6J/svfor
Pdv at the three available quality levels on Netflix over the whole corpus. Considering thatJ/svis equivalent to the Watt (W), these differences of⇠2J/svbetween each quality level, might not seem significant for a single system or user.
However, the impact of these differences at a global scale are significant. According to Sandvine [1], the top 15th per-centile of Internet Users in North America are ‘cord- cutters’ – users who no longer have normal TV subscriptions and watch all their content via the Internet. These users consume ⇠100 hours of video per month. So, for such a single Netflix subscriber, with the assumption that the energy difference on their equipment will be similar to our measurements, we can estimate the energy impact of their viewing habits.
Based on our measurements, the savings possible for this user by watching all content in LOW quality instead of HIGH quality would be approximately 3.7J/sv(Joules per second of video playback). For 100 hours of video a month, that sums to 1,332 KJ (0.37 KWh) per month or 15,946 KJ (4.43 KWh) per year. Superficially, this amount of energy appears negligible, so it may be difficult for the individual user to rationalise a decision to watch video at the LOW quality level. Note that this figure does not consider the idle power of the devices used to watch video, just the extra energy required for playback.
Let us scope our Fermi estimate to a global scale. Netflix have claimed that they have over 50 million subscribers3, and
Nielsen4 suggests that roughly 60% (⇠30 million) of Netflix
subscribers watch via a personal computer [6]. (As Netflix continues to expand internationally, this figure is likely to continue to grow.)
Netflix have further claimed that 2 billion hours of video are streamed from their servers every month. For the purpose of this estimate, we shall assume that all this video is streamed to equipment that is similar to ours. Again, at savings of 3.7 J/svby watching all video at LOW quality instead of HIGH, this would be a total of ⇠7.4 million KWh a month or 88.8 million KWh a year. To appreciate the scale of these savings, we shall make an assessment of the impact of what this energy represents in various parts of the world. If these savings where achieved, this would be enough energy required to power 21,382 homes in the United Kingdom or 114,138 homes in India for a year (based on available estimates) – see the summary in Table III, which also presents estimates of CO2 emission savings that are possible in different parts of
the world.
Of course, this is by no means intended as an authoritative or comprehensive estimate, and that is not the aim of this exercise. We simply wish to show the sheer scale of the energy savings potentially possible, and raise awareness of the amount of energy consumed by video streaming. For example, we have made the generalisation that all users have equipment that has similar performance to our testbed and will see similar differences in energy usage. This may not be the
80 85 90 95 100
40 45 50 55 60 65 70 75
Mean System Power, P
a
(W)
Mean CPU Util (%)
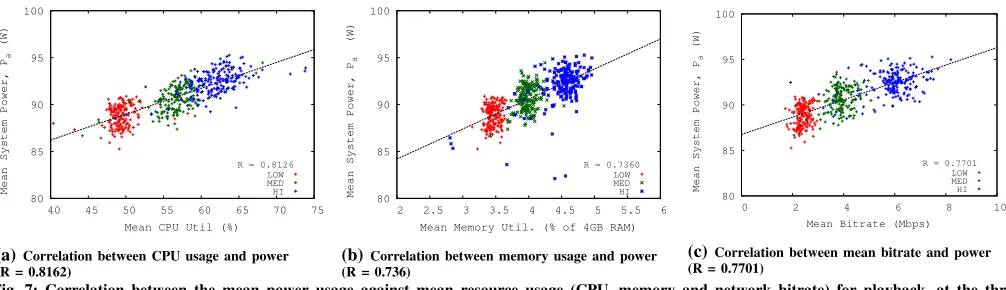
R = 0.8126 LOW MED HI
(a)Correlation between CPU usage and power (R = 0.8162)
80 85 90 95 100
2 2.5 3 3.5 4 4.5 5 5.5 6
Mean System Power, P
a
(W)
Mean Memory Util. (% of 4GB RAM) R = 0.7360
LOW MED HI
(b)Correlation between memory usage and power (R = 0.736)
80 85 90 95 100
0 2 4 6 8 10
Mean System Power, P
a
(W)
Mean Bitrate (Mbps)
R = 0.7701 LOW MED HI
(c)Correlation between mean bitrate and power (R = 0.7701)
[image:6.612.53.556.52.197.2]Fig. 7: Correlation between the mean power usage against mean resource usage (CPU, memory and network bitrate) for playback, at the three quality levels (202 videos). Each data point is the mean of 5 runs, each run is 120 seconds). Memory and bitrate correlations are deceptive!
TABLE III: Estimate of potential annual impact of 88.8GWh savings by user devices based on 24 billion hours of Netflix video playback.
Country Mean KWh/homea No of homes Costb(US$) KgCO2c
India 778 114,138 710 M 34.2M
Nigeria 604 129,824 1,598 M N/A
UK 4153 21,382 1,770 M 15.9M
US 11789 7,532 1,065 M 19.9M
aFrom World Energy Council Data for 20115 bFrom various local electricity boards. chttp://www.wec-indicators.enerdata.eu/
case as some users may make use of more (or less) efficient computing hardware, and devices will have larger differences in energy usage. We have made use of mid-range, inexpensive commodity hardware in our experiments, of a class which might be used by a large proportion of every day Internet users. We have also made these estimates solely based on published statistics for Netflix. There are several other VoD services which have very significant numbers of users and viewing hours, so our numbers are likely to be an underestimate of the overall impact of VoD.
B. Estimating energy savings in the network
Transcoding of Netflix’s content is done using cloud-based infrastructure, with a single title reportedly encoded into⇠50 formats. In our previous work [7], we observed significant differences in energy usage in encoding different codecs, up to 3 orders of magnitude depending on picture settings and codecs. However, this encoding would typically take place in specialized, energy-efficient data centres, along with several other workloads. In this kind of environment, energy usage would be highly controlled and the scope for energy savings may be smaller. Investigating energy-efficient video transcoding is an avenue for future work.
The Internet is extremely heterogeneous in nature, so the various links that the video data traverses will be under different administrative domains, using different media, from fibre optic links, to copper, to wireless, and each having varying energy costs and carbon emissions. A considerable amount of research has investigated the energy usage at the network level, and how this is affected by several different
parameters such as the network media, protocol, and bit-rate etc. For instance, some authors ([15] [16]) have estimated that the network infrastructure of the Internet consumes up to 2% of the World’s generated electricity, corresponding to approximately 420 TWh per year, with variable energy consumption rates observed between 23 KWh to 109 KWh per year per subscriber [17]. Current energy consumption is due to an estimated 600 exabytes of Internet traffic (2013 estimate), which is expected to triple by 2018 [2], of which, as stated previously, an increasing proportion is video.
Other studies have also investigated energy consumption at the network to the bit level. Baliga et al. [18] estimate that the energy consumption of data transmitted over the Internet is 2 - 4µJ/b at higher access rates (<100Mbps), to 75µJ/b at
lower access rates. Similarly, in our previous work [19], we investigated how various wireless access networking technolo-gies (802.11) can consume a varying amount of energy at the client, varying between 0.5 - 1.1µJ/bit for large packet sizes
to 2.3 - 10µJ/b for smaller packet sizes.
TABLE IV: Estimate of potential annual impact of energy usage in the network based on 24 billion hours of streamed Netflix video
Quality Mean bitrate(Mbps) KWh Costa KgCO
2b
LOW 2.40 27.64M GB£4.14M 4.70M MEDIUM 3.90 44.92M GB£6.72M 7.62M HIGH 5.98 68.78M GB£10.30M 11.68M
aFrom [20], mean cost of GB£577 / year per household. bUK government data, 10 May 2014, 0.17 KgCO
2/KWh6.
C. Limitations and future developments
For this study, we have only considered a single desktop hardware configuration. We are conscious that other hardware (and even software) might have very different energy usage patterns. The hardware we use is, however, cheap and widely available, and represents broadly the class of hardware that many end users will use. Furthermore, we only make estimates of energy use based on Pdv, which is the effective (extra) energy required to playback video, disregarding the idle power of the system. This helps in de-biasing our estimates from a single hardware configuration, but might underestimate the overall energy consumption for a device that is dedicated to video playback only.
We have also not considered mobile devices in our ex-periment and estimates. Modern mobile devices usually have hardware assistance for video playback, with special chip-sets which can decode video efficiently, albeit for a limited set of video formats, e.g. H.264, MPEG-2, MPEG-4. Some popular manufacturers have partnered with Netflix for ensuring such device-based support. Personal and anecdotal experience shows that watching video on a mobile device drains the battery much faster than during normal usage. This is another interesting avenue for future work. In any case, the bulk of Netflix content is still watched on non-mobile systems.
For our experiment, we have only considered video up to a maximum resolution of 1080p (HIGH quality). 4K video (also known as 4096p or Ultra High Definition (UHD) TV) is the most recent picture size available, with incremental hardware support in CPUs, displays and smart TVs. At the time of writing (early 2015), Netflix only supports 4K playback on a small subset of smart TVs7). However, as networks become
more capable, and 4K-capable devices become available, then the energy usage of 4K video will become more significant, especially if the calculations we have made here scale linearly for 4K.
As we can see from Figure 2, Netflix states that UHD requires more than double the amount of data for regular HD, and so there will be a proportionate increase in energy consumption and carbon emissions, both in the network and at client devices. This is why it is very important for users and developers to be made aware of the implications of their video streaming habits.
[image:7.612.65.285.71.125.2]6http://www.rensmart.com/Information/KWHToCO2Conversion 7https://help.netflix.com/en/node/13444
Fig. 8: A mock-up of a Netflix quality selection page with very simple energy usage information (compare to Figure 2). This information could be based on a system specific benchmark or crowdsourced usage data.
VI. ENABLINGUSERCHOICE
Ultimately, for energy savings to be made, users have to make choices. We need to make users (i) aware of energy usage; and then (ii) encourage them to make conscious efforts to reduce energy usage. Demand Side Management (DSM) techniques are often used within the power industry to reduce consumers’ demand for energy by encouraging behavioural change through education, information and incentivisation. In previous work [5], we found that ICT system users within a lab environment who were given feedback on their energy usage – and incentives to save energy – were able to reduce energy usage by up to 56% (for a single user). A mean 16% reduction overall was observed across the test group. If digital video users are well-informed about the potential energy usage of their habits, e.g. presented with information about energy usage and consumption, they may be encouraged to reduce energy usage.
A. Informing the user
Previously [7], we introduced the concept of a dynamic energy label for video which would inform a user about the resource usage of the video they are about to watch. This information would be generated based on results from a benchmarking exercise. Based on this information, a user could choose to watch a less resource-intensive video. Figure 8 is a similar concept; a mock-up of a modified Netflix quality selection page (as shown in Figure 2), which presents simple energy usage information to users.
B. Incentives and a question of quality
Netflix users pay higher subscription fees per month to be able to access HD (+GB£1) and UHD (+GB£3) content in the UK8. Thus, it would be difficult for these subscribers
to rationalise the conscious decision to watch lower quality video to save energy (thus wasting the extra money paid for subscription). However, we can look at this from an-other angle. Netflix is implicitly ‘incentivising’ subscribers
to watch lower quality video by offering lower subscription charges. This could be made more explicit. This will mean using lower computing resources and energy, and lowering carbon emissions on client systems, servers and networks. The incentive in this case is financial, but also some users may be incentivised additionally by environmental concerns. We have already estimated the impact of these differences on client devices and on the network in Section V. A cost-benefit analysis of the implications for Netflix and other VoD providers would be an interesting exercise for future work, to see if such an approach is viable: will the reduced revenue from subscriptions be offset by the savings in energy usage by providers?
Indeed, in our ongoing work, we have found that there is little difference in quality of experience (QoE) between HD (1080p) and UHD (2160p), at least using objective measures such as the Y-SSIM metric [21]. This needs further investiga-tion to enable energy-cost-quality trade-offs and incentives to be defined and made available to users.
Other services like YouTube and BBC iPlayer, could use various other types of incentives. For example, YouTube, which is an entity within the wider Google ecosystem, could perhaps offer some form of ‘green kudos’ points, perhaps on Google+ or on other social media networks, showcasing the user’s environmental consciousness to friends and followers. Incentives to save energy at the client-side while using ICT is an interesting area for future work.
VII. CONCLUSION AND FUTURE WORK
We presented our assessment of the energy usage and car-bon footprint of Video-on-Demand (VoD), using the popular Netflix service as a case study. Netflix provides videos in 3 quality settings, LOW, MEDIUM and HIGH. We found, from measurements on 202 Netflix videos across several genres that there is a clear mean difference between the lowest and highest quality of ⇠3.7J/sv(1 J/svis equal to 1 Watt). While this difference or possible savings may appear small for a single client, an estimate on a global scale show just how significant this energy usage actually is for a population of VoD users. We found that there is a possible difference of 88.8 GWh a year, enough to power over 20000 homes in the UK or 100000 homes in India. We also briefly investigated the relationship between the various Netflix genres and energy usage, and the effect of hardware-assisted decoding. Finally, we discussed ways in which users may be empowered to make the conscious decisions to save energy while using digital video services like Netflix.
We have identified several avenues for future work. These include: a finer-grained analyses of the energy usage of video playback across genres / spatio-temporal classification; expanding considerations to mobile and other devices (e.g Smart TVs); exploring green QoE metrics and energy usage feedback for video; and user incentives for saving energy while using digital video. A benchmark tool for video energy usage, based partly on the work presented here, is currently under development.
ACKNOWLEDGEMENTS
This work was partly supported by the IU-ATC project, funded by grant EP/J016756/1 from the Engineering and Physical Sciences Research Council (EPSRC). Oche Ejembi is funded by the Scottish Informatics and Computer Science Alliance (SICSA).
REFERENCES
[1] “Global Internet Phenomena Report 1H 2014,” Jul 2014. [Online]. Available: http://goo.gl/Lb33Wf
[2] Cisco Systems, “Cisco Visual Networking Index 2014,” Jun 2014. [Online]. Available: http://goo.gl/3gZy0z
[3] P. Somavat, S. Jadhav, and V. Namboodiri, “Accounting for the Energy Consumption of Personal Computing Including Portable Devices,” in
e-Energy2010: 1st ACM Intl. Conf. Energy-Efficient Computing and Networking, 2010.
[4] J. Pan, R. Jain, and S. Paul, “Nine lessons learned from a green building testbed: A networking and energy efficiency perspective,” inWCST 2013 - World Congress on Sustainable Technologies, Dec 2013.
[5] Y. Yu and S. N. Bhatti, “The Cost of Virtue: Reward As Well As Feedback Are Required to Reduce User ICT Power Consumption,” in
e-Energy 2014: 5th ACM Intl. Conf. on Future Energy Systems, Jun 2014.
[6] Nielsen Research, “Binging is the new viewing for over-the-top streamers,” Aug 2013. [Online]. Available: http://goo.gl/0uEEFC [7] O. Ejembi and S. N. Bhatti, “Help save the planet: Please do adjust your
picture,” inMM2014: 22nd ACM Intl. Conf. on Multimedia, Nov 2014. [8] A. Shehabi, B. Walker, and E. Masanet, “The energy and greenhouse-gas implications of internet video streaming in the United States,”
Environmental Research Letters, vol. 9, no. 5, 2014.
[9] J. Ramos-munoz, J. Prados-Garzon, P. Ameigeiras, J. Navarro-Ortiz, and J. Lopez-soler, “Characteristics of mobile YouTube traffic,” IEEE Wireless Comms., vol. 21, no. 1, Feb 2014.
[10] V. Adhikari, Y. Guo, F. Hao, M. Varvello, V. Hilt, M. Steiner, and Z.-L. Zhang, “Unreeling Netflix: Understanding and improving multi-CDN movie delivery,” inINFOCOM 2012: Proc. of 31st Annual IEEE Intl. Conf. on Computer Comms., Mar 2012.
[11] M. Hoque, M. Siekkinen, and J. Nurminen, “Energy Efficient Multime-dia Streaming to Mobile Devices: A Survey,”IEEE Comms. Surveys & Tutorials, vol. 16, no. 1, Jan 2014.
[12] “UK fixed-line broadband performance, May 2014,” Oct 2014. [Online]. Available: http://goo.gl/gGx9cI
[13] J. Arjona, A. Chatzipapas, A. Fern´andez, and V. Mancuso, “A Measurement-based Analysis of the Energy Consumption of Data Center Servers,” ine-Energy 2014: 5th ACM Intl. Conf. Future Energy Systems, Jun 2014.
[14] J. Martin, Y. Fu, N. Wourms, and T. Shaw, “Characterizing Netflix bandwidth consumption,” in CCNC 2013: IEEE Conf. on Consumer Comms. and Networking, Jan 2013.
[15] S. Lambert, W. V. Heddeghem, W. Vereecken, B. Lannoo, D. Colle, and M. Pickavet, “Worldwide electricity consumption of communication networks,”Opt. Express, vol. 20, no. 26, Dec 2012.
[16] M. Gupta and S. Singh, “Greening of the Internet,” inProc. of the 2003 Conf. on Apps., Tech., Arch., & Protocols for Computer Comms., 2003. [17] “SMART 2020: Enabling the low carbon economy in the Info. age,” The Climate Group, 2008. [Online]. Available: http://goo.gl/12MNKO [18] J. Baliga, R. Ayre, K. Hinton, W. Sorin, and R. Tucker, “Energy
Consumption in Optical IP Networks,”Journal of Lightwave Technology, vol. 27, no. 13, Jul 2009.
[19] M. Tauber, S. N. Bhatti, and Y. Yu, “Towards Energy-Awareness In Managing Wireless LAN Applications,” inNOMS 2012 - IEEE Network Operations and Mgt. Symp., Apr 2012.
[20] “UK Energy Statistics ,” May 2014. [Online]. Available: http: //goo.gl/gqxSWl