Performance testing of a cross-flow membrane-based liquid desiccant
1
dehumidification system
2
Hongyu Baia, Jie Zhua,*, Ziwei Chena, Lina Maa, Ruzhu Wangb, Tingxian Lib
3 4
aDepartment of Architecture and Built Environment, the University of Nottingham, University 5
Park, Nottingham, NG7 2RD, UK
6
bInstitute of Refrigeration and Cryogenics, Key Laboratory for Power Machinery and 7
Engineering of M.O.E, Dongchuan Rd. 800#, Shanghai Jiao Tong University, Shanghai,
8
200240, China
9 10
Abstract
11
A membrane-based liquid desiccant dehumidification system is one of high energy efficient 12
dehumidification approaches, which allows heat and moisture transfers between air stream and 13
desiccant solution without carryover problem. The system performance is investigated 14
experimentally with calcium chloride, and the impacts of main operating parameters on 15
dehumidification effectiveness (i.e. sensible, latent and total effectiveness) are evaluated, which 16
include dimensionless parameters (i.e. solution to air mass flow rate ratio 𝑚∗and number of 17
heat transfer units 𝑁𝑇𝑈) and solution properties (i.e. concentration 𝐶𝑠𝑜𝑙and inlet temperature
18
𝑇𝑠𝑜𝑙,𝑖𝑛). The sensible, latent and total effectiveness reach the maximum values of 0.49, 0.55, 19
and 0.53 respectively at 𝑚∗= 3.5 and 𝑁𝑇𝑈 = 12, and these effectiveness are not limited by 𝑚∗ 20
and 𝑁𝑇𝑈 when 𝑚∗ > 2 and 𝑁𝑇𝑈 > 10. Both the latent and total effectiveness increase with 21
𝐶𝑠𝑜𝑙 , while almost no variation is observed in the sensible effectiveness. All effectiveness can 22
be improved by decreasing 𝑇𝑠𝑜𝑙,𝑖𝑛. The experimental data provide a full map of main design
23
parameters for the membrane-based liquid desiccant air conditioning technology. 24
25
Keywords: liquid desiccant, membrane-based, dehumidification, performance testing, 26
effectiveness 27
28 29 30 31 32 33 34 35
* Corresponding author. Tel: +44 1158466141. E-mail address: jie.zhu@nottingham.ac.uk.
Nomenclature
37
𝐴 membrane surface area (m2)
𝐴𝐻 absolute humidity (kg m⁄ 3)
𝑐𝑝 specific heat capacity (J/kgK)
𝐶 concentration (%)
𝐶𝑟∗ capacitance ratio
𝑑 width of the rectangular channel (m)
ℎ convective heat transfer coefficient (W m⁄ 2K)
𝐻 height of the rectangular channel (m)
𝐻∗ operating factor
𝑘 thermal conductivity (W m⁄ K)
𝐿 characteristic length of the rectangular channel (m)
𝑚∗ solution to air mass flow rate ratio
𝑚̇ mass flow rate (kg/s)
𝑁𝑢 Nusselt number
NTU number of heat transfer units
𝑁𝑇𝑈𝑚 number of mass transfer units
𝑃 atmospheric pressure (pa)
𝑃𝑣 equilibrium vapour pressure of desiccant solution (pa)
𝑅𝐻 relative humidity (%)
𝑇 temperature (℃)
𝑈 overall heat transfer coefficient (W m⁄ 2K)
𝑉̇ volumetric flow rate (l/min)
𝑊 humidity ratio (kg/kg)
Greeks
𝜀 effectiveness
𝛿 thickness of membrane (m)
𝜌 density (kg m⁄ 3)
Subscripts
𝑎𝑖𝑟 air flow
𝑐𝑟𝑖𝑡 critical value
𝑖𝑛 inlet
𝑚𝑒𝑚 membrane
𝑚𝑖𝑛 minimum value
𝑜𝑢𝑡 outlet
𝑠𝑒𝑛 sensible
𝑠𝑜𝑙 solution flow
𝑡𝑜𝑙 total
38
1. Introduction
39
Buildings consume a significant part of the global total energy, particularly heating, ventilation 40
and air-conditioning (HVAC) systems are responsible for around 50% of the energy consumed 41
in buildings [1]. As a matter of fact, the energy consumption for dehumidification process 42
accounts for 20-40% of the total energy used in HVAC systems, and it can be higher when 100% 43
fresh air ventilation is required for better indoor environment [2]. Without proper air 44
dehumidification, occupants would feel uncomfortable and mildew would grow on building 45
interior walls in the humid region. Furthermore, production safety and quality would be 46
seriously affected by high humidity level [2]. It has been shown that the building energy 47
consumption could be decreased by 20-64% with efficient dehumidification technologies [3]. 48
Currently, cooling coil is mostly preferred for dehumidification [4], which adopts cooled water 49
as the cold medium generated from vapour compression system (VCS). The conventional VCS 50
has advantages of good stability in performance, long life and a reasonable electrical COP 51
(between 2 and 4) [5]. However, the working fluids used in VCS such as 22, 410A and R-52
134A with the high global warming potential are harmful to the environment. Furthermore, 53
VCS consumes substantial amount of electrical energy [6]. In the traditional cooling coil, air 54
dehumidification is undertaken simply by cooling air below its dew point for condensation in 55
order to reduce its moisture content. Normally, this type of dehumidification is followed by 56
reheating the dehumidified air to a desired temperature. Consequently, this combined process 57
consumes a considerable amount of energy to cool (typically using a VCS) and heat (using hot 58
water or electricity) the supply air [7]. 59
In the traditional desiccant system, the vapour pressure gradient between humid air and 60
desiccant results in heat and moisture transfers [8, 9]. The system operates using either solid or 61
liquid desiccant. Solid desiccant system is compact, simple and less subject to desiccant 62
carryover and corrosion problems, while liquid desiccant system has lower regeneration 63
temperature, higher dehumidification capacity and lower air side pressure drop [10]. Liquid 64
desiccants can be regenerated using low-grade heat sources such as solar energy, and the 65
regenerated solution can be used as energy storage medium as well [11]. In such way, the liquid 66
The traditional liquid desiccant system commonly adopts the packed bed, where air and 68
desiccant are in direct contact. Comprehensive researches have been conducted on the direct 69
contact system [12-15], and it has been found that air conditioning energy consumption reduces 70
by up to 26-80% in the hot and humid climate. However, in the direct contact system, small 71
desiccant droplets are carried over by the supply air to the indoor environment, which badly 72
affects the occupant health, building structure and furniture [2]. 73
Recently, selectively permeable membrane has been used to replace the packed bed as the heat 74
and mass transfer medium to overcome the desiccant droplet carryover problem. Semi-75
permeable membrane is able to prevent the solution from carrying over into the supply air, 76
while selectively permitting heat and moisture transfers between the liquid desiccant and supply 77
air [2, 16-20]. The selectively permeable membrane can be classified into two types: parallel 78
plate [21-33] and hollow fiber [34-38]. Several researches have been carried out to investigate 79
the membrane-based dehumidifier performance. For example, Moghaddam et al. [21] 80
experimentally and numerically studied different parameter influences on the steady state 81
performance of a small-scale counter-flow liquid-to-air membrane energy exchanger (LAMEE), 82
these parameters include thermal capacity ratio (𝐶𝑟∗), number of heat transfer units (𝑁𝑇𝑈) and 83
number of mass transfer units (𝑁𝑇𝑈𝑚). Hemingson et al. [22, 23] developed a model of
84
moisture transfer resistance between the membrane and solution for a counter-flow LAMEE, 85
and conducted experimental tests under a range of outdoor weather conditions. Fan et al. [24, 86
25] built a mathematical model for a single cross-flow LAMEE, which is applied to a run-87
around LAMEE system consisting of both dehumidifier and regenerator. The impacts of 𝐶𝑟∗, 88
𝑁𝑇𝑈 and 𝑁𝑇𝑈𝑚 on both sensible and latent effectiveness of the run-around system are 89
evaluated. Seyed-Ahmadi et al. [26, 27] developed a mathematical model to simulate the 90
transient behaviours of a single cross-flow LAMEE and a run-around LAMEE, which is also 91
compared with Fan’s steady state model. Apart from counter and cross flows, an innovative 92
flow configuration, counter-cross flow, has been investigated. Vali et al. [28, 29] modelled a 93
run-around LAMEE system using the counter-cross flow exchangers as dehumidifier and 94
regenerator, and assessed the steady state system performance. Moghaddam et al. [30] studied 95
the effect of the direction of heat and mass transfer inside the counter-cross flow LAMEE 96
through experiment and numerical simulation. However, in the above researches, the 97
fundamental data required for mathematical modelling such as Nusselt number (𝑁𝑢) and 98
Sherwood number (𝑆ℎ) are simply borrowed from well-known books, which are generally 99
obtained under uniform temperature or heat flux boundary condition. Thus they are unable to 100
reflect the real heat and mass transfer properties. To solve this problem, Huang et al. [31] 101
proposed a mathematical model for the cross-flow parallel-plate membrane module to 102
condition. The fundamental data of 𝑁𝑢 and 𝑆ℎ under various aspect ratios are calculated. 104
However, the assumption of a fully developed flow is not reasonable in this model. Accordingly, 105
they [32] improved this model by considering the effect of the developing entrance length on 106
the fluid flow pattern. 107
Most of the researches in literatures focus on numerical modelling of heat and mass transfer in 108
LAMEE. Some of them experimentally assess the LAMEE performance for different heat and 109
mass transfer directions or liquid desiccant types [3] [30]. Some researchers analyse the impacts 110
of 𝑁𝑇𝑈, solution to air mass flow rate ratio (𝑚∗), and solution inlet temperature (𝑇𝑠𝑜𝑙,𝑖𝑛) on
111
whole liquid desiccant air-conditioning system [39]. A few studies investigate the membrane-112
based dehumidifier performance with regard to 𝑁𝑇𝑈, 𝑚∗ and solution inlet concentration (𝐶𝑠𝑜𝑙)
113
[21-25][40]. Thus in order to get a full map of the operating characteristics of a LAMEE, a 114
series of experimental tests are carried out in this study to evaluate the performance of a full-115
scale membrane-based cross-flow liquid desiccant dehumidifier. The experimental results are 116
presented with regard to the four important operating parameters: 𝑁𝑇𝑈, 𝑚∗, 𝑇𝑠𝑜𝑙,𝑖𝑛and 𝐶𝑠𝑜𝑙.
117
This work provides a comprehensive parametric study on the dehumidifier performance 118
through experimental investigations, which supplies valuable data for liquid desiccant air 119
conditioning system design. 120
121
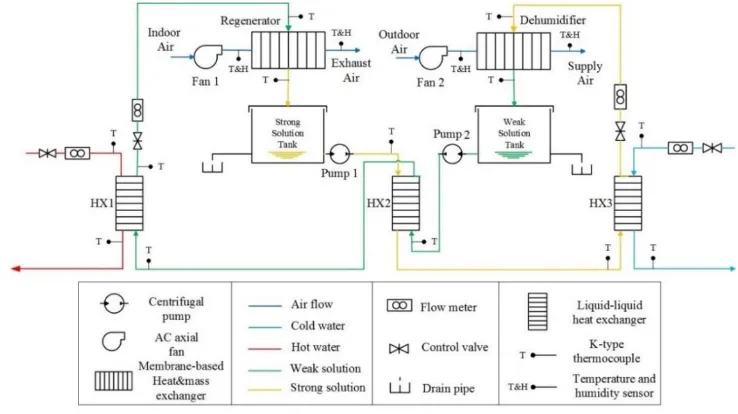
2. Test Apparatus and Instrumentation
122
A test facility is designed and built in the laboratory to assess the performance of a cross-flow 123
membraned-based liquid desiccant dehumidification system under different operating 124
conditions. The test rig mainly consists of a dehumidifier, a regenerator, two solution tanks and 125
three heat exchange units. The schematic diagram of the test rig is shown in Fig. 1, and the 126
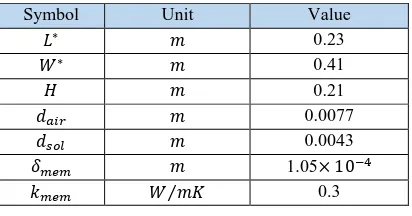
dehumidifier specifications and membrane physical properties are given in Table 1. 127
[image:5.595.85.454.537.744.2]128
Table 1
130
Dehumidifier specifications and membrane physical properties 131
Symbol Unit Value
𝐿∗ 𝑚 0.23
𝑊∗ 𝑚 0.41
𝐻 𝑚 0.21
𝑑𝑎𝑖𝑟 𝑚 0.0077
𝑑𝑠𝑜𝑙 𝑚 0.0043
𝛿𝑚𝑒𝑚 𝑚 1.05× 10⁻⁴
𝑘𝑚𝑒𝑚 𝑊 𝑚𝐾⁄ 0.3
132
2.1 Air loop
133
The outdoor air flows into the dehumidifier where both its moisture content and temperature 134
are reduced by cold desiccant solution, then it leaves the dehumidifier unit at dry and cool state. 135
Its flow rate is controlled by adjusting an AC axial fan rotation speed (ebm-papst Mulfingen 136
GmbH & Co. KG). An air conditioning unit and a humidifier are used to simulate the hot and 137
humid weather condition. The dehumidifier structure is illustrated in Fig. 2. The dehumidifier 138
has a dimension of 410mm (L) x 230mm (W) x 210mm (H) with 11 air channels and 11 solution 139
channels. As can be seen in Fig. 2, wavy polyethylene sheets are used to support the air channels. 140
Air and desiccant solution flows are in a cross configuration. Heat and mass transfer takes place 141
in semi-permeable membranes that separate the air and solution channels. Three gauze layers 142
are paved on the top surface of the dehumidifier unit to ensure even solution distribution. 143
144
145
Fig. 2. Schematic diagram of the dehumidifier 146
[image:6.595.86.497.465.676.2]2.2 Liquid loop
150
Calcium chloride (CaCl2) solution is circulated in the system by two identical pumps (15W
151
centrifugal magnetically driven type with flow rate range of 0-10L/min) and their flow rates are 152
measured by two liquid flow indicators (Parker UCC PET 1-15 L/min). Before entering the 153
dehumidifier, the strong solution is pre-cooled in a brazed plate heat exchanger HX2 by the 154
weak solution, and further cooled in HX3 by cold water. Afterwards, the strong solution is 155
pumped into the dehumidifier and sprayed through a nozzle. Then the strong solution flows 156
downwards in the solution channels, absorbs the moisture from the air and becomes weak 157
solution. The weak solution is then pumped into HX2 for pre-heating, followed by further-158
heating in HX1 by hot water. The heated weak solution is pumped into the regenerator. The re-159
concentrated solution from the regenerator is collected by a stainless steel solution tank. Then 160
the strong solution is pumped out of the strong solution tank to HX2 and a whole circuit is 161
completed. The desiccant solution and air transport properties are listed in Table 2. 162
Table 2
163
Air and desiccant solution transport properties 164
Symbol Unit Value
𝑘𝑎𝑖𝑟 𝑊/𝑚𝐾 0.03
𝑘𝑠𝑜𝑙 𝑊/𝑚𝐾 0.5
𝐷𝑎𝑖𝑟 𝑚2⁄𝑠 2.46× 10⁻⁵
𝐷𝑠𝑜𝑙 𝑚2⁄𝑠 0.892 × 10⁻²
𝑐𝑝,𝑎𝑖𝑟 𝐽 𝑘𝑔𝐾⁄ 1020
𝑐𝑝,𝑠𝑜𝑙 𝐽 𝑘𝑔𝐾⁄ 3200
𝜌𝑎𝑖𝑟 𝑘𝑔 𝑚⁄ 3 1.29
165
2.3 Instrumentation
166
Air velocities through the dehumidifier and regenerator are measured at the air duct outlets by 167
a thermo-anemometer (Testo 405) with a measuring range up to 10m/s. All fans at the inlets of 168
the dehumidifier and regenerator are equipped with infinitely variable speed controllers to 169
adjust air flow rates. All air inlets and outlets are instrumented with humidity and temperature 170
sensors (Sensirion Evaluation KIT EK-H4). Water and desiccant solution temperatures are 171
measured with K-type thermocouples, and all sensors are connected to a DT500 data logger. 172
The dehumidifier, regenerator, heat exchangers, storage tanks and pipes are well insulated to 173
reduce the environment influence. 174
A correlation based on Melinder’s work [41] is used to determine the solution concentration, 175
which is a function of solution density and temperature. The correlation is given as: 176
𝐶𝑠𝑜𝑙 = −253.147703 + 0.0443853996𝑇𝑠𝑜𝑙+ 0.000163666247𝑇𝑠𝑜𝑙2
177
+0.331709855𝜌𝑠𝑜𝑙− 0.000079370267𝜌𝑠𝑜𝑙2 (1)
Where 𝐶𝑠𝑜𝑙 is solution concentration (%). 𝑇𝑠𝑜𝑙is solution temperature (℃) and 𝜌𝑠𝑜𝑙 is solution
179
density (𝑔/𝑚𝑙). The solution density is measured by Brannan hydrometers. All measurement 180
[image:8.595.85.506.156.299.2]devices and their accuracies are listed in Table 3 181
Table 3
182
Measurement devices and uncertainties 183
Device Measurement Range Uncertainty
Testo thermos-anemometer Air velocity 0-10 𝑚/𝑠 ±5% Sensiron Evaluation KIT EK-H4 Temperature -40-125 ℃ ±0.4%
Relative humidity 0-100 % ±3% K-type thermocouple probe Temperature 0-1100 ℃ ±0.75% DT500 Datalogger Data acquisition - ±0.15% Parker UCC PET liquid flow indicator Solution flow rate 1-15 𝐿/𝑚𝑖𝑛 ±5% Parker liquid flow indicator Water flow rate 2-22 𝐿/𝑚𝑖𝑛 ±2% Brannan hydrometer Density 1-1.2 𝑔/𝑚𝑙 ±2% Brannan hydrometer Density 1.2-1.4 𝑔/𝑚𝑙 ±2%
184
2.4 Uncertainty analysis
185
Uncertainty analysis provides a measure of the errors during a measurement associated with a 186
calculated value. Thus it is of vital importance to estimate uncertainties during the experiment. 187
Based on a method of propagation of uncertainties introduced by Taylor [42], when the 188
computed value 𝑞 is any function of several variables 𝑥, ∙ ∙ ∙ , 𝑧, the uncertainty of 𝑞 can be 189
obtained by: 190
𝛿𝑞 = √(𝜕𝑞
𝜕𝑥𝛿𝑥) 2
+ ⋯ + (𝜕𝑞
𝜕𝑧𝛿𝑧) 2
(2) 191
Based on Eq. (2), the absolute uncertainty of a calculated value can be derived. Error bars are 192
included in the graphs for experimental result analyses. The detail uncertainties for all target 193
measurements are given in Appendix. 194
195
3 Experimental methodology
196
The system performance indicators and relevant parameters are defined in this section, and the 197
experimental procedures for dimensionless parameter and solution property tests are presented. 198
3.1 Dehumidifier performance evaluation
199
3.1.1 Operating parameters
200
3.1.1.1 Capacitance ratio (𝐶𝑟∗)
201
Heat capacity rate is defined as the product of specific heat capacity and mass flow rate (𝑊 𝐾⁄ ). 202
Thus the heat capacities of desiccant solution and air are expressed by Eqs. (3)-(4) [43]. 203
𝐶𝑠𝑜𝑙 = 𝑚̇𝑠𝑜𝑙𝑐𝑝,𝑠𝑜𝑙 (3) 204
Where 𝑚̇𝑠𝑜𝑙 is solution mass flow rate (𝑘𝑔/𝑠),𝑚̇𝑎𝑖𝑟 is air mass flow rate (𝑘𝑔/𝑠),𝑐𝑝,𝑠𝑜𝑙 is
206
solution specific heat capacity (𝐽/𝑘𝑔𝐾) and 𝑐𝑝,𝑎𝑖𝑟 is air specific heat capacity (𝐽/𝑘𝑔𝐾).
207
Then the capacitance ratio (or heat capacity rate ratio) 𝐶𝑟∗ is given by Eq. (5) [11].
208
𝐶𝑟∗=𝐶𝐶𝑠𝑜𝑙 𝑎𝑖𝑟=
𝑚̇𝑠𝑜𝑙𝑐𝑝,𝑠𝑜𝑙
𝑚̇𝑎𝑖𝑟𝑐𝑝,𝑎𝑖𝑟 (5)
209
3.1.1.2 Solution to air mass flow rate ratio (𝑚∗)
210
Solution to air mass flow rate ratio is a measurement of relative flow rate of two heat 211
exchanging fluids. In this experiment, the solution to air mass flow rate ratio (𝑚∗) is used since 212
it is a more straight forward parameter. The solution to air flow rate ratio is defined as: 213
𝑚∗= 𝑚̇𝑠𝑜𝑙
𝑚̇𝑎𝑖𝑟 (6)
214
3.1.1.3 Operating factor (𝐻∗)
215
Operating factor is a dimensionless number defined as the ratio between the latent energy 216
difference and sensible energy difference for the air and desiccant solution at the inlets [29]. 217
𝐻∗=∆𝐻𝑙𝑎𝑡
∆𝐻𝑠𝑒𝑛≈ 2500
𝑊𝑎𝑖𝑟,𝑖𝑛−𝑊𝑠𝑜𝑙,𝑖𝑛
𝑇𝑎𝑖𝑟,𝑖𝑛−𝑇𝑠𝑜𝑙,𝑖𝑛 (7)
218
Where 𝑇𝑎𝑖𝑟,𝑖𝑛 and 𝑇𝑠𝑜𝑙,𝑖𝑛 are air and solution temperatures respectively (℃), 𝑊𝑎𝑖𝑟,𝑖𝑛 is air 219
humidity ratio (𝑘𝑔 𝑘𝑔⁄ ) and 𝑊𝑠𝑜𝑙,𝑖𝑛 is solution equilibrium humidity ratio (𝑘𝑔 𝑘𝑔⁄ ).
220
3.1.1.4 Number of heat transfer units (𝑁𝑇𝑈)
221
Effectiveness-NTU method is one of the most commonly used ways for heat exchanger analysis. 222
Compared with log-mean-temperature-difference method, it provides a superior way to analyse 223
heat exchanger in terms of non-dimensional variables[44]. 224
𝑁𝑇𝑈 = 𝑈𝐴
𝐶𝑚𝑖𝑛 (8)
225
𝑈 = [ℎ𝑎𝑖𝑟1 + 𝛿
𝑘𝑚𝑒𝑚+ 1 ℎ𝑠𝑜𝑙] −1 (9) 226
Where 𝑈 is the overall heat transfer coefficient (𝑊 𝑚⁄ 2𝐾), 𝐴 is membrane surface area (𝑚2), 227
𝐶𝑚𝑖𝑛 is the minimum value of air and desiccant solution heat capacity rates (𝑊 𝐾⁄ ), ℎ𝑎𝑖𝑟 is air
228
convective heat transfer coefficient (𝑊 𝑚⁄ 2𝐾), ℎ𝑠𝑜𝑙 is solution convective heat transfer 229
coefficient (𝑊 𝑚⁄ 2𝐾), 𝛿 is membrane thickness (𝑚) and 𝑘𝑚𝑒𝑚 is membrane thermal
230
conductivity (𝑊 𝑚⁄ 𝐾). 231
3.1.1.5 Number of mass transfer units (𝑁𝑇𝑈𝑚)
232
The number of mass transfer units is defined as following: 233
𝑁𝑇𝑈𝑚 = 𝑈𝑚𝐴
𝑚̇𝑚𝑖𝑛 (10)
234
𝑈𝑚 = [ℎ𝑚,𝑎𝑖𝑟1 + 𝛿
Where 𝑈𝑚 is the overall mass transfer coefficient (𝑘𝑔 𝑚⁄ 2𝑠), 𝑚̇𝑚𝑖𝑛 is the minimum mass flow 236
rate of air and desiccant solution (𝑘𝑔 𝑠⁄ ), ℎ𝑚,𝑎𝑖𝑟 is convective mass transfer coefficient of air
237
(𝑘𝑔 𝑚⁄ 2𝑠), ℎ𝑚,𝑠𝑜𝑙 is convective mass transfer coefficient of desiccant solution (𝑘𝑔 𝑚⁄ 2𝑠), 𝛿 is 238
thickness of membrane (𝑚), 𝑘𝑚 is membrane water permeability (𝑘𝑔 𝑚⁄ 𝑠). It has been showed 239
the convective mass transfer coefficient of desiccant solution is much higher than that of the 240
air, thus ℎ 1
𝑚,𝑠𝑜𝑙 can be neglected for the simplicity.
241
3.1.2 Effectiveness
242
Effectiveness is the most important parameter used to evaluate the performance of a heat and 243
mass exchanger [45]. Three types of effectiveness have been defined in this study: sensible 244
effectiveness (𝜀𝑠𝑒𝑛), latent effectiveness (𝜀𝑙𝑎𝑡) and total effectiveness (𝜀𝑡𝑜𝑡). 𝜀𝑠𝑒𝑛 is the ratio
245
between the actual and maximum possible rates of sensible heat transfer in a heat exchanger. 246
𝜀𝑙𝑎𝑡 is the ratio between the actual and the maximum possible moisture transfer rates in a mass
247
exchanger. 𝜀𝑡𝑜𝑡 is the ratio between the actual and maximum possible energy (enthalpy)
248
transfer rates in a heat and mass exchanger. The capacity rate of desiccant solution is higher 249
than that of the air, which means 𝐶𝑟∗≥ 1, then the sensible, latent and total effectiveness are 250
defined by Eqs. (12) - (14). [46]. 251
𝜀𝑠𝑒𝑛 = 𝑇𝑇𝑎𝑖𝑟,𝑖𝑛−𝑇𝑎𝑖𝑟,𝑜𝑢𝑡
𝑎𝑖𝑟,𝑖𝑛−𝑇𝑠𝑜𝑙,𝑖𝑛 (12)
252
𝜀𝑙𝑎𝑡 = 𝑊𝑊𝑎𝑖𝑟,𝑖𝑛−𝑊𝑎𝑖𝑟,𝑜𝑢𝑡
𝑎𝑖𝑟,𝑖𝑛−𝑊𝑠𝑜𝑙,𝑖𝑛 (13)
253
𝜀𝑡𝑜𝑙 =𝜀𝑠𝑒𝑛+𝐻∗𝜀𝑙𝑎𝑡
1+𝐻∗ (14)
254
Where 𝑇𝑎𝑖𝑟,𝑜𝑢𝑡 is air temperature at the outlet (℃) and 𝑊𝑎𝑖𝑟,𝑜𝑢𝑡 is air humidity ratio at the 255
outlet (𝑘𝑔 𝑘𝑔⁄ ).
256 257
3.2 Experimental procedure
258
3.2.1 Dimensionless parameter tests
259
At first, the experiment aims to explore the impacts of number of heat transfer units (𝑁𝑇𝑈) and 260
solution to air mass flow rate ratio (𝑚∗) on the dehumidifier performance. The air inlet 261
condition is set at a temperature of 30℃ and relative humidity (RH) of 70%, and the solution 262
concentration is 39%. 𝑁𝑇𝑈 is set in the range of 4 to 12. For each 𝑁𝑇𝑈, seven tests are 263
conducted with 𝑚∗ set as 0.5, 1, 1.5, 2, 2.5, 3 and 3.5. Because air heat capacity rate is always 264
lower than desiccant solution’s, thus Eq. (8) can be written as: 265
𝑁𝑇𝑈 = 𝑈𝐴
𝑐𝑝,𝑎𝑖𝑟𝑚̇𝑎𝑖𝑟 (15)
266
In order to determine the required air mass flow rate for a corresponding 𝑁𝑇𝑈, the overall heat 267
transfer coefficient (𝑈 value) needs to be decided at first. According to Eq. (9), 𝛿 and 𝑘𝑚𝑒𝑚 are
268
physical properties of the membrane material, so ℎ𝑎𝑖𝑟 and ℎ𝑠𝑜𝑙 need to be determined. In this
experiment, these two parameters are obtained from air side Nusselt number (𝑁𝑢𝑎𝑖𝑟) and
270
solution side Nusselt number (𝑁𝑢𝑠𝑜𝑙).
271
Many literatures have investigated 𝑁𝑢 with different channel aspect ratios based on a constant 272
temperature or heat flux boundary condition. However, according to Huang’s comments [31], 273
these values are unable to accurately reflect heat and mass transfer properties in the membrane 274
module since membrane surface boundary condition is neither uniform temperature 275
(concentration) nor uniform heat flux (mass flux). In literature [31], the natural formed 276
boundary layer has been simulated and the values of 𝑁𝑢 under different channel aspect ratios 277
[image:11.595.202.397.300.445.2]are derived as given in Table 4. 278
Table 4
279
Fully developed Nusselt numbers (𝑁𝑢𝐶,𝑎 for air side and 𝑁𝑢𝐶,𝑠 for solution side) in the
parallel-280
plate membrane channel for various aspect ratios [31] 281
Aspect ratio 𝑁𝑢𝐶,𝑎 𝑁𝑢𝐶,𝑠
1.0 3.12 3.41 1.43 3.23 3.64
2 3.48 4.05
3 4.15 4.74
4 4.61 5.35
8 5.79 6.41
50 7.54 7.91 100 7.7 8.08
∞ – –
282
The air and solution side aspect ratios are 27 and 47 respectively in this study, thus the 283
corresponding Nusselt numbers can be calculated: 𝑁𝑢𝑎𝑖𝑟 = 6.58, 𝑁𝑢𝑠𝑜𝑙 = 7.74 referred to 284
Table 2. The characteristic length of a rectangular channel can be obtained by applying L= 285
(4dH)/ [2(d+H)], where 𝑑 is the channel width (m) and 𝐻 is the channel height (m), which are 286
given in Table 1. For the dehumidifier, the air side and solution side characteristic length are 287
0.015𝑚 and 0.008𝑚 respectively. Subsequently, ℎ𝑎𝑖𝑟 and ℎ𝑠𝑜𝑙 can be derived as 13.16 288
𝑊 𝑚⁄ 2𝐾and 532.13𝑊 𝑚⁄ 2𝐾 respectively. Then the 𝑈 value is calculated as 12.78𝑊 𝑚𝐾⁄ . For
289
a given NTU, the required air mass flow rate can be derived from Eq. (15), correspondingly a 290
series of 𝑚∗ values are obtained. Based on Eq. (6), once the air mass flow rate is determined, a 291
series of solution mass flow rates corresponding to different 𝑚∗ can be obtained as well. All 292
target measurements are shown in Table 5. 293
Table 5
298
Target measurements for dimensionless parameter tests 299
𝑁𝑇𝑈 4 6 8 10 12
𝑚∗ 𝐶𝑟∗ 𝑚̇𝑠𝑜𝑙
(𝑘𝑔 𝑠⁄ ) 𝑉̇𝑠𝑜𝑙
(𝑙 𝑚𝑖𝑛⁄ ) 𝑚̇𝑠𝑜𝑙
(𝑘𝑔 𝑠⁄ ) 𝑉̇𝑠𝑜𝑙
(𝑙 𝑚𝑖𝑛⁄ ) 𝑚̇𝑠𝑜𝑙
(𝑘𝑔 𝑠⁄ ) 𝑉̇𝑠𝑜𝑙
(𝑙 𝑚𝑖𝑛⁄ ) 𝑚̇𝑠𝑜𝑙
(𝑘𝑔 𝑠⁄ ) 𝑉̇𝑠𝑜𝑙
(𝑙 𝑚𝑖𝑛⁄ ) 𝑚̇𝑠𝑜𝑙
(𝑘𝑔 𝑠⁄ ) 𝑉̇𝑠𝑜𝑙
(𝑙 𝑚𝑖𝑛⁄ )
0.5 1.55 0.030 1.292 0.020 0.861 0.015 0.646 0.012 0.517 0.010 0.431 1 3.1 0.061 2.584 0.040 1.722 0.030 1.292 0.024 1.033 0.020 0.861 1.5 4.65 0.091 3.875 0.061 2.584 0.045 1.938 0.036 1.550 0.030 1.292 2 6.2 0.121 5.168 0.081 3.445 0.061 2.584 0.048 2.067 0.040 1.722 2.5 7.75 0.151 6.459 0.101 4.306 0.076 3.230 0.061 2.584 0.050 2.153 3 9.3 - - 0.121 5.167 0.091 3.875 0.073 3.100 0.061 2.584 3.5 10.85 - - 0.141 6.028 0.106 4.521 0.085 3.617 0.071 3.014
300
3.2.2 Solution property tests
301
The next stage of experiment aims to investigate the dehumidifier performance variations with 302
solution inlet temperature (𝑇𝑠𝑜𝑙) and solution concentration (𝐶𝑠𝑜𝑙). In this stage, the air inlet
303
condition is set as 30℃ and 70% RH, and 𝑁𝑇𝑈 and 𝑚∗ are set to be 8 and 2 respectively. The 304
testing range of the solution temperature is from 18℃ to 23℃. For each 𝑁𝑇𝑈, three solution 305
concentrations are tested: 33%, 36% and 39%. Since 𝑁𝑇𝑈 and 𝑚∗ are kept constant, the air and 306
solution flow rates are unchanged. The air mass flow rate is calculated to be 0.030 𝑘𝑔 𝑠⁄ and 307
the solution mass flow rate is 0.061 𝑘𝑔 𝑠⁄ (volume flow rate 2.583 𝑙 𝑚𝑖𝑛⁄ ). 308
For analysis, the air specific humidity or humidity ratio (𝑘𝑔 𝑘𝑔⁄ ) needs to be determined. A 309
correlation between RH (%) and absolute humidity (AH) (𝑘𝑔 𝑚⁄ 3) is derived by Mander [47]: 310
𝐴𝐻 =6.112×𝑒[
17.67×𝑇
𝑇+243.5]×𝑅𝐻×2.1674
1000(273.15+𝑇) (16)
311
Where 𝑇 is air temperature (℃). Then air specific humidity 𝑊𝑎𝑖𝑟 (𝑘𝑔 𝑘𝑔)⁄ can be calculated
312 by: 313
𝑊𝑎𝑖𝑟= 𝐴𝐻
𝜌𝑎𝑖𝑟 (17)
314
Where 𝜌𝑎𝑖𝑟 is air density (kg/m3).
315
The equilibrium specific humidity (𝑊𝑠𝑜𝑙) is used to calculate both the sensible and latent
316
effectiveness, the relationship between the specific humidity and vapour pressure is given by 317
[40]: 318
𝑊𝑠𝑜𝑙= 0.62198 𝑃𝑣
𝑃−𝑃𝑣 (18)
319
Where 𝑃 is the atmospheric pressure (Pa) and 𝑃𝑣 is vapour pressure of desiccant solution (Pa).
320
The equilibrium vapour pressure of desiccant solution is a function of 𝑇𝑠𝑜𝑙 and 𝐶𝑠𝑜𝑙 (𝑃𝑣 =
321
𝑓(𝑇𝑠𝑜𝑙, 𝐶𝑠𝑜𝑙)), the correlation is given by [49]: 322
𝐿𝑜𝑔 𝑃𝑣= 𝐾𝐼 [𝐴 −𝑇−𝐸𝐵
𝑠] + [𝐶 − 𝐷
𝑇−𝐸𝑠] (19)
Where 𝑃𝑣 is solution equilibrium vapour pressure (𝑘𝑃𝑎), 𝐾 is an electrolyte parameter relating
324
to solute (𝐶𝑎𝐶𝑙2); 𝐴, 𝐵, 𝐶, 𝐷 and 𝐸𝑠 are parameters regarding to solvent (water). Accordingly,
325
a psychrometric chart of CaCl2 is plotted and shown in Fig. 3.
326
327
Fig. 3. Psychometric chart of CaCl2
328 329
3.3 Experiment validation based on analytical solution
330
Experimental results are validated by comparing to Zhang and Niu’s analytical solution for 331
enthalpy exchanger with membrane cores. According to their research, the sensible 332
effectiveness is a function of two dimensionless parameters, 𝑁𝑇𝑈 and 𝐶𝑟∗. For unmixed cross
333
flow, the function can be presented as [50]: 334
𝜀𝑠 = 1 − 𝑒𝑥𝑝 [exp(−𝑁𝑇𝑈0.78𝐶𝑟∗−1)−1
𝑁𝑇𝑈−0.22𝐶𝑟∗−1 ] (20)
335
Similar to sensible effectiveness, the latent effectiveness can be calculated: 336
𝜀𝑙 = 1 − 𝑒𝑥𝑝 {𝑁𝑇𝑈𝑚𝑚∗−10.22[exp(−𝑚∗−1𝑁𝑇𝑈𝑚0.78) − 1]} (21)
337
338
4. Results and Discussion
339
Forty five experimental tests have been conducted to achieve the objectives of this study. Based 340
on the experimental results, the influences of main operating parameters on the system 341
performance are analysed. 342
4.1 Effects of dimensionless parameters
343
Two dimensionless parameters, 𝑚∗and 𝑁𝑇𝑈, are examined to identify their influences on the 344
dehumidifier performance, experimental results are compared to Zhang’s analytical solution 345
[image:13.595.159.437.138.353.2][50]. The effectiveness experimental and analytical results under 𝑚∗= 0.5 and 1 are shown in 346
348
Fig. 4. Experimental and analytical results of sensible and latent effectiveness under 𝑚∗= 0.5 349
350
351
Fig. 5. Experimental and analytical results of sensible and latent effectiveness under 𝑚∗= 1 352
353
The variation trends of experimental data are similar to that of the analytical results for both 354
sensible and latent effectiveness under 𝑚∗= 0.5 and 1. However, the sensible effectiveness 355
discrepancies between them are significant, and the analytical results are higher for both 𝑚∗. 356
The discrepancies between experimental and analytical results are caused by the following 357
assumptions. Firstly, membrane frosting, membrane fouling, and mal-distribution effects are 358
[image:14.595.138.460.360.611.2]as thickness and thermal conductivity, are not considered in the analytical models. Last but not 360
least, the laminar flow is assumed for the air stream in the models to calculate convective heat 361
and mass transfer coefficients. However the amount of heat and mass transfer enhancements 362
are not considered, which could be another source of discrepancy between experimental and 363
analytical results. 364
The variations of the sensible, latent and total effectiveness with 𝑚∗and 𝑁𝑇𝑈 are shown in 365
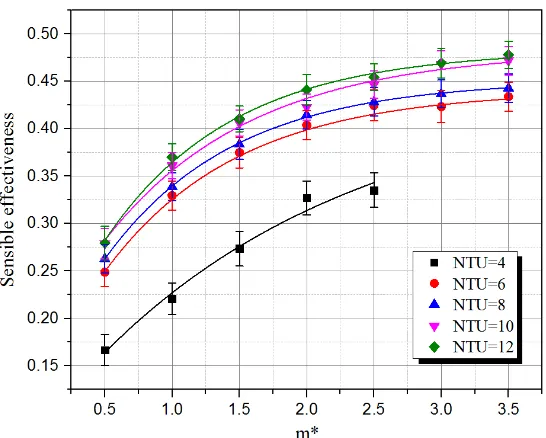
Fig.6. Comparatively the sensible effectiveness is the lowest one among these three 366
effectiveness at the same 𝑚∗ and 𝑁𝑇𝑈, while the latent effectiveness is the highest one. The 367
maximum values of the sensible, latent and total effectiveness are 0.478, 0.561 and 0.539 368
respectively when 𝑚∗ = 3.5 and 𝑁𝑇𝑈 = 12. Oppositely, the lowest values of these effectiveness 369
are 0.167, 0.181, and 0.177 when 𝑚∗ = 0.5 and 𝑁𝑇𝑈 = 4. The separate effects of 𝑚∗ and 𝑁𝑇𝑈 370
are addressed in the following sections. 371
[image:15.595.76.524.308.435.2]372
Fig. 6. Variations of effectiveness: (a) sensible effectiveness (b) latent effectiveness and (c) 373
total effectiveness with𝑚∗and 𝑁𝑇𝑈 374
375
4.1.1 Effect of mass flow rate ratio𝑚∗
376
The effectiveness under each testing condition can be obtained on the basis of the theories in 377
section 3.1. One example of the effectiveness at 𝑁𝑇𝑈 = 6 is given in Table 6, the variations of 378
the sensible, latent and total effectiveness with m* under different 𝑁𝑇𝑈𝑠 are shown in Figs. 7– 379
[image:15.595.85.507.631.734.2]9. 380
Table 6
381
Sensible, latent and total effectiveness at 𝑁𝑇𝑈 = 6 and 𝐶𝑠𝑜𝑙= 39% 382
m* Cr* 𝑇𝑎𝑖𝑟,𝑖𝑛
(℃)
𝑇𝑎𝑖𝑟,𝑜𝑢𝑡 (℃)
𝑇𝑠𝑜𝑙,𝑖𝑛
(℃) 𝜀𝑠𝑒𝑛 H*
𝑊𝑎𝑖𝑟,𝑖𝑛 (𝑘𝑔/𝑘𝑔)
𝑊𝑎𝑖𝑟,𝑜𝑢𝑡 (𝑘𝑔/𝑘𝑔)
𝑊𝑠𝑜𝑙,𝑖𝑛
(𝑘𝑔/𝑘𝑔) 𝜀𝑙𝑎𝑡 𝜀𝑡𝑜𝑡𝑎𝑙 0.5 1.565 30.293 28.710 19.909 0.249 2.874 0.0180 0.0152 0.0061 0.3093 0.2937
1 3.13 30.045 27.788 20.162 0.329 3.050 0.0182 0.0146 0.0062 0.3728 0.3622 1.5 4.695 30.416 27.952 21.178 0.375 3.173 0.0183 0.0145 0.0066 0.3972 0.3919 2 6.26 29.981 27.178 20.564 0.404 3.158 0.0182 0.0138 0.0063 0.4389 0.4305 2.5 7.825 29.652 26.894 20.804 0.425 3.265 0.0180 0.0137 0.0064 0.4446 0.4399 3 9.3 29.468 26.835 20.890 0.423 3.416 0.0182 0.0139 0.0065 0.4361 0.4332 3.5 10.85 29.790 26.701 20.369 0.434 2.981 0.0175 0.0133 0.0063 0.4435 0.4411
384
Fig. 7. Sensible effectiveness variations with m* under different 𝑁𝑇𝑈𝑠 385
386
387
Fig. 8. Latent effectiveness variations with m* under different 𝑁𝑇𝑈𝑠 388
[image:16.595.166.433.348.562.2]390
Fig. 9. Total effectiveness variation with m* under different 𝑁𝑇𝑈𝑠 391
392
It is evident that the sensible, latent and total effectiveness increase with 𝑚∗. For instance, at 393
𝑁𝑇𝑈= 6, the sensible effectiveness increases from 0.249 to 0.434 as 𝑚∗ changes from 0.5 to 394
3.5. In the meanwhile, the latent and total effectiveness increase from 0.309 to 0.444 and from 395
0.294 to 0.441 respectively. However, the gradients of their increases become less moderate 396
when 𝑚∗ is in the range of 0.5 to 2, and a slight variation is observed once 𝑚∗ is over 2. Similar 397
effects of mass flow rate ratio are presented in literature [29], these effectiveness (sensible, 398
latent and total) reach the maximum values and the dehumidification system has the highest 399
efficiency when heat capacitance ratio 𝐶𝑟∗ reaches a critical value 𝐶𝑟𝑐𝑟𝑖𝑡∗ (around 6.26). These
400
effectiveness increase with 𝐶𝑟∗ and is more sensitive to 𝐶𝑟∗ at lower 𝐶𝑟∗ [51, 52]. As the heat 401
capacitance ratio 𝐶𝑟∗ is proportional to the mass flow rate ratio 𝑚∗, the effectiveness variations 402
with 𝑚∗ are similar to that with 𝐶𝑟∗. Therefore a similar critical value of 𝑚∗ is defined as 𝑚𝑐𝑟𝑖𝑡∗ , 403
which is 2 in this study. A similar trend obtained from numerical modelling is found in 404
literatures [24, 25], both the sensible and latent effectiveness increase with 𝑚∗ when 𝑚∗< 1, 405
but they are nearly constant when 𝑚∗≥ 1. So in most cases, it is desirable to maintain the 406
dehumidification system operating at a condition where 𝑚∗ is equal to 𝑚𝑐𝑟𝑖𝑡∗ . It is also worth 407
mentioning that at a low 𝑁𝑇𝑈, all effectiveness are very low especially for the latent 408
effectiveness. For instance, at 𝑁𝑇𝑈 = 4, the latent effectiveness is in the range of 0.181 to 0.265. 409
Thus there is hardly benefit to increase 𝑚∗ or 𝐶𝑟∗ for performance improvement at low NTU. 410
On the other hand, the increase rate of the sensible effectiveness is more significant compared 411
with that of the latent effectiveness at the same 𝑁𝑇𝑈. For instance, at 𝑁𝑇𝑈 = 6, the sensible 412
effectiveness only rises by 43%. Similarly, at 𝑁𝑇𝑈 = 8, the sensible effectiveness increases by 414
68% in the same mass flow rate ratio range, whereas the latent effectiveness rises only by 35.4%. 415
416
4.1.2 Effect of number of heat transfer units𝑁𝑇𝑈 417
418 419 420 421 422 423 424 425 426 427
428
429 430 431 432
433
Fig. 11. Latent effectiveness variations with 𝑁𝑇𝑈 under different 𝑚∗ 434
[image:18.595.170.440.447.658.2]435
436
Fig. 12. Total effectiveness variations with 𝑁𝑇𝑈 under different 𝑚∗ 437
438
The variations of three effectiveness with 𝑁𝑇𝑈 under different 𝑚∗ are presented in Figs. 10-12. 439
Compared to the flow rate, the non-dimensional group 𝑁𝑇𝑈 is a comprehensive indicating 440
parameter because it eliminates the impact of channel geometric properties. Significant 441
increases of the sensible, latent and total effectiveness with 𝑁𝑇𝑈 can be found when 𝑁𝑇𝑈 is in 442
the range of 4 to 6, and the associated gradients reduce from 𝑁𝑇𝑈 = 8 and at the end the 443
gradients are becoming negligible. These trends indicate that at a high 𝑁𝑇𝑈, the effectiveness 444
improvements are no longer limited by 𝑁𝑇𝑈, in other words, increasing 𝑁𝑇𝑈 will not enhance 445
the system efficiency. Similar to 𝐶𝑟𝑐𝑟𝑖𝑡∗ and 𝑚𝑐𝑟𝑖𝑡∗ mentioned previously, a critical 𝑁𝑇𝑈 exists 446
and is defined as 𝑁𝑇𝑈𝑐𝑟𝑖𝑡. All effectiveness reach the maximum as 𝑁𝑇𝑈 reaches the critical
447
value 𝑁𝑇𝑈𝑐𝑟𝑖𝑡, which is 8 in this experiment. These results show a good agreement with
448
numerical simulation data of a cross-flow air-to-air enthalpy exchanger with hydrophilic 449
membrane cores in literature [53]. The effectiveness of the enthalpy exchanger increase with 450
𝑁𝑇𝑈 when 𝑁𝑇𝑈 is in the range of 0 to 5 and the increase gradients become moderate when 451
𝑁𝑇𝑈 is greater than 5. A similar effectiveness variation trend is indicated in literature [39] as 452
well, both the supply air humidity ratio and temperature decrease as 𝑁𝑇𝑈increases from 1 to 453
10. However, less significant effects on the system performance are noted when 𝑁𝑇𝑈 > 10. 454
456
Fig. 13. Effectiveness variations with 𝑁𝑇𝑈 under 𝑚∗= 3.5 457
458
The variations of the sensible, latent and total effectiveness with 𝑁𝑇𝑈 at 𝑚∗= 3.5 are plotted in 459
Fig. 13. The maximum sensible effective is around 0.478 at 𝑁𝑇𝑈= 12, while the maximum 460
latent and total effectiveness are approximately 0.561 and 0.539 respectively. At the same 𝑚∗, 461
the latent effectiveness is higher than the sensible effectiveness. One reason restricting the 462
sensible effectiveness is high cold water temperature. The sensible effectiveness is limited 463
seriously by the inlet solution temperature, which depends on the cold water temperature in the 464
system. Another reason is that the solution cannot be evenly spayed to the membrane surface, 465
especially at high 𝑁𝑇𝑈 and low 𝑚∗, for example when the solution mass flow rate is very low. 466
Therefore, spray nozzle with a larger volumetric spray distribution pattern should be used to 467
improve dehumidification performance. The latent effectiveness is strongly affected by the 468
membrane vapour diffusion resistance, which is related to membrane water permeability. Thus 469
the latent effectiveness can be improved by increasing the membrane water permeability [54]. 470
This can be implemented by utilizing porous membranes or increasing membrane surface area 471
[28, 29]. However, the porous membrane that has lower vapour diffusion resistance may lead 472
to the problem of droplets carryover. Additionally, the bigger size membrane results in higher 473
air pressure drop, and thus more fan power is required. Moreover, the crystallization of the 474
desiccant would considerably affect heat and mass transfer in the dehumidifier by changing the 475
membrane water permeability [28]. As a result, investigations in the optimum membrane 476
vapour diffusivity with considerations of latent effectiveness, carryover and fan power are 477
needed for further research. 478
[image:20.595.143.451.76.323.2]To sum up, both the sensible and latent effectiveness of dehumidifier reach their maximum 480
values at𝑚𝑐𝑟𝑖𝑡∗ = 2 and 𝑁𝑇𝑈𝑐𝑟𝑖𝑡= 8, and the gradients of their increases hardly change as 𝑚∗ is
481
over 𝑚𝑐𝑟𝑖𝑡∗ and 𝑁𝑇𝑈 is over 𝑁𝑇𝑈𝑐𝑟𝑖𝑡. The sensible effectiveness can be improved by utilizing
482
spray nozzle with a larger volumetric spray distribution pattern, and the latent effectiveness can 483
be enhanced by increasing membrane water permeability. 484
485
4.2 Effects of solution properties
486
The influences of desiccant solution properties on the system performance are investigated, the 487
main parameters of the solution properties are solution concentration 𝐶𝑠𝑜𝑙 and inlet temperature
488
𝑇𝑠𝑜𝑙,𝑖𝑛. The variations of the sensible, latent and total effectiveness with 𝐶𝑠𝑜𝑙 and 𝑇𝑠𝑜𝑙,𝑖𝑛 are
489
presented in Fig. 14, with 𝑁𝑇𝑈 and 𝑚∗ set at 8 and 2 respectively. The sensible effectiveness 490
reaches the maximum value of 0.446 when 𝐶𝑠𝑜𝑙 = 33% and 𝑇𝑠𝑜𝑙,𝑖𝑛 = 18℃, and its minimum
491
value is 0.424 when 𝐶𝑠𝑜𝑙 = 39% and 𝑇𝑠𝑜𝑙,𝑖𝑛 = 23℃. By contrast, the maximum latent 492
effectiveness is 0.538 at 𝐶𝑠𝑜𝑙 = 39% and 𝑇𝑠𝑜𝑙,𝑖𝑛 = 18℃, and its minimum value is 0.372 at 𝐶𝑠𝑜𝑙 493
= 33% and 𝑇𝑠𝑜𝑙,𝑖𝑛 = 23℃. For the total effectiveness, its maximum value is 0.510 at 𝐶𝑠𝑜𝑙 = 39%
494
and 𝑇𝑠𝑜𝑙,𝑖𝑛 = 18℃, and the minimum one is 0.389 when 𝐶𝑠𝑜𝑙 = 33% and 𝑇𝑠𝑜𝑙,𝑖𝑛 = 23℃. The 495
effects of 𝐶𝑠𝑜𝑙 and 𝑇𝑠𝑜𝑙,𝑖𝑛 on the effectiveness are analysed separately in the following sections.
496
[image:21.595.98.516.422.543.2]497
Fig. 14. Variations of effectiveness: (a) sensible effectiveness (b) latent effectiveness and (c) 498
total effectiveness with 𝐶𝑠𝑜𝑙 and 𝑇𝑠𝑜𝑙,𝑖𝑛
4.2.1 Effect of solution concentration 𝐶𝑠𝑜𝑙
509
[image:22.595.154.432.105.328.2]510
Fig. 15. Sensible effectiveness variations with 𝐶𝑠𝑜𝑙 under different 𝑇𝑠𝑜𝑙,𝑖𝑛
511
512
Fig. 16. Latent effectiveness variations with 𝐶𝑠𝑜𝑙 under different 𝑇𝑠𝑜𝑙,𝑖𝑛
514
Fig. 17. Total effectiveness variations with𝐶𝑠𝑜𝑙 under different 𝑇𝑠𝑜𝑙,𝑖𝑛
515 516
The solution concentration has a significant effect on the system performance since it is directly 517
related to the surface vapour pressure. The variations of the effectiveness with 𝐶𝑠𝑜𝑙 are shown
518
in Figs. 15-17, it can be seen that increasing concentration has different impacts on the sensible, 519
latent and total effectiveness. The sensible effectiveness is negatively related to 𝐶𝑠𝑜𝑙, while the 520
latent and total effectiveness are positively related to 𝐶𝑠𝑜𝑙. At the inlet solution temperature of 521
21℃, the sensible effectiveness decreases from 0.442 to 0.439 as the solution concentration 522
increases from 33% to 39%, while the latent and total effectiveness increase from 0.402 to 523
0.434 and from 0.414 to 0.435 respectively. The sensible effectiveness is insensitive to the 524
solution concentration as only a slight decrease with the concentration can be seen. This is 525
because the increase of latent effectiveness would lead to more latent heat to be released to the 526
air channel during condensation on the solution side membrane surface. In the meanwhile, the 527
convective heat transfer coefficient on the air side is relatively low, as a result, the sensible 528
effectiveness would be slightly decreased. For instance, at 𝑇𝑠𝑜𝑙,𝑖𝑛 = 18℃, the sensible effective 529
decreases by 0.67% when 𝐶𝑠𝑜𝑙 increases from 33% to 39%. Meanwhile, the latent and total
530
effectiveness increase by 19.6% and 13.8% respectively. 531
4.2.2 Effect of solution inlet temperature 𝑇𝑠𝑜𝑙,𝑖𝑛
538 539
[image:24.595.160.430.114.332.2]540
Fig. 18. Sensible effectiveness variations with 𝑇𝑠𝑜𝑙,𝑖𝑛 under different 𝐶𝑠𝑜𝑙
541 542
543
Fig. 19. Latent effectiveness variations with 𝑇𝑠𝑜𝑙,𝑖𝑛 under different 𝐶𝑠𝑜𝑙
[image:24.595.160.432.390.605.2]546
Fig. 20. Total effectiveness variations with 𝑇𝑠𝑜𝑙,𝑖𝑛 under different 𝐶𝑠𝑜𝑙
547 548
The solution inlet temperature 𝑇𝑠𝑜𝑙,𝑖𝑛 is another key parameter influencing the system 549
performance as it is related to the surface vapour pressure as well. It is clearly reflected in Figs. 550
18-20 that unlike the impacts of 𝐶𝑠𝑜𝑙, these effectiveness decrease accordingly with the solution
551
inlet temperature. This is attributed to the reduction of vapour pressure at the solution side. 552
Similar effects are stated in literature [53], the lower solution inlet temperature leads to the 553
lower conditioned air temperature and humidity ratio, which contributes to the higher sensible 554
and latent effectiveness. 555
The impact of 𝑇𝑠𝑜𝑙,𝑖𝑛 on the sensible effectiveness is far less than that on the latent one. This 556
means that the sensible effectiveness is also insensitive to 𝑇𝑠𝑜𝑙,𝑖𝑛 . Similar to the impact of 𝐶𝑠𝑜𝑙,
557
this is mainly due to the fact that the increasing of latent effectiveness would contribute to more 558
latent heat to be released to the air channel during the process of condensation. As a result, the 559
sensible effectiveness is weakened. For instance, at 𝐶𝑠𝑜𝑙 = 33%, the sensible effectiveness
560
decreases by 2.9% as the solution inlet temperature increases from 18℃ to 23℃, while the latent 561
and total effectiveness reduce by 17.3% and by 13.1% respectively. 562
It is also found that at different concentrations, the solution temperature has different effects on 563
the effectiveness. The higher the solution concentration, the more significant effect the solution 564
temperature has. As the solution temperature reduces from 23℃ to 18℃, the sensible 565
effectiveness increases by 4.5% at the solution concentration of 39%, by 3.3% and 3.0% at the 566
solution concentrations of 36% and 33% respectively. In terms of the latent effectiveness, when 567
the solution temperature decreases from 23℃ to 18℃ , the latent effectiveness rises by 28.4% 568
concentration of 33%. Thus decreasing solution temperature would be a more effective way for 570
the performance improvement with the high concentration solution. 571
To sum up, the system can achieve higher latent effectiveness at lower solution temperature 572
and higher concentration, which is clearly noted in Fig. 14 (b). The solution temperature and 573
concentration have more significant influences on the latent effectiveness compared with the 574
sensible effectiveness. As shown in Fig. 14 (a), the sensible effectiveness hardly varies with the 575
solution temperature and concentration. A similar statement is presented in literature [53], 576
which indicates the sensible effectiveness of a cross-flow membrane-based enthalpy exchanger 577
is not sensitive to its operating conditions. The system dehumidification performance can be 578
improved by increasing the solution concentration and lowering the solution inlet temperature. 579
Comparatively, increasing the solution concentration is preferred in the liquid desiccant system, 580
because more energy is needed to achieve lower solution inlet temperature. However, the use 581
of highly concentrated solution could cause the crystallization problem, which leads to fluid 582
mal-distribution, blockage of the channels, high pumping pressure and membrane fouling. 583
Therefore, the solution properties need to be assessed to avoid crystallization risk [54]. 584
585
5. Conclusions
586
The performance evaluation of a cross-flow membrane-based dehumidification system with 587
CaCl2 desiccant solution is carried out experimentally in this study. The influences of main
588
operating parameters on dehumidification effectiveness (sensible, latent and total effectiveness) 589
have been assessed, which include number of heat transfer units (𝑁𝑇𝑈), solution to air mass 590
flow rate ratio (𝑚∗), solution inlet temperature (𝑇𝑠𝑜𝑙,𝑖𝑛) and concentration (𝐶𝑠𝑜𝑙). Following key
591
points can be concluded based on the experimental results: 592
The sensible, latent and total effectiveness increase with 𝑚∗ and 𝑁𝑇𝑈. However, the 593
increase gradients hardly change when 𝑚∗ and
𝑁𝑇𝑈
are over 𝑚𝑐𝑟𝑖𝑡∗ and 𝑁𝑇𝑈𝑐𝑟𝑖𝑡 594respectively. 595
It is desirable to operate the system at the critical condition where 𝑚𝑐𝑟𝑖𝑡∗ = 2 596
and 𝑁𝑇𝑈𝑐𝑟𝑖𝑡= 8. 597
The sensible effectiveness is the lowest one among the three effectiveness at the same 598
𝑚∗ and 𝑁𝑇𝑈, while the latent effectiveness is the highest one. The increase rate with
599
𝑁𝑇𝑈 in the sensible effectiveness is more significant compared to that in the latent 600
effectiveness. 601
The sensible effectiveness can be improved by utilizing spray nozzle with a larger 602
volumetric spray distribution pattern, while the latent effectiveness can be increased by 603
Both the latent and total effectiveness increase with the solution concentration while 605
the sensible effectiveness nearly has no variation. All effectiveness can be improved 606
by decreasing the solution inlet temperature. 607
Increasing solution concentration is a preferable way to improve dehumidification 608
efficiency with less energy consumption. However, the operating condition needs to be 609
assessed to avoid crystallization risk for high concentrated solution. 610
Future research work will be conducted to explore the impacts of various liquid desiccants on 611
the system performance. 612
613
Acknowledgements
614
The work was supported by The Royal Society for International Exchange Exchanges Scheme 615
- 2015 China (NSFC) Cost share. 616
617
Appendix
618
[image:27.595.87.496.399.769.2]Absolute uncertainties for dimensionless parameter tests are given in Table A.1. 619
Table A.1
620
Absolute uncertainties for dimensionless parameter tests 621
𝑚∗ 𝑁𝑇𝑈 𝛿
𝑠𝑒𝑛 𝛿𝑙𝑎𝑡 𝛿𝑡𝑜𝑡 𝑚∗ 𝑁𝑇𝑈 𝛿𝑠𝑒𝑛 𝛿𝑙𝑎𝑡 𝛿𝑡𝑜𝑡
0.5 4 0.01615 0.06213 0.044883 3 8 0.014702 0.042904 0.03229
1 4 0.016724 0.060976 0.044846 3.5 8 0.014907 0.042307 0.032089
1.5 4 0.018229 0.060499 0.045483 0.5 10 0.015979 0.049164 0.036836
2 4 0.017755 0.059658 0.044874 1 10 0.013815 0.043305 0.031994
2.5 4 0.018229 0.061614 0.046308 1.5 10 0.013669 0.041306 0.030547
0.5 6 0.014997 0.051354 0.038294 2 10 0.0141 0.041523 0.030913
1 6 0.015058 0.048103 0.036417 2.5 10 0.014249 0.041133 0.03077
1.5 6 0.016149 0.04873 0.037254 3 10 0.01429 0.039403 0.029659
2 6 0.015396 0.045433 0.034703 3.5 10 0.015076 0.039804 0.030384
2.5 6 0.016223 0.046097 0.035492 0.5 12 0.017679 0.0459 0.035811
3 6 0.016694 0.046315 0.036027 1 12 0.014121 0.044403 0.03252
3.5 6 0.015134 0.046261 0.03485 1.5 12 0.013709 0.04044 0.030115
0.5 8 0.014984 0.048837 0.03626 2 12 0.016475 0.041759 0.032289
1 8 0.014602 0.045189 0.033609 2.5 12 0.014109 0.040556 0.030278
1.5 8 0.015736 0.045647 0.034502 3 12 0.015603 0.039519 0.030438
2 8 0.014731 0.04392 0.032928 3.5 12 0.014506 0.040724 0.030244
Absolute uncertainties for solution property tests are given in Table A.2. 622
Table A.2
623
Absolute uncertainties for solution property tests 624
625
𝑇𝑠𝑜𝑙,𝑖𝑛 (℃) 𝐶𝑠𝑜𝑙 (%) 𝛿𝑠𝑒𝑛 𝛿𝑙𝑎𝑡 𝛿𝑡𝑜𝑡
18.142 33 0.01084 0.053881 0.035335
18.058 36 0.010978 0.04145 0.029275
18.103 39 0.010862 0.037063 0.026455
19.498 33 0.013142 0.055662 0.038496
18.903 36 0.011601 0.042919 0.030657
19.396 39 0.012323 0.038406 0.028218
21.395 33 0.016322 0.065111 0.045988
20.975 36 0.014607 0.046138 0.034533
21.190 39 0.016092 0.04561 0.034219
23.220 33 0.020806 0.075518 0.054722
22.999 36 0.017421 0.054272 0.04077
23.388 39 0.02154 0.049277 0.039237
626 627
References
628
[1] Perez-Lombard L, Ortiz J, Pout C. A review on buildings energy consumption 629
information, Energy Build. 2008; 40:394–398. 630
[2] Huang SM, Zhang LZ. Researches and trends in membrane-based liquid air 631
dehumidification. Renewable and Sustainable Energy Reviews 2013; 28:425-440. 632
[3] Mahmud K, Mahmood GI, Simonson CJ and Besant RW. Performance testing of a 633
counter-cross-flow run-around membrane energy exchanger (RAMEE) system for 634
HVAC applications. Energy Build. 2010; 42(7):1139–1147 635
[4] Grossman G. Solar cooling, dehumidification and air-conditioning. Encyclopedia of 636
Energy 2004:575-85 637
[5] T. Welch, in: H. Carwarardine, K. Butcher (Eds.), CIBSE Knowledge Series: KS13— 638
Refrigeration, CIBSE Publications, London, UK, 2008. 639
[6] Ouazia B, Barhoun H, Haddad K, Armstrong M, Marchand RG, Szadkowski F, 640
Desiccant-evaporative cooling system for residential buildings, in: 12th Canadian 641
Conference on Building Science and Technology, Institute for Research in 642
[7] The CIBSE Journal CPD Programme: liquid desiccant for dehumidification in 644
building air conditioning systems. 645
[8] Daou K, Wang RZ, Xia ZZ. Desiccant cooling air conditioning: a review. Renew 646
Sustain Energy Rev 2006; 10:55-77. 647
[9] Mei L, Dai YJ. A technical review on use of liquid-desiccant dehumidification for air-648
conditioning application. Renew Sustain Energy Rev 2008; 12:662-89. 649
[10] Jain S, Bansal PK, Performance analysis of liquid desiccant dehumidification systems, 650
Int. J. Refrig. 2007; 30(5):861–872. 651
[11] Abdel-Salam M, Ge GM, Fauchoux M, Besant RW, Simonson CJ. State-of-the-art in 652
liquid-to-air membrane energy exchangers (LAMEEs): A comprehensive review. 653
Renewable and Sustainable Energy Reviews. 2014; 39:700-728. 654
[12] Woods J, Kozubal E. Heat transfer and pressure drop in spacer-filled channels for 655
membrane energy recovery ventilators. Appl Therm Eng 2013; 51:770-80. 656
[13] Dai YJ, Wang RZ, Zhang HF, Yu JD. Use of liquid desiccant cooling to improve the 657
performance of vapour compression air conditioning. Appl Therm Eng 2001; 21:1185-658
202. 659
[14] Pietruschka D, Eicker U, Huber M, Schumacher J. Experimental performance analysis 660
and modelling of liquid desiccant cooling systems for air conditioning in residential 661
buildings. Int J Refrig 2006; 29:110-24. 662
[15] Tu M, Ren CQ, Zhang LA, Shao JW. Simulation and analysis of novel liquid desiccant 663
air-conditioning system. Appl Therm Eng 2009; 29:2417-25. 664
[16] Zhang XR, Zhang LZ, Liu HM, Pei LX. One-step fabrication and analysis of an 665
asymmetric cellulose acetate membrane for heat and moisture recovery. Journal of 666
Membrane Science. 2011; 366(1-2):158-65. 667
[17] Zhang LZ. Progress on heat and moisture recovery with membranes: form 668
fundamentals to engineering applications. Energy Conservation and Management. 669
2012; 63:173–95. 670
[18] Yoon JI, Phan TT, Moon CG, Bansal P. Numerical study on heat and mass transfer 671
characteristic of plate absorber. Appl Therm Eng. 2005; 25:2219-35. 672
[19] Zhang LZ, WangYY, WangCL, XiangH. Synthesis and characterization of a PVA/LiCl 673
blend membrane for air dehumidification. Journal of Membrane Science. 2008;308(1– 674
2):198–206. 675
[20] Liu HM. Preparation and hydrophobic modification of polyvinylidene fluoride. 676
Guangzhou: South China University of Technology; 2011. 677
[21] Moghaddam DG, Oghabi A, Ge GM, Besant RW, Simonson CJ. Numerical model of 678
resistance and air side convective heat transfer coefficient. Appl Therm Eng 2013; 61; 680
245-258. 681
[22] Hemingson HB, Simonson CJ, Besant RW. Steady-state performance of a run- around 682
membrane energy exchanger (RAMEE) for a range of outdoor air conditions. Int J Heat 683
Mass Transfer 2011; 54:1814–24. 684
[23] Hemingson H. The impacts of outdoor air conditions and non-uniform exchanger 685
channels on a run-around membrane energy exchanger. (M. Sc. thesis). Saskatoon, 686
Saskatchewan, Canada: Department of Mechanical Engineering, College of 687
Engineering, University of Saskatchewan; 2010. 688
[24] Fan H. Modelling a run-around heat and moisture recovery system. (M.Sc. thesis). 689
Saskatoon, Saskatchewan, Canada: Department of Mechanical Engineering, College of 690
Engineering, University of Saskatchewan; 2005. 691
[25] Fan H, Simonson CJ, Besant RW, Shang W. Performance of a run-around system for 692
HVAC heat and moisture transfer applications using cross-flow plate exchangers 693
coupled with aqueous lithium bromide. HVAC & R Res 2006; 12:313–36. 694
[26] Seyed-Ahmadi M. Modelling the transient behaviour of a run-around heat and moisture 695
exchanger system. (M.Sc. thesis). Saskatoon, Saskatchewan, Canada: Department of 696
Mechanical Engineering, College of Engineering, University of Saskatchewan; 2008. 697
[27] Seyed-Ahmadi M, Erb B, Simonson CJ, Besant RW. Transient behaviour of run- 698
around heat and moisture exchanger system; part I: model formulation and verification. 699
Int J Heat Mass Transf 2009; 52: 6000-11. 700
[28] Vali A, Simonson CJ, Besant RW, Mahmood G. Numerical model and effectiveness 701
correlations for a run-around heat recovery system with combined counter and cross 702
flow exchangers. Int J Heat Mass Transf. 2009; 52:5827–40. 703
[29] Vali A. Modelling a run-around heat and moisture exchanger using two counter/cross 704
flow exchangers. (M.Sc.thesis). Saskatoon, Saskatchewan, Canada: Department of 705
Mechanical Engineering, College of Engineering, University of Saskatchewan; 2009. 706
[30] Moghaddam DG, Le Poudre P, Besant RW, Simonson CJ. Steady-state performance of 707
a small-scale liquid-to-air membrane energy exchanger for different heat and mass 708
transfer directions, and liquid desiccant types and concentrations: experimental and 709
numerical data. ASMEJ Heat Transfer 2013; 135:1–13. 710
[31] Huang SM, Zhang LZ, Tang K, Pei LX. Fluid and heat mass transfer in membrane 711
parallel parallel-plates channels used for liquid desiccant air dehumidification. Int J 712
Heat Mass Transfer 2012; 55:2571-80. 713
[32] Huang SM, Zhang LZ, Yang M. Conjugate heat and mass transfer in membrane 714
parallel-plates ducts for liquid desiccant air dehumidification: effects of the developing 715
[33] Huang SM, Zhong ZR, Yang ML. Conjugate heat and mass transfer in an internally-717
cooled membrane-based liquid desiccant dehumidifier (IMLDD). J Membr Sci 2016; 718
508:73-83. 719
[34] Zhang LZ, Huang SM, Tang K, Pei LX. Conjugate heat and mass transfer in a hollow 720
fiber membrane module for liquid desiccant air dehumidification: a free surface model 721
approach. Int J Heat Mass Transf 2012; 55(13-14):3789-99. 722
[35] Zhang LZ, Huang SM, Pei LX. Conjugate heat and mass transfer in a cross-flow hollow 723
fiber membrane contractor for liquid desiccant air dehumidification. Int J Heat Mass 724
Transf 2013; 55(25-26):8061-72. 725
[36] Huang SM, Yang ML, Zhong WF, Xu YJ. Conjugate transport phenomena in a counter 726
flow hollow fiber membrane tube bank: Effects of the fiber-to-fiber interactions. J 727
Membr Sci 2013; 442:8-17. 728
[37] Huang SM, Yang ML. Heat and mass transfer enhancement in a cross-flow elliptical 729
hollow fiber membrane contractor used for liquid desiccant air dehumidification. J 730
Membr Sci 2014; 449:184-192. 731
[38] Huang SM, Qin FGF, Yang ML, Yang XX, Zhong WF. Heat and mass transfer 732
deteriorations in an elliptical hollow fiber membrane tube bank for liquid desiccant air 733
dehumidification. Appl Therm Eng 2013; 57:90-98. 734
[39] Abdel-Salam AH, Ge GM, and Simonson CJ. Performance analysis of a membrane 735
liquid desiccant air-conditioning system, Energy Build 2013; 62:559-569. 736
[40] Moghaddam DG, LePoudre P, Ge GM, Besant RW, Simonson CJ. Small-scale single-737
panel liquid-to-air membrane energy exchanger (LAMEE) test facility development, 738
commissioning and evaluating the steady-state performance. Energy and Building 739
2013; 66:424-436. 740
[41] Melinder A. Thermophysical properties of aqueous solutions used as secondary 741
working fluids, in: Energy Technology, KTH Energy and Environmental Technology, 742
Stockholm, 2007. 743
[42] Taylor JR. An Introduction to Error Analysis: The Study of Uncertainties in Physical 744
Measurements, second ed., University Science Books, Sausalito, CA, 1997. 745
[43] Zhang XM, Zhu T, An QS, Ren ZP, Mei FM. Heat Transfer, sixth ed., China 746
Architecture & Building Press, Beijing, 2014. 747
[44] Ghiaasiaan SM. Convective Heat and Mass Transfer, Cambridge University Press, 748
Cambridge 2011. 749
[45] ANSI/ASHRAE STANDARD 84-2013, Method of test for air-to-air heat/energy 750
exchangers, American society of heating, refrigerating, and air-conditioning engineers, 751