research
HRAMIAK, A.
Available from Sheffield Hallam University Research Archive (SHURA) at:
http://shura.shu.ac.uk/2372/
This document is the author deposited version. You are advised to consult the
publisher's version if you wish to cite from it.
Published version
HRAMIAK, A. (2005). A method for the analysis of data from online educational
research. Journal of interactive online learning, 4 (2), 82-93.
Copyright and re-use policy
See http://shura.shu.ac.uk/information.html
A Method for the Analysis of Data from
Online Educational Research
Alison Hramiak
Sheffield Hallam University, UK
Abstract
Much of what can be described as online learning research and analysis advocates the use of software not only to collect the data, for example via an application such as a virtual learning environment, but also to analyze it, using a package such as NUDIST© or NVivo©.
The intention of this article is to provide an alternative method of data analysis for online learning and VLE related research that is essentially paper based. The article describes the use of a paper-based method for data analysis of online learning type research that involves the collection and collation of electronic (and possibly also paper based) data. This method partly builds on the work of Tyler (2001) and has been used on research projects that investigated online learning as a method for widening participation (Hramiak, 2001a, 2002a) and also on a project that involved the e-professional development of staff at a Further Education (FE) college (Hramiak, 2004). Starting with the raw data sets, a distillation process for the data is described. This is followed by an explanation of how the data sets are examined for common themes.
One of the major challenges facing the e-learning researcher is how to analyze the electronic data such as discussion board messages and emails, and then how to understand the implications of this analysis for teaching and learning. Such analysis enables researchers to act upon the situation in order to improve it for the learners, as well as for themselves (Lally, 2000). This is particularly challenging when the messages are not only numerous, in the region of hundreds or even thousands, for a specific research study, but also because they can be both very complicated and very lengthy. Although tools for analyzing communication patterns have been developed in other disciplines, for example in applied linguistics, they are generally based upon the analysis of large bodies of text. They also involve relatively complex and cumbersome methods, and they are not designed for action research use in the immediacy of particular teaching and learning situations (Lally) such as those for which this article is aimed at – namely those in which students/participants are constantly messaging in real time synchronously and asynchronously. Moreover, such tools are not intentionally designed to analyze dynamic, ongoing collaborative and social situations where knowledge is actively being co-constructed by the participants (Lally).
Initial Data Set Definitions
of the research, for example interview data and discussion board messages. Secondary data is that which is used to support the findings of the primary data. The secondary data is that which was a “by-product” of the research; that is, it was not specifically required for the research. Rather, it emerged as a consequence of the research, for example email messages and the tutor’s log.
The analysis involved data that was both quantitative and qualitative, and the start of the process was a determination of which data collected fit into which initial category as defined above. Thus, data were separated into primary or secondary sets as follows (see Table 1).
Table 1
Segregation of Data Sets and Types with Examples of Data Collected from Several Studies
DATA SET DATA TYPE EXAMPLEDATA STUDY 1
EXAMPLE DATA
STUDY 2
EXAMPLE DATA
STUDY 3
Primary Qualitative Interview records
Interview records
Interview records, discussion board messages Primary Quantitative Statistics on
student numbers
Message statistics, access
data,
questionnaire statistics Secondary Qualitative Research
log(Ely, 1991)
Email messages, tutor’s log Secondary Quantitative Access data for
email and tutors log
Table 1 gives data set segregation for a number of studies that involved ICT or e-learning type research that involved the collection of both quantitative and qualitative data. The first study (see Table 1, STUDY 1) investigated the success of widening participation for ethnic minority students of ICT, and used interview data and statistics on student numbers (Hramiak, 2001a). The second study (see Table 1, STUDY 2) involved the collection of interview data and the keeping of a research log (Ely, 1991) for the duration of the research (Hramiak, 2002a). In the study for which the data analysis is described in detail for the purposes of this article, (see Table 1, STUDY 3) there were four sets of primary data and two sets of secondary data. Data for this study comprised interview records, discussion board messages, BlackBoard© questionnaire returns, and Classroom Community Scale (CCS) questionnaire returns (Rovaii, personal communication, May 10, 2002). These were classified as the primary data sets. Email messages and the tutor’s log were classified as the secondary, supporting data sets.
Data Analysis Strategies
general understanding of the data and from this point, using a more holistic approach, progress to a more detailed categorization of the data. This method is more practicable when the researcher has some preconceived idea about what the data will reveal (Dey, 1993). The most flexible approach, however, is arguably a combination of these extremes, or a middle path that falls between them. This latter is the path taken for this study and reflects the methods by which the data were collected as a first attempt at categorization.
Following the classification of data sets, the data analysis progressed to more refined distinctions through the emergence of specific themes, and also through a linking and integration of the initial data sets. Where data is mostly qualitative but structured, as in this study, this type of approach is particularly useful. The preference, then, for this study was to begin analysis by examining the raw data from each of the data sets, (Bowskill, Foster, Lally, & McConnell, 2001) thus avoiding a predetermined framework for analysis. The data were clustered into emerging themes and examined for significance in the light of the theoretical framework proposed for the research, and also in relation to previous work done in this field.
Data analysis, as described here, can be thought of as analogous to distillation. A mixture of data from various sources is drawn together, and via a process of segregation, tabulation and conflation, it is gradually honed to allow distillates – the analyzed data sets - to come off at various intervals for further processing. When all the distillates - themes and patterns in this case - are distilled, a picture of the whole can be gleaned, and from it summaries made about these themes.
Analysis of all data sets followed the same pattern and was a technique that had been successfully employed in previous work in the studies whose data is listed in Table 1, (Hramiak, 2001a, 2002a, 2004). As stated previously, all these studies involved ICT or e-learning type research, collecting and collating both quantitative and qualitative data from a variety of sources, and by a number of means. This technique consisted of a step-by-step approach to draw out emerging themes or patterns from the data sets on an individual basis – intra data set themes, and also on a collective basis – inter data set themes. This part of the analysis is described in detail in the following sections.
Classification, Processing, and Analysis of Data
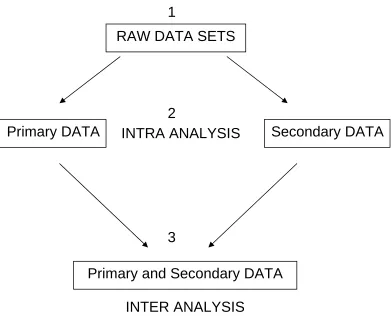
As stated above, the technique for data analysis, (see Figure 1) that is, for the journey between raw data and analyzed data, was one that was applied to all the data sets collected for this, and other studies, and comprised the following steps:
1. All raw data was typed up (in the case of the interview data, this was done within 24 hours of its collection in order to retain a clear picture of what had been said). For some of the data it was necessary only to collate it as it was recorded in printed format, for example discussion board and email messages. 2. Each data set was then examined individually for similarities or differences
pre- and post- interview response grid (Table 3). This type of analysis was not possible with the other studies as the research for these involved conducting one from interviews only.
[image:5.612.112.503.192.519.2]3. Once this had been completed for the individual data sets, a table was drawn up that comprised all data sets so as to examine any inter data set themes (see Figure 1, Step 3). Table 4 illustrates the way in which data from all data sets for a given study, can be drawn up in a single grid in order to analyze it for inter data set themes.
Figure 1. Diagram of data processing steps.
Step two of the data processing as shown in the diagram (Figure 1) illustrates the principles of data analysis that were used for all the data sets in the studies described.
Intra Analysis of Interview Data
In previous studies, similar to the one described in detail for the purposes of this paper, it had been only possible to construct individual participant versus response, or group versus response grids for the interviews conducted (Hramiak, 2001a, 2002a). For the main study described here, in addition to participant versus response grids showing similarities and differences (see Table 2), it was also possible to construct pre- and post- course interview grids, giving a timeline aspect to the interview data (see Table 3).
Secondary DATA
Primary DATA
RAW DATA SETS
Primary and Secondary DATA
INTRA ANALYSIS
INTER ANALYSIS
1
2
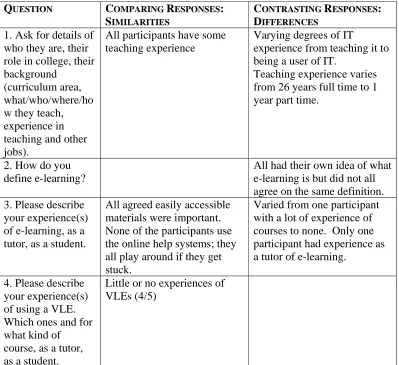
In study 3, a total of two group interviews were conducted – pre- and post- course. The notes recorded from these interviews were collated in participant versus response grids for both the pre- and post- course group interviews. From the initial participant versus response grids, which essentially contained the raw interview data, two compare and contrast grids were constructed - one for each interview conducted (see Table 2).
Table 2
Compare and Contrast Grid for Pre-course Interview: Example Responses
QUESTION COMPARING RESPONSES:
SIMILARITIES
CONTRASTING RESPONSES:
DIFFERENCES
1. Ask for details of who they are, their role in college, their background
(curriculum area, what/who/where/ho w they teach, experience in teaching and other jobs).
All participants have some teaching experience
Varying degrees of IT
experience from teaching it to being a user of IT.
Teaching experience varies from 26 years full time to 1 year part time.
2. How do you define e-learning?
All had their own idea of what e-learning is but did not all agree on the same definition. 3. Please describe
your experience(s) of e-learning, as a tutor, as a student.
All agreed easily accessible materials were important. None of the participants use the online help systems; they all play around if they get stuck.
Varied from one participant with a lot of experience of courses to none. Only one participant had experience as a tutor of e-learning.
4. Please describe your experience(s) of using a VLE. Which ones and for what kind of course, as a tutor, as a student.
Little or no experiences of VLEs (4/5)
within each of the two interview data sets (grids). The color-coded papers of themes were then investigated further.
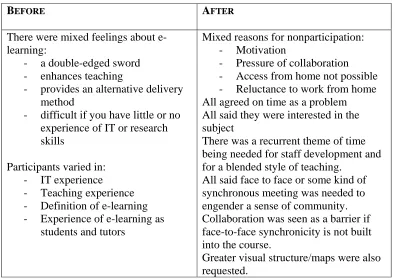
[image:7.612.109.504.206.486.2]By looking at the responses for both interviews in this particular study, it was possible to construct a before and after table that summarized the commonality and themes emerging from the participants across the two interviews. An example of the analysis of the pre- and post- course compare and contrast grids is given in Table 3.
Table 3
Example before and after Summary Data from Group Interviews
BEFORE AFTER
There were mixed feelings about e-learning:
- a double-edged sword - enhances teaching
- provides an alternative delivery method
- difficult if you have little or no experience of IT or research skills
Participants varied in: - IT experience - Teaching experience - Definition of e-learning - Experience of e-learning as
students and tutors
Mixed reasons for nonparticipation: - Motivation
- Pressure of collaboration - Access from home not possible - Reluctance to work from home All agreed on time as a problem All said they were interested in the subject
There was a recurrent theme of time being needed for staff development and for a blended style of teaching.
All said face to face or some kind of synchronous meeting was needed to engender a sense of community. Collaboration was seen as a barrier if face-to-face synchronicity is not built into the course.
Greater visual structure/maps were also requested.
As before, the color-coding technique was used to draw out emerging themes from the grid.
Data Analysis Across All Data Sets
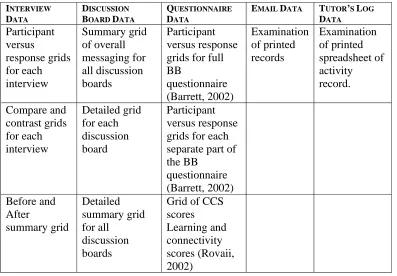
[image:8.612.110.507.294.570.2]This system of color coding and data distillation by comparing and contrasting was then performed on all the data sets, until what was achieved was a set of color-coded data for each individual set of data collected for analysis (see Table 4). This type of analysis can be applied to data from any of the studies described, and indeed to any studies of this nature involving the collection and collation of both quantitative and qualitative data. The individual color-coded sets could then be taken onto the next stage of data analysis (stage 3 in the diagram given in Figure 1). Table 4 shows a summary of the different data processing that was conducted for each individual data set, using study 3 as an example. Each individual grid, or stage in the processing was color coded for emergent themes as described previously.
Table 4
Example Details of Individual Processing of Data Sets
INTERVIEW DATA DISCUSSION BOARD DATA QUESTIONNAIRE DATA
EMAIL DATA TUTOR’S LOG DATA Participant versus response grids for each interview Summary grid of overall messaging for all discussion boards Participant versus response grids for full BB questionnaire (Barrett, 2002) Examination of printed records Examination of printed spreadsheet of activity record. Compare and contrast grids for each interview Detailed grid for each discussion board Participant versus response grids for each separate part of the BB questionnaire (Barrett, 2002) Before and After summary grid Detailed summary grid for all discussion boards
Grid of CCS scores Learning and connectivity scores (Rovaii, 2002)
Once all the data had been analyzed in this way, they could then be compared with each other to look for common themes between the data sets. This stage in the data analysis is described as inter data set analysis, and is described in detail in the next section.
Data Analysis Across Data Sets: Inter-Data Set Analysis
similar findings, from triangulating the data collection, indicate strength in the findings. Triangulation is the term for a multi-method approach to a problem, using at least two methods of data collection in a study of some aspect of human behavior (Cohen & Manion, 1994). It should also be noted that the greater the contrast between the methods used, the greater the confidence similarities in results will inspire. An example of this within this particular study might be the use of questionnaires and group interviews to determine the same results for a specific phenomenon, such as a sense of classroom community. Using contrasting methods to investigate a problem considerably reduces the chances that any consistent findings are attributable to similarities of method (Hramiak, 2000b).
Table 5
Fragment from Inter Data Set Thematic Analysis
PRIMARY AND SECONDARY DATA SET SUMMARIES Interview Data
Both interviews were friendly and informal (Green)
Before Course:
Mixed feelings about e-learning Double edged sword Enhances teaching Alternative delivery method Difficult without IT/Research skills Implementation strategy required Specialist team needed to develop courses
Participants varied in: IT and teaching experience Definition of e-learning Experience of e-learning
After Course:
Non participation because of:
Motivation (lack of) Pressure of collaboration (Red) No access from home Reluctance to work from home Time is a problem for all (Grey)
All interested in the subject matter of the course
Time a recurrent theme (Grey) as was a requirement for blended learning (Red)
All agreed you need a synchronous meeting to engender a sense of community – without it collaboration is seen as a barrier. (Red)
Only felt connected at face-to-face meetings not online. Require a greater visual structure/maps in course All happy with their IT skills and the VLE (Blue)
All agreed ICT as an enabler/disabler depends on a person’s exposure to new technology
Discussion Board Data
31 messages in total. 11 from the tutor 20 from a mixture of three other participants Short, shallow threads (Grey) Five messages in one thread is the largest thread.
Message style is informal, friendly, often informative and open-ended requiring responses. (Green) Messaging/access is generally done in working hours (Grey)
Very little participation (Grey) (20 messages from three other people over six weeks is approximately one message per week per person, however it was not that even)
Never any interaction among the whole group. (Red) Interaction is always between two participants or between one to two participants and the tutor.
No response to tutor’s encouragement to participate. Never any response to each other’s questions from participants outside the initial two-way messages. (Red)
Blackboard Questionnaire
Technical Aspects:
No access problems once logged on
Very little participation in the different types of activities (Grey) 2/9 activities only for 4/5 participants
Not happy with own or others’ contributions (Red) Happy with tutor’s contributions Mainly due to pressure of work (lack of participation). Discussions not felt to be dominated. No strong reasons given for online being different from face to face.
Learning Styles
6-11 out of 21 statements ticked by participants All like to socialize/respond/ask questions. (Red)
Note. Themes are indicated by giving colors in parenthesis to illustrate where colors were used in the original table.
Comparative analysis of the data (see Table 5) revealed a number of themes within it. Each emerging theme from the inter data set analysis for the study used as an example in Table 5, is highlighted in the table in a specific color as follows:
1. Time as a problem. (Grey)
2. Lack of a sense of community. (Red) 3. IT skills is not a barrier. (Blue)
4. Good inter participant relations. (Green)
The next stage in the analysis of the data, having identified a number of themes that arose from the research, was to examine the qualitative data in more detail to see how well the findings addressed the initial research questions for the study. An in depth account of this stage of the analysis is beyond the scope of this paper.
The combination of distillation type processing of data and concomitant color coding as described in this article has shown that it is possible to produce emergent themes from raw data without the need to acquire new software skills. These themes may, however, offer a way forward and indicate areas for further exploration and analysis. The type of analysis described is independent of the data collected, and, as has been illustrated by giving examples of more than one study in which this was applied, can be used for different types of studies involving ICT or ICT related research.
Summary
References
Barrett, E. (2002). Evaluating the use of BlackBoard on the EdD Programme. Sheffield, UK: Sheffield Hallam University.
Bowskill, N., Foster, J., Lally, V. & McConnell, D. (2001). Experiential professional development for networked learning: A phenomological approach. Staff and Educational Development International,5, 27-43.
Cohen, L. & Manion, L. (1994). Research methods in education. London: Routledge.
Dey, I. (1993) Qualitative data analysis: A user-friendly guide for Social Scientists.
London: Routledge.
Ely, M. (1991). Doing qualitative research: Circles within circles. London: The Falmer Press.
Hramiak, A. J. (2000). What is the difference between methods and methodology?
Sheffield, UK: Sheffield University.
Hramiak, A. J. (2001, July). Going the cultural mile: how far can teaching and learning in ethnic communities really go? Paper presented at the conference of SCUTREA,London, UK.
Hramiak, A. J. (2002, July). Altering the state of community based adult education: heeding the cultural voices of East Manchester. Paper presented at the conference of SCUTREA, Stirling, UK.
Hramiak, A. J. (2004). Collaborative E-professional development in further
education: Issues and challenges. Unpublished Doctoral thesis, University of Sheffield, Sheffield, UK.
Lally, V. (2000, September). Analysing teaching and learning interactions in a networked collaborative learning environment: Issues and work in progress. Paper presented at the European Conference on Educational Research, Edinburgh, UK.
Rovaii, A. P. (2002). Development of an instrument to measure classroom community. Internet and Higher Education, 5, 197-211.