The development of methods for the determination of
selenium using spectrofluorimetric and ICP-MS
techniques.
CACERES, Ana B.
Available from Sheffield Hallam University Research Archive (SHURA) at:
http://shura.shu.ac.uk/19425/
This document is the author deposited version. You are advised to consult the
publisher's version if you wish to cite from it.
Published version
CACERES, Ana B. (2002). The development of methods for the determination of
selenium using spectrofluorimetric and ICP-MS techniques. Doctoral, Sheffield
Hallam University (United Kingdom)..
Copyright and re-use policy
See
http://shura.shu.ac.uk/information.html
CITY CAMPIUS, HOWARD STREET
SHEFFIELD SI
1
WB
101 715 594 1
REFERENCE
ProQuest Number: 10694306
All rights reserved
INFORMATION TO ALL USERS
The quality of this reproduction is dependent upon the quality of the copy submitted.
In the unlikely event that the author did not send a com plete manuscript
and there are missing pages, these will be noted. Also, if material had to be removed, a note will indicate the deletion.
uest
ProQuest 10694306
Published by ProQuest LLC(2017). Copyright of the Dissertation is held by the Author.
All rights reserved.
This work is protected against unauthorized copying under Title 17, United States C ode Microform Edition © ProQuest LLC.
ProQuest LLC.
789 East Eisenhower Parkway P.O. Box 1346
The Development of Methods for the
Determination of Selenium using
Spectrofluorimetric and ICP-MS Techniques
Ana B. Caceres
A thesis Submitted in partial fulfilment of the
requirements of Sheffield Hallam University
for the degree of Doctor of Philosophy
A b s t r a c t
Methods for both the on-line and off-line fluorimetric determination of total selenium and selenium species using 2-(a-pyridyl)-thioquinaldinamide (PTQA) as a fluorimetric reagent have been developed. As PTQA is not available on the market, methods for its synthesis were critically reviewed, and in the light of the information obtained, modifications were made to the synthesis and purification conditions in order to improve yield from 16 % to 38.9 %. The synthesised PTQA was used for the optimisation of a batch fluorimetric method based on the reaction between the reagent and Se (IV) in acidic medium. The developed method was applied to the determination of total selenium in nutritional supplements after microwave digestion and photoreduction of Se (VI) to Se (IV). The analytical precision in the concentration range 0. 5 - 1000 pg ml.*1 was better than 5 %. Excellent agreement (r2 = 0.9960) between
the results of the fluorimetric and ICP-MS methods was obtained when a reference material, TMDA 51.2 supplied by National Water Research Institute Environment Canada and three nutritional supplements were analysed.
A novel automated fluorimetric method for the simultaneous determination of Se (VI) and Se (IV) is described in which a purpose built flow injection system was used for the on-line photoreduction of Se (VI) to Se (IV) before detection. Variables such as tube diameter, flow rates, type of acids (HN03, H2S 04, CH3COOH, H3PO4 and HCI) that
affect the rate at which PTQA reacted with Se (IV) were investigated and optimised. The linear calibration range was found to depend on the type and concentration of acid. The most intense fluorescence signals were observed in HN03 and at a PTQA
concentration of 5x1 O'4 M. A sample throughput of 8 samples/hr was achieved. Method
validation was by comparing the results obtained for the determination of selenium in nutritional supplements with those from ICP-MS.
Acknowledgements
This PhD study was sponsored by “La Universidad del Zulia”, (LUZ), Maracaibo, Venezuela. I would like to thank the Facultad de Ciencias for their support during my study leave.
I would like to thank my supervisor Dr P.H.E. Gardiner for his guidance, support, friendship, and patience. The advice of Dr. Alan Hewson on organic synthesis and suggestions from Dr. Peter Drew are grateful acknowledged. I would like to thank Paul Collins, Joan Hague, Kevin Osborne, Paul Ash, Martin Blakemor, Michael Cox, Jo-Anne Metcalfe, Ken Lewis, Barry Christian, Keith Tylee, Nick Lewus, and David Ashton, for technical support. I would also like to thank Alexander and Maria for introducing me to my supervisor.
The support of all my friends Lourdes and her family, Flori, Claudia, Inma and Javier, Virginia, Lisbeth and her family in Spain and Caqui and her family, Mariela Colina, Mariela, Fredy, Sora and Roberto, Marinela, Betzabeth and family, Beatriz, and Janeth, in Venezuela whose emails and telephones calls have been much appreciated. A big thank you especially to Isabel, Alex, Belen, William, Harry, Jorge and John for invaluable support during the difficult times. To my dear friend S. Tsuchiya for going strength and self belief I say Arigatoo.
I would like to thank everyone at St. Mary Church Cathedral, especially Frs. Charles, Albert, and Desmon for guidance and support during those three years.
Last but not least, I would like to thank my mother, for her spirit, energy and prayers, which kept me going. A big thank you to Aurora for being there.
Contents
Abstract... I
Acknowledgements... II
Chapter 1: Introduction...
1
1.1 Properties of Selenium... 2
1.1.1 Chemical of selenium... 2
1.1.2 Biochemical properties... 3
1.2 Selenium Deficiency in humans... 5
1.3 Effects of Adequate Selenium Intake... 6
1.4 Selenium Toxicity... 6
1.5 Sources of Selenium... 9
1.5.1 Soils and rock... 9
1.5.2 Selenium in waters... 9
1. 5.3 Selenium in plants... 10
1.5.4 Selenium in food... 11
1.6 Selenium Uses... 12
1.7 Method of Analysis... 13
1.7.1 Separation and preconcentration ... 13
1.7.1.1 Volatilisation... 13
1.7.1.2 Extraction... 14
1.7.1.3 Sorption... 14
1.7.2 Titrimetric methods... 14
1.7.3 UV-visible spectrophotometric methods ... 15
1.7.4. Spectrofluorimetric methods... 15
1.7.5 Atomic Absorption Spectrometry (AAS) methods... 15
1.7.6 Graphite furnace atomic absorption spectrometry methods... 16
1.7.7 Atomic emission spectrometry (AES) methods... 16
1.7.8 Atomic fluorescence spectrometry (AFS) methods... 17
1.7.9 Neutron activation methods... 17
1.7.10 The choice of techniques for Se determination... 17
1.7.11 Speciation techniques... 18
1.7.11.1 Electrophoresis... 19
1.7.11.3 Chelating resins... 20
1.7.11.4 Solid-phase extraction... 20
1.7.11.5 Liquid-liquid extraction... 20
1.7.11.6 Chromatographic methods... 21
Open column liquid chromatography... 21
High-performance liquid chromatography... 21
Gas chromatography... 22
1.7.11.7 Electro-analytical speciation techniques... 22
Cathodic stripping voltammetry... 22
1.8 Techniques used through out this research... 23
1.8.1 Purification... 23
1.8.1.1 Crystallisation... 23
1.8.1.2 Open Column... 25
1.8.2 Microwave digestion... 25
1.8.3 Inductively coupled plasma... 26
1.8.3.1 ICP-M S... 27
1.8.3.2 Liquid chromatography coupled to inductively coupled plasma-mass spectrometry... 28
1.8.3.3 Hydride generation... 30
1.8.4 Chromatography... 31
1.8.4.1 Ion Chromatography... 32
Types of Ion Chromatography... 32
Ion-Exchange Chromatography (High Performance Ion Chromatography, R P IC )... 32
lon-Exclusion Chromatography (High Performance Ion Chromatography Exclusion, UPICE)... 32
lon-Pair Chromatography (Mobile Phase Ion Chromatography, M PIC ) 33 1.8.5 Flow injection analysis... 33
1.8 .6 Molecular fluorescence... 36
1.8.6.1 Fluorescence Quenching... 39
1.8.6.2 Instrumentation for fluorescence spectroscopy... 39
1.9 Aims and Objectives... 41
1.10 References... 42
Chapter 2: Experimental
452.1 Apparatus and Instruments... 46
2.1.1 Balances... 46
2.1.2 pH meter... 46
2.1.3 Heaters and vacuum pump... 46
2.1.4 Microwave digestion... 46
2.1.5 Photoreactor... 46
2.1.6 Spectrofluorimeters... 48
2.1.7 Inductively coupled plasma-mass spectrometer... 49
2.1.8 The flow-injection (FI) system... 49
2. 2 Reagents and chemicals... 50
2.3 Procedure... 53
2.3.1 2- (a-Pyridyl) thioquinaldinamide (PTQA) synthesis... 53
2.3.1.1 PTQA synthesis after Ahmed et a l... 53
2.3.1.2 PTQA synthesis using phosphorus pentasulphur (P4S10) ... 54
2.3.1.3 PTQA synthesis by active methyl condensation, with 2-amino-pyridine in presence of sulphur... 54
2.3.1.4 Patent DNEPR chem techn Ins. 055R 1985 112 ... 55
2.3.2 PTQA purification... 55
2.3.2.1 Crystallisation... 55
2.3.2.2 Vacuum distillation and crystallisation... 55
2.3.2.3 Glass column separation... 55
2.3.3 Sample pretreatment... 56
2.3.3.1 Total digestion... 56
2.3.3.2 Selenium extraction... 56
Mechanical leaching... 56
Ultrasonic extraction... 56
2.3.4 Fluorescence detection... 56
2.3.4.1 Off-line photoreduction... 56
Fluorimetric determination... 57
2.3.4.2 On-line photoreduction... 57
2.3.5 ICP-MS methods... 58
2.3.5.1 Total selenium... 58
2.3.5.2 Selenium speciation using HPLC-UV-HG-ICP-MS... 58
2.4 References ... 60
Chapter 3: Synthesis and Purification of PTQA
613.1 Introduction... 62
3.2 Results and Discussion... 70
3.2.1 Reaction and yield using Ahmed’s method... 70
3.2.2 Improving PTQA purification... 71
3.2.3 Use of Phosphorus pentasulphide (P4S10) for the synthesis of PTQA ... 80
3.2.4 Optimisation of the reaction time using the condensation reaction in the presence of sulphur... 82
3.2.5 The effect of the addition of Na2S as a catalyst... 83
3.1.4 Characterisation of PTQ A... 84
3.1.4.1 Elemental analysis (N, C, and H )... 84
3.3 Conclusion... 85
3.4 References... 8 6
Chapter 4: Fluorescence Method for Total Selenium
Determination
88
4.1 Introduction... 894.1.1 Sample pretreatment... 92
4.2 Results and Discussion... 95
4.2.1 Optimisation of the conditions for the generation of the fluorescence signal... 95
4.1.1.1 The choice of solvent... 95
4.2.1.2 Acid medium... 95
4.2.1.3 Selection of the excitation wavelength... 96
4.2.2. Optimisation of the time for developing the PTQA-Se (IV) fluorescence signal ... 98
4.2.3 Calibration curve... 99
4.2.4 Se (VI) reduction in the presence of H C I... 100
4.2.5 UV-Photoreduction... 102
4.2.5.1 Effect of irradiation temperature on extent of photoreduction ... 104
4.2.5.2 Effect of irradiation time on photoreduction... 104
4.2.5.3 UV-Reactor Design... 105 4.2.6 Development of an off-line method for the determination of Se in
nutritional supplements... 106
4.2.7 Validation of the fluorescence method using a developed ICP-MS method... 109
4.3 Conclusion... 113
4.4 References... 114
Chapter 5: On-line System for the Determination of Se
(IV) and Se (V I)... 116
5.1 Introduction... 117
5.2 Results and Discussion... 120
5.2.1 Conditions for Se (IV) determination... 120
5.2.1.1 Flow rate... 120
5.2.1.2 The effect of acid on the fluorescence signal intensity... 121
5.2.1.3 Effect of sample loop size on signal shape... 121
5.2.2 Se (IV) and Se (VI) determination after photoreduction... 123
5.2.2.1 Development of the on-line system... 123
5.2.2.2 Optimisation of photoreactor size... 124
52.2.3 Stopped flow tim e... 125
5.2.2.4 Calibration graph and repeatability... 127
5.2.2.5 Application of the on-line method to sample analysis... 129
5.3 Conclusion... 131
5.4 References... 132
Chapter 6: Selenium Speciation in Nutritional
Supplements using HPLC-UV irradiation with
HG-ICP-MS Detection
134
6.1 Introduction... 1356.2 Results and Discussion... 137
6.2.1 Conditions for the generation of hydrogen selenide (H2S e )... 137
6.2.2 The effect of carrier gas flow... 142
6.2.3 Separation condition... 145
6.2.4 Calibration graph... 146
6.2.5 Sample analysis... 149 6.3 Conclusion... 154 6.3 References... 155
7 General Conclusions and Future Work
163
7.1 Conclusions ... 164
List of Figures
Figure 1.1 Pathways of Se metabolism... 5
Figure 1. 2 Reaction for the iodometric determinmation of selenium... 14
Figure 1. 3 Schematic description of the analytical methods used for
selenium speciation and determination... 18
Figure 1. 4 Schematic view of a horizontal Ar - ICP torch for ICP-AES and
ICP-M S ... ... 27
Figure 1. 5 Schematic diagram of a quadrupole ICP-M S... 28
Figure 1. 6 Schematic diagram of HPLC-ICP-MS system... 29
Figure 1. 7 A schematic diagram of hydride generation system using flow
injection... 31
Figure 1. 8 The different modes of liquid chromatography... 32
Figure 1. 9 A schematic diagram of a simple flow injection system... 34
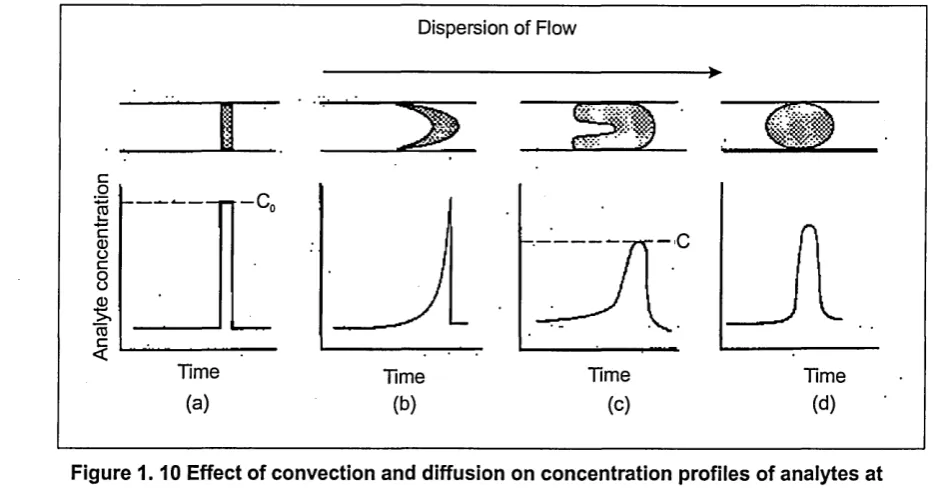
Figure 1.10 Effect of convection and diffusion on concentration profiles of
analytes at the detector... 34
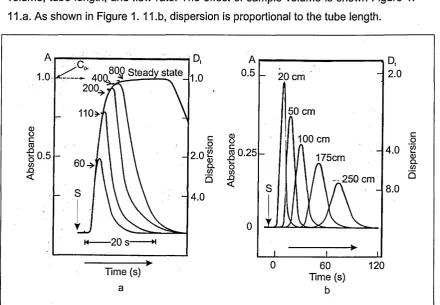
Figure 1.11 The effect of sample volume and length of tubing on dispersion 35 Figure 1.12 Common fluorogenic compound used for fluorescence detection ... ... 37
Figure 1.13 Absorption and fluorescence emission spectra of perylene and quinine... ... 38
Figure 1.14 Typical Jabloski diagram ... 39
Figure 2.1 Schematic diagram of the batch photoreactor... 48
Figure 2. 2 Schematic diagram of the on-line photoreactor system... 48
Figure 2. 3 Schematic diagram of the developed flow injection system coupled to the fluorimetric detector for the determination of Se (IV) and Se (V I)... 51
Figure 2. 4 Refluxing system for PTQA reaction... 54
Figure 2. 5 System for Se (IV) and Se (VI) determination with a continuous flow using a by-pass valve... 58
Figure 2. 6 lon-HPLC-HG-ICP-MS system... 59
Figure 3.1 Synthesis of PTQA homologues after Porter... 62
Figure 3. 2 Synthesis of PTQA after Ahmed et al... 63
Figure 3. 3 Reaction scheme of the synthesis developed by Saikachi and Hisano... 63
Figure 3. 4 Reaction scheme of the synthesis of a thioamide compound catalysed by Na2S as reported in patent DNEPR Chem Techn In s... 64
Figure 3. 5 Reaction proposed by Steliou and Mrani... 64
Figure 3. 6 Thionation with phosphorus pentasulphide... 6 6 Figure 3. 7 Routes for the conversion of hydrazones into thiocarbonyls 67 Figure 3. 8 Elimination of HX from sulphides... 67
Figure 3. 9 Dehydrocyanation of cyanothiols... 67
Figure 3.10 Conversion of geminal dibromides into thiocarbonyls... 6 8 Figure 3.11 Photolytic cleavage of thioacetophenones... 6 8 Figure 3.12 Generation of thiocarbonyls by the retro-Diels-Alder... 69
Figure 3.13 Thermolysis of thiosulfinates 69
Figure 3.14 Thermolysis of thiosulphonates... 70
Figure 3.15 TLC plates for the reaction mixture... 71
Figure 3.16 TLC separations for the reaction mixture... 72
Figure 3.17 Column separation of the reaction product separation was on a silica packed column with CHCI3 as the mobile phase... 72
Figure 3.18 Chromatogram (a) and mass spectra (b-d) of the constituents of fraction A eluted from the silica packed column. The mass spectra confirmed
the presence of S6l S7 and S8 ... 75-76
Figure 3.19 Chromatogram (a) of fraction B eluted from the silica packed
column and PTQA mass spectra (b )... 77
Figure 3. 20 Chromatogram (a) of fraction C eluted from the silica packed column and mass spectra (b) of the by-product with elution time of 16.40
minutes... ... 78
Figure 3. 21 Chromatogram (a) of fraction D eluted from the silica packed column and mass spectra (b) of the by-product with a retention time of 16.50 minutes ... 79
Figure 3.22 Chromatogram (a) of fraction E eluted from the silica packed column and mass spectra of the compound with a retention time similar to
the PTQA, 18.2 m in... 80
Figure 3. 23 PTQA Synthesis using quinaldine acid, phosphorus penta-sulphide, a-amino-pyridine in the presence of the solvent toluene at 100 °C for 12 h r... 81
Figure 3. 24 TLC separation of the reaction mixture... 81
Figure 3. 25 The chemical structure of N-(a-pyridyl)-2-quinaldinamide PQ A .. 81
Figure 3. 26 Gas chromatogram (a) and mass spectrum (b) of the product
obtained... 82
Figure 4.1 Fluorescence process for PTQA in the presence of an oxidising agent in acidic medium... 90
Figure 4.2 Comparison of the selenium signal intensities obtained when PTQA is dissolved in methanol (1), ethanol (2) and isopropanol (3),
respectively... 94
Figure 4. 3 The reaction of PTQA in the presence of Se (IV) in acidic
medium... 96
Figure 4.4 Relative fluorescence intensities obtained for a 200 pg L'1 Se (IV)
solution in 5x1 O'4 M PTQA in the presence of (— ) HN03i (-x-) H2S0 4, (-A-)
H3P 04, (-■-) HCI and (-•-) HAc acids... 97
Figure 4. 5 Fluorescence signals obtained from 500 pg L' 1 M PTQA and 0.1
M HN03 using 280, 350, 360 and 380 nm as excitation wavelength,
respectively... 97
Figure 4. 6 Comparison of the slopes of the calibration graphs obtained at different emission wavelengths: 470 (— ), 480 (-■-), 490 (-A-) and 500
(-x-)nm, respectively... ... 98
Figure 4. 7 Reaction time to optimisation using a solution of 200 pg L'1 Se
(IV), 0.1M HN03, 1x1 O'3 M PTQA; a (-A-) and 5x10*4 M PTQA; b (-•-) in
isopropanol... 99
Figure 4. 8 The behaviour of selenium signal in the calibration range 0.4 to 5000 pg L*1 Se (IV )... 99
, Figure 4. 9 Calibration curve for Se (IV) in the range 0.4 to 200 pg L'1... 100
Figure 4 .10 Possible mechanism for the reduction of selenate to selenite in
the presence of H C I... 100
Figure 4.11 Fluorescence signal intensity obtained in solutions containing: 1) Se (IV) in 0.1 M HN03, 2) Se (VI) +Se (IV) in 0.1 M HN 03 and 0.01M HCI,
3) Se (IV) + Se (VI) in 0.1 M HN 03 and 0.5 M HCI, 4) Se (VI) in 0.1 M HN03
and 0.1 M HCI and 5) Se (VI) in 0.1 M HN03and 0.5 M HCI. 500 pg L*1 of
each selenium species (Se (IV) and Se (V I))... 101
Figure 4.12 Quenching effects of Cl' and Br' on the fluorescence signal from a 200 pg L'1 solution of Se (IV); (-•-) NaCI; (-■-) HCI; (-A-) NaBr... 102
Figure 4.13 Effect of NaOH concentration on the photoreduction of 200 pg L'1 Se (VI) when the sample was irradiated 40 minutes at: (a) 25 °C; and (b)
80 ° C ... 10 3
Figure 4.14 Possible mechanism for the photoreduction of selenate in
N aO H ... 104
Figure 4.15 Effect of temperature on the photoreduction of 200 pg L'1 Se
(VI) in 5 M NaOH after 40 minutes irradiation tim e... 105
Figure 4.16 Effect of the irradiation time on the photoreduction of 200 pg L'1
Se (VI) to Se (IV) in 5 M NaOH at 80°C ... 105
Figure 4.17 Schematic diagram of the of the sample preparation steps used for the determination of total selenium in nutritional supplements ... 108
Figure 5.1 Detection techniques used for on-line methods developed in the
last 20 years for selenium determination... 117
Figure 5 .2 From Shibata and co-worker. Flow diagram of the autoanalyzer-based selenium detection system... 118
Figure 5. 3 From Brown et al. Auto-analyzer manifold. S after flow rate
indicates solvents solvaflex tubing... 119
Figure 5 .4 From Ahmed et al. Schematic representation of the FI manifold
employed for the simultaneous determination of Se lv and Se Vl...
Figure 5. 5 On-Line system for Se (IV) determination. ...
Figure 5. 6 The effect of flow rate on peak shape of the Se (IV) signal
generated, using the following condition a solution 0.5 M HN03i 5x1 O'4 M
PTQA, using tubing of 1.0 mm internal diameter. Flow rate (mL min'1): a: 0.41, b: 0.54, c: 0.68, d: 0.82, e: 1.09... ...
Figure 5. 7 Acid influence in the on-line fluorescence reaction. Using the following conditions, a solution of 200 pg L'1 Se (IV) in acid, flow rate: 0.75
mLmin'1; 5x1c4 M PTQA (-X -) HN03, (-■-) H2S 04, (-A-) H3P 04... .
Figure 5. 8 Effect of sample loop size on Se (IV) peak shape. Using the
following conditions, a solution of 500 pg L'1 Se (IV) in water, flow rate: 0.75
mL min'1; 5x1 O'4 M PTQA; Loop size, a: 1000 pL and b: 500 p L ...
Figure 5. 9 The effect of loop size on peak area, using the following conditions, a solution of 500 pL L'1 Se (IV); 5x1c4 PTQA, 1M HN03; Loop
size, a: 500 pL, b: 1000 pL...
Figure 5.10 Comparison between two loop sizes, using the following conditions, a solution of 200 pg L'1 Se (VI) in 5 M NaOH (0.30 mL min'1) and
2.5 M HN03 (0.75 mL min'1), coil length (m): a: 2.50, b: 5.25 and c: 10.75....
Figure 5.11 Reduction of NaOH flow rate for increasing of photoreduction, using the following conditions, a solution of 200 pg L'1 Se (VI); photo coil:
10.50 m; 5x1c4 M PTQA; 2.5 M HN03; HN03 flow rate: 0.75 mL min'1; NaOH
flow rate a: 0.3 mL min'1; b: 0.2 mL min'1...
Figure 5.12 Optimisation the time for the stop flow method for the photo reduction ... ...
Figure 5.13 Comparisons between stopped flow and continuous system using the following conditions 200 pg L'1 Se (VI); 5x1c4 M PTQA; 2.5 M
HN03; HN 03 flow rate: 0.75 mL min'1; NaOH flow rate 0.3 mL min'1; a:
continuous system with 10.75 m of coil length, b: stopped flow for 40
119
120
121
125
122
123
124
125
126
minutes, with 2.5 m coil length 127
Figure 5.14 Repeatability for four Se (IV) injections... 128
Figure 5.15 Calibration graph for Se (IV) in the concentration 40 to 500 pg
L1S e (V I)... 128
Figure 5.16 Sample 4 analyses, using the following conditions, solution of 200 pg L'1 Se (VI); photoreactor coil length: 2.50 meters; 5x1 O'4 M PTQA; 2.5
M HN 03; HN 03 flow rate: 0.75 mL min'1; 5 M NaOH flow rate 0.3 mL min'1;
stopped flow for 40 min; a: injection and direct determination of Se (IV); b: injection and sample irradiation for 40 minutes and detection as total
selenium (selenite and selenate)... 130
Figure 6.1 Detectors used for selenium speciation by L C ... 136
Figure 6. 2 Initial on-line system.1 mobile phase, 2 HPLC pump (0.7 mL min'
1), 3 Inject valve with loop of 50 pL, 4: guard column, 5 ion-exchange AS9-SC 4 mm, Dionex, 6 ICP-MS pump (0.8 mL min'1), 7 ICP-MS instrument, 8
Gas-liquid separator unit... 138
Figure 6. 3 Borohydride reaction products for selenomethionine (a) and
selenite (b); Column ion-exchange AS9-SC 4 mm, Dionex, mobile phase: Na2C0 3/NaHC0 31.8/1.7 (0.5 mL min1); 2 M HCI and 1% NaBH4 in 0.1 M
NaOH (0.8 mL min1' ) ... 139
Figure 6.4 Effect of HCI concentration increased for the H2Se generation
from each selenium form. Column: ion-exchange AS9-SC 4 mm, Dionex, mobile phase: Na2C0s/NaHC03 1.8/1.7 (0.5 mL min1*); 12 M HCI and 1%
NaBH4 in 0.1 M NaOH (0.8 mL min*1), 100 °C ... 140
Figure 6. 5 System for on-line speciation of three form of Se by ion-HPLC
with post column UV-irradiation (photo-reducrtion), hydride generation and ICP-MS detection. 1 mobile phase, 2 HPLC pump (0.7 mL min'1), 3 inject valve with loop of 50 pL, 4 guard column, 5 ion-exchange AS9-SC 4 mm, Dionex, 6 peristaltic pump (0.6 mL min'1), 7 photoreactor, 8 ICP-MS pump
(0.8 mL min'1), 9 gas-liquid separator unit, 10 ICP-MS instruments, 11 waste
(liquid fraction) 141
Figure 6. 6 Effect of increased HCI concentration. Condition: Column
ion-exchange AS9-SC 4 mm, Dionex, mobile phase Na2C0 3/NaHC0 31.8/1.7
(0.7 mL min'1); NaOH (0.6 mL min'1), HCI and 1% NaBH4 in 0.1 M NaOH (0.8
mL min'1). a NaOH 5M and HCI 4 M; b 5M NaOH and 6 M HCI and c 5 M
NaOH and 8.4 M H C I... 1 4 3
Figure 6.7 Proposed mechanisms for the formation selenium hydride from
selenomethionine, selenate and selenite... 144
Figure 6. 8 The effect of carrier gas flow on the selenium hydride signal.
Column: ion-exchange AS9-SC 4 mm, Dionex, mobile phase:
Na2C0 3/NaHC0 31.8/1.7 (0.7 mL min'1); NaOH (0.6 mL min'1), 12 M HCI and
1% NaBH4 in 0.1 M NaOH (0.8 mL min'1) ... 144
Figure 6. 9 Comparison of the signals obtained from solutions 0.2 and 0.5 pg
L'1 containing the same concentrations of the three selenium species,
selenomethionine (1), selenite (2), selenate (3). Using a Dionex ion-exchange AS9-SC 4 mm column, mobile phase Na^Os/NaHCOs 1.8/1.7 (0.7 mL min'1); 5 M NaOH (0.6 mL min'1), 8.4 M HCI and 1% NaBH4 in 0.1 M
NaOH (0.8 mL min'1) ... 147
Figure 6.10 Calibration graphs (a) selenomethionine y= 90141x + 920595
?= 0.9995, (b) selenite y=92799x + 1E+06 r*= 0.9978, (c) selenate y=
89879x + 963116 r*= 0.9993 ... 148
Figure 6.11 NaOH extract of Sample A. Column ion-exchange AS9-SC 4
mm, Dionex, mobile phase Na2C 03/NaHC031.8/1.7 (0.7 mL min'1); 5 M
NaOH (0.6 mL min'1), 8.4 M HCI and 1% NaBH4 in 0.1 M NaOH (0.8 mL min'
1) ... 149
Figure 6.12 Sample B Analysis, a mobile phase extract, b: water extract.
Column ion-exchange AS9-SC 4 mm, Dionex, mobile phase
Na2C0 3/NaHC0 31.8/1.7 (0.7 mL min'1); NaOH (0.6 mL min'1), 8.4 M HCI and
1% NaBH4 in 0.1 M NaOH (0.8 mL min*1) ... 150
Figure 6.13 Chromatogram of sample C after extraction with NaOH and
separation on an ion-exchange AS9-SC 4 mm, Dionex, mobile phase
Na2C0 3/NaHC0 31.8/1.7 (0.7 mL min'1); 5 M NaOH (0.6 mL min'1), 8.4 M HCI
and 1% NaBH4 in 0.1 M NaOH (0.8 mL min'1) ... 151
Figure 6.14 Chromatogram of sample C after extraction with NaOH and separation on an ion-exchange AS9-SC 4 mm, Dionex, mobile phase
Na2C0 3/NaHC0 31.8/1.7 (0.7 mL min1); 5 M NaOH (0.6 mL min*1), 8.4 M HCI
and 1% NaBH4 in 0.1 M NaOH (0.8 mL min*1) ... 152
List of Tables
Table 1.1 Known selenoproteins, which carried out nutritional functions of
selenium, from Rayman, M . ... 4
Table 1. 2 Global distribution of Se level in blood based on data reported by
Combs et al... 8
Table 1. 3 Selenium species in plants... 10
Table 1 .4 Typical selenium contents in food (pg g'1) ... 12
Table 2.1 Microwave program... 47
Table 2. 2 Operation conditions for ICP-M S... 49
Table 2. 3 Certified values for trace elements in TMDA 51.2 and 23.2... 52
Table 2. 4 Selenium content and mineral composition of the vitamin
supplements analysed by the developed analytical methods... 53
Table 2. 5 Reaction conditions used in the systhesis of PTQ A... 54
Table 2. 6 Parameters studied for the PTQA-Se (IV) reaction... 57
Table 3.1 Summary of the methods reviewed by McGregor and Sherrington 65 for the conversion of carbonyl groups into thiocarbonyls...
Table 3. 2 Summary of the fragments used for the identification S6, S7, S8,
PTQA and two by-products... 74
Table 3. 3 The yield for the PTQA reaction using a molar ratio: 0.10:0.15:0.30 of quinaldine: 2-aminopyridine: sulphur, respectively, and heating the mixture
at 155 °C for different set times... 83
2-aminopyridine, sulphur, and sodium sulphide, respectively and heating the
mixture at different set times and temperaturesn ... 83
Table 3. 5 Comparison of the carbon (C), hydrogen (H) and nitrogen (N)
content in PTQA... 84
Table 4.1 Possible interference effects on the PTQA-Se(IV) reaction caused
by the presence of other ions ... 91
Table 4.2 Application of photoreduction to the determination of selenium, iron
and chromium... 94
Table 4. 3 The extent of conversion of Se (VI) to Se (IV) after photoreduction
in increasing concentration of HN03, H2S 04 and N aO H ... 102
Table 4. 4 Optimum parameters for the determination of selenium by
molecular fluorescence... 106
Table 4. 5 Recoveries of selenium from nutritional supplements A, B, C, and D, selenomethionine, and selenocystine after digestion in either H20 2,
H202/H2S 04 or H202/H N 03... 107
Table 4. 6 Comparison of the expected results with those obtained using the
developed fluorescence method... 109
Table 4. 7 Results of selenium determination by ICP-MS without the use
matrix matched standards... 11 0
Table 4. 8 The results of determination of selenium by ICP-MS using
matrix-matched and material standards... 1 1 0
Table 4. 9 Recoveries of selenium from nutritional supplements, selenomethionine and selenocystine after digestion with either H20 2,
H202/H2S 04 or H202/H N 03 selenium determination was by ICP-MS... 111
Table 4.10 Comparison of the expected results and the obtained results for
the determination of selenium by ICP-M S... 111
Table 4.11 Comparison of the results obtained using the developed
fluorescence method with ICP-M S... 112
Table 5.1 Selenium determination as Se (IV) in selenomethionine and
selenocysteine solutions using the batch fluorescence method (Chapter 4 ) ... 129
Table 5. 2 Comparison of the results (n=5) of selenium determination by the
developed on-line method with ICP-MS, against expected values in pg L'1... 130
Table 6.1 The effect of increasing concentrations of HCI, HBr and NaOH on
the photoreduction reaction and formation of selenium hydride... 145
Table 6. 2 Chromatographic parameters for the generation of hydrogen
selenide (H2S e )... 146
Table 6. 3 Recoveries of selenium supplements tablets using
HPLC-UV-HG-ICP-M S... 152
Table 6.4 Comparison of selenium determination, in three nutritional
supplements, using batch fluorescence, ICP-MS, on-line fluorescence and
HPLC-UV-HG-ICP-MS methods 153
Selenium, discovered by Berzeliusn in 1817, is widely distributed in the earth's crust with an abundance of 7x 10'5 weight percent. Selenium is sandwiched between
oxygen, sulphur, tellurium and polonium in group VIA of the periodic table. The chemical and biochemical behaviour of selenium closely resembles those of sulphur and tellurium. Indeed, all compounds of the element have sulphur analogues. A review of the chemical and biochemical properties of selenium is given below.
1.1 Pr o p e r tie s o f Sele n ium
1.1.1 Chemical of selenium
The outer electronic configuration of selenium is 4s2 4p4, enabling it to form divalent
compounds with two covalent bonds and two lone pairs (1). The commonly encountered oxidation states of selenium are -2, 0, +4, +6. The inorganic
compounds of selenium are, generally, similar to those of sulphur. Selenium burns in air with a blue flame to produce the following oxides such as SeO, Se02, and Se20 3. The commonest and the most stable oxidised form is Se02) which adsorbs
water to produce selenous acid (H2Se03), a weak oxidising dibasic acid. Selenous
acid is a stronger oxidising agent than sulphurous acid as judged by its quantitative oxidation of iodide in acidic solutions. Selenious acid is readily oxidised by halogens in the presence of silver ions or 30 % H202 to produce selenic acid, H2Se04. Selenic
acid is as strong but less stable than sulphuric acid, and it is more easily reduced by hydrobromic and hydroiodic acid to form selenious acid or elemental selenium. Selenium reacts with hydrogen and halogens, except iodine, to form selenides and halides. Se2Br2 is more stable than S2Br2. Similarly, SeCI4 is more stable than SCI4
but less stable than TeCI4, (2, 3).
Selenium dissolves in strongly alkaline solution to produce selenides and selenites. Elemental selenium reacts with alkali-metal cyanides to yield selenocyanates, MSeCN. Reaction with alkali-metal sulphites yields selenosulphates, MSeS03.
The only compound of selenium with hydrogen is hydrogen selenide; H2Se is obtained by heating selenium in hydrogen
Se (I) + H2 (g )---► H2Se (g) (525- 625 °C)
Hydrogen selenide is a colourless flammable gas with an offensive odour and greater toxicity and lower thermal stability than hydrogen sulphide. Its solubility in
water is greater than that of hydrogen sulphide and is a stronger acid than hydrogen sulphide (2).
H2Se - ► HSe + H* ionisation constant 2.4 x 10'3 at 25°C
HSe * Se2' + H* ionisation constant 4.8 x 10*9 at 25°C (3)
H2S ► HS + H* ionisation constant 9.12 x 10'8 at 25°C
HS‘ * s2' + h* ionisation constant 1.0 x 10‘17 at 25°C (2 ,3)
1.1.2 Biochemical properties
Selenium was recognised as an essential trace element by Schwarz, but it was not until the early 1970's that it was shown to be an essential component of the enzyme glutathione peroxidase (GPX or GSH-Px) (4). This enzyme is involved in the protection of cells against oxidative damage caused by reducing hydroperoxides; a role shared with vitamin E. Several Se-containing enzymes are now recognised (5) including five GSH-Px and and three iodothyronine. More recently, Combs (6) and
Rayman (4) have added eight more to the list. Table 1. 1 shows known selenium proteins.
Recently, the pathways of selenium uptake have been proposed by Combs as shown in Figure 1.1. The inorganic selenium forms (selenate, selenite) are reduced to yield hydrogen selenide (H2Se), which is incorporated into selenoproteins.
Selenomethionine (SeMet) the common form of selenium in foods is incorporated non-specifically into proteins in place of methionine. Selenocysteine (SeCys) which is a product of SeMet catabolism is metabolised to H2Se. CH3SeH is formed from
methylselenocysteine (CH3SeCys) present in some foods (Allium vegetables).
Excess H2Se not used for the synthesis of selenoproteins is methylated to form dimethylselenide ((CH3)2Se) and trimethylselenonium ((CH3)3Se+) and excreted in
the breath and urine, respectively. The oxidation of H2Se excess leads to production of superoxide, as Se02, and other reactive oxygen species such as H20 2.
Table 1.1 Known selenoproteins, which carry out nutritional functions of selenium, from Rayman, M. (4).
Selenoprotein
Glutanthione peroxidases Antioxidant enzymes: remove hydrogen peroxide, and lipid and phospholipid (GPx1, GPx2, GPx3, hydroperoxides (thereby maintaining membrane integrity, modulating GPx4) elecosanoid synthesis, modifying inflammation and likelihood of propagation of further oxidative damage to biomolecules such as lipids, lipoproteins and DNA).
(Sperm) mitochondrial Form of glutathione peroxidase (GPx4): shields developing sperm cells from capsule selenoprotein oxidative damage and later, polymerises into structural protein required for
stability/mobility of mature sperm.
lodothyronine deiodinases Production and regulation of level of active thyroid hormone, T3, from (three isoforms) thyroxine, T4.
Thioredoxin reductases Reduction of nucleotides in DNA synthesis: regeneration of antioxidant (probably three isoforms) systems; maintenance of intracellular redox state, critical for cell viability and proliferation of gene expression by redox control of binding of transcription factors to DNA.
Required for biosynthesis of selenophosphate, the precursor of selenocysteine, and therefore for selenoprotein synthesis.
Found in plasma and associated with endothelial cells. Appears to protect endothelial cells against damage from peroxynitrite.
Needed for muscle function.
Found in epithelial cells of ventral prostate. Seems to have redox function (resembles GPx4), perhaps protecting secretory cells against development of carcinoma.
DNA-bound spermatid Glutathione peroxidase-l.ke activity. Found in stomach and in nuclei of selenoprotein (34KDa) spermatozoa, May protect developing sperm.
18 KDa selenoprotein Important selenoprotein found in kidney and large number of other tissues. Preserved in selenium deficiency.
Selenophosphoate synthetase, SPS2 Selenoprotein P
Selenoprotein W
Prostate epithelial selenoprotein (15KDa)
Food Se
(Se-proteins, other Se-Compounds) +GSH/ tJADPH SeM et Trans-selenation GSSESG Reductive Metabolism SeCys GSSEH (3-lyases H2Se Seryl-tRNA' Methylation excreation CH,SeH Synthetic Metabolism CH3SeCH3 (Breath) Se-proteins
[image:30.615.125.473.11.288.2](GPX, TDI, TR, SePsyn, Se-P, Se-W, others)
Figure 1.1 Pathways of Se metabolism (6).
1.2 Sele n iu m De fic ie n c y in h u m a n s
respiratory morbidity among low-birth-weight newborns. Low Se levels have also been associated, pre-eclampsia, spontaneous abortions, and male infertility. Studies on patients with several other diseases have shown low concentration of the element. However, it is important to point out that in most of these conditions it is unclear whether the low selenium levels is as a result of the disease or due to low selenium intake (6).
1.3 Ef fe c ts o f Ad e q u a te Sele n iu m In ta k e
Several studies have found evidence of the anti-carcinogenic potential of Se. An inverse relationship between the intake of Se and cancer risk has been shown. Studies in rat, mince and pig have shown that intake of Se can inhibit tumourigenesis (6). A Nutritional Prevention of Cancer (NPC) trial carried out in USA showed that selenium supplementation at 200 pg Se/d (in the form of Se-enriched yeast) was associated with significantly lower incidences of total non-skin cancer (37 %), total carcinomas (45 %), with reductions of 63%, 58%, and 46% in the incidences of prostate, colon-rectum and lung cancers, respectively (6). In addition, mortality due to lung (53%) and total cancers (50%) were reduced. These findings demonstrate the importance of selenium supplementation in human health and disease.
The main source of selenium is the diet but adequate intake of the element is assured only when there are adequate levels in the soil. Recently there has been an increase in the use of selenium-containing diet supplementation in a bid to meet the recommended intake of the element. The form of Se in those supplements are either, organic, selenomethionine, or inorganic, selenite or selenate or a mixture of both. However there is still no conclusive evidence to suggest which selenium form is more bioavailable inspite of the number of studies (4 -8) that have been carried out. A study by W. Windisch et al (9) concluded that the bioavailability of the element is as follows: Se (IV) > selenocysteine » > selenomethionine. They found that selenium amino acids can be absorbed to a higher extent than selenite. However, selenium amino acids are less available for metabolism.
1.4 Sele n iu m To x ic it y
selenifereous areas (5, 6,10). In parts of China where soil and coal selenium were high (8 and 84 g Se Kg*1), respectively, morbidity was about 50%. The symptoms include loss of hair and nails, as well as skin lesions, such as erythema, oedema, eruptions, intense itching; in addition, hepatomegaly, polyneuritis and gastrointestinal disturbances were observed. Intoxication is thus always due to compounds such as selenites, selenates, and organic selenium compounds found in plants. An oral dose 10 mg Kg*1 of selenite per body weight is lethal for pigs, dogs, and cats, whereas 4 mg Kg'1 of metallic selenium is tolerated without adverse effects. An oral intake of 5 to 15 mg selenate per Kg of body weight results in chronic intoxication. Ingestion of plants containg 45 mg Kg*1 organic bound selenium is fatal to sheep but the same amount of selenium taken as selenite does not cause poisoning. A daily dose of 1 or 0.5 mg Kg*1 body weight, respectively, causes poisoning after a few days in cattle and sheep. Acute poisoning characterised by irritation, gastroenteritis, vomiting, diarrhoea, and collapse (“ blind staggering”) appears after ingesting feed with a selenium content of more than 20 mg Kg*1 for four weeks. Others symptoms include loss of appetite, central nervous paralysis, ataxia, emaciation, psycho-depression, and myopathy in lambs and calves. In horses, hair loss in the mane and tail are observed, and cattle lose the tips of their tails. Detachment of the hooves occurs in horses. Selenium is teratogenic in sheep. The main symptom of chronic poisoning, known as alkali disease, is emaciation, which appears when feed contains more than 10 mg Kg*1 of selenium. Selenium intoxication can be reduced by using protein-rich feed (11).
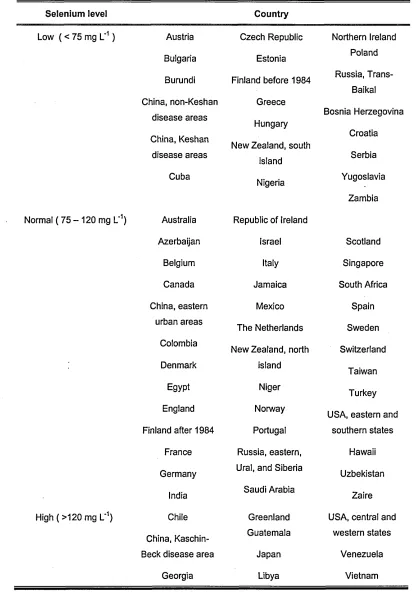
Hydrogen selenide is the most acutely toxic selenium compound. Exposure to hydrogen selenide by inhalation results in primary respiratory effects, such as irritation of the mucous membranes, pulmonary oedema, severe bronchitis, and bronchial pneumonia. The only selenium compound that has been shown to be carcinogenic in animals is selenium sulphide, which increased the incidence of liver tumours in rats and mice after oral exposure. Selenium sulphide is a pharmaceutical compound used in anti-dandruff shampoos and has different properties compared to the inorganic selenium compounds found in foods and the environment (12). Combs (6) has reviewed the selenium levels in blood around the world, and the results can be classified into three groups as shown in Table 1. 2 Se concentrations in the range of 7 2 -1 2 0 pg L'1 are taken as normal values.
Table 1.2 Global distribution of Se level in blood based on data reported by Combs et al (6)
Selenium level Country
Low ( < 75 mg L‘1 ) Austria Czech Republic Northern Ireland Bulgaria Estonia Poland Burundi Finland before 1984 Russia,
Trans-Baikal China, non-Keshan Greece
disease areas China, Keshan
Hungary New Zealand, south
Bosnia Herzegovina Croatia disease areas
island Serbia Cuba
Nigeria Yugoslavia Zambia Normal ( 75 - 120 mg L'1) Australia Republic of Ireland
Azerbaijan Israel Scotland Belgium Italy Singapore Canada Jamaica South Africa China, eastern Mexico Spain
urban areas
The Netherlands Sweden Colombia
New Zealand, north Switzerland Denmark island
Taiwan Egypt Niger Turkey England Norway
USA, eastern and Finland after 1984 Portugal southern states
France Russia, eastern, Hawaii Germany Ural, and Siberia Uzbekistan
India Saudi Arabia Zaire High (> 1 2 0 mg L*1) Chile Greenland USA, central and
China, Kaschin- Guatemala western states Beck disease area Japan Venezuela
1
.5 S
ourcesofS
elenium1.5.1 Soils and rock
Major contributions to the global distribution of selenium include: continental and volcanic dusts, industrial particulates and volcanic gas, and the burning of fossil fuel, each of which contribute 3 x10⁸, 1 x10⁸, 50 x108, 0.3 x10⁸, and 90 x108,g year'1, respectively, of the element. Soil Se content ranges from 0.02 to 2.5 pg g'1(2). Sedimentary rocks are the major materials which make up agricultural soils. The concentration of the element in sedimentary rock and sandstone ranges between 0.08 to 1 pg g'1 and 0.05 to 1 pg g'1, respectively. Carbonate rocks contain between 0 to 20 pg g'1 of the element. The concentration of Se in coal ranges from 0.1 to 4 pg g'1. Consequently, when coal or oil are burned, Se is introduced into the atmosphere and deposited far away from the source by precipitation.
Soil Se content ranges from 0.02 to 2.5 pg g'1. In acid ferriginous soils, selenium is found as a basic selenite or strongly adsorbed to iron (III) oxide (6, 2).
1.5.2 Selenium in waters
In natural waters, Se can occur in four oxidation states: selenate (VI), selenite (IV), elemental selenium (0), and selenide (-II), in a variety of organic and inorganic compounds. Chemical equilibrium is rarely achieved with respect to the distribution of the various oxidation states. Selenate species should thermodynamically predominate in well-oxygenated surface waters, but this is frequently not the case. Most of the transformations of Se appear to be microbially mediated and its methylation is of both biological and environmental significance (1, 3). Surface, ocean and well waters contain less than 0.05 mg L'1 selenium, but spring and irrigation drainage waters contain over 1 mg L*1. The average concentration of selenium in the major oceans is 0.09 mg L'1. Higher concentrations of Se have been observed in acidic and weakly basic waters of pH 2.4 - 3.0 and 7.4 - 8.0, respectively. In the United States, levels in drinking water exceeding 0.01 mg mL'1 are classified as potentially dangerous and could constitute grounds for rejection of the water supply (2, 3).
1. 5.3 Selenium in plants
The normal selenium level in plants is 0.01 to 0.1 mg Kg. Soil concentrations of 100 mg Kg'1 result in plant levels of up to 50 or even 100 mg Kg'1 (11). The Se content in plants depends on a number of factors such as the level of the element in the soil, type of plant, and the soil conditions. Indicator plants which take up selenium can be divided into two categories: primary and secondary. Primary indicators include plants such as Astragalus, Machaeranthera, Haplopappus and Stanley for which Se is essential for their growth, and contain several mg g'1 of the element. Secondary indicators do not require selenium for their growth; these include Aster, Atriplex, and Grndelina, which contain the element when they are grown in selenium-containing soils. Se is taken up by plants either as selenate, selenite or organic selenium. Selenate and sulphate ions are taken by similar processes In the plant root. Selenite ions are more easily absorbed and assimilated than selenate.
The uptake of Se in plants can be inhibited by sulphur because their compounds compete for similar transport pathways across cell membranes. This is particularly evident in the antagonism between sulphate and selenate, or between methionine and selenomethionine.
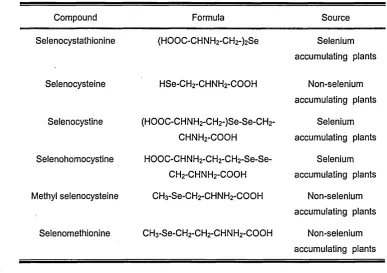
[image:35.615.92.480.421.694.2]A list of the selenium compounds found in plants is shown in Table 1. 3.
Table 1.3 Selenium species in plants (13).
Compound Formula Source
Selenocystathionine (HO O C-CHNH2-CH2-)2Se Selenium accumulating plants
Selenocysteine HSe-CH2-CH NH2-COOH Non-selenium accumulating plants Selenocystine (HO O C-CHNH2-CH2-)Se-Se-CH2- Selenium
c h n h2-c o o h accumulating plants
Selenohomocystine HO O C-CHNH2-CH2-C H 2-Se-Se- Selenium CH2-CHNH2-COOH accumulating plants Methyl selenocysteine CH3-Se-CH2-CH NH2-COOH Non-selenium
accumulating plants Selenomethionine CH3-Se-CH2-CH2-CH NH2-COOH Non-selenium
The Se compounds supplied to the plant may also influence the proportions of accumulated organic selenium and selenate in the stem and leaves; Astragalus shows a selenium distribution where the organoselenium compounds are accumulated only in the stalk and leaves while selenite is found mainly in the roots. In addition, when the concentration of selenate in soils is decreased, the proportion of the organic forms is increased (2).
1.5.4 Selenium in food
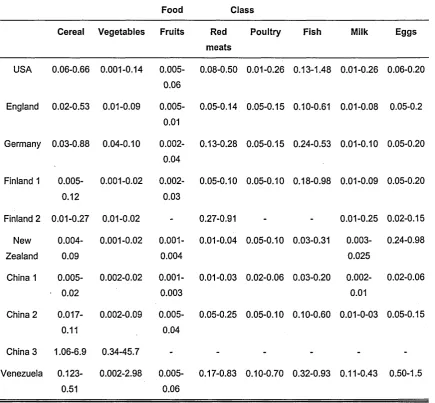
The minimum selenium requirement in food is 0.04 mg Kg'1. A level of about 0.1 mg Kg'1 is optimal and concentrations exceeding 4 mg Kg'1 may lead to toxic symptoms (11). Most fruits and vegetables generally contain less than 0.01 pg g'1 Se, except for garlic, mushrooms and radish, which contain 0.25, 0.13 and 0.04 mg g'1, respectively. Wholewheat flour and bread contain two to four times more selenium than white flour and bread. The Se content of egg white is about three times less than the yolk; brown sugar contains about four times more Se than white sugar. The quantity of Se in meat samples varies over a wide range. In red meat, the selenium concentrations range between 0.01-0.03 or 0.27-0.91 pg g'1 as shown in Table 1. 4. The selenium concentrations depend upon a number of factors such as the anatomical location of the meat. The distribution in animals shows that vital organs such as the liver and kidney usually contain the highest selenium levels, although high levels can also be found in the pancreas, spleen, heart or lungs (6).
Table 1. 4 Typical selenium contents in food (pg g'1) (6).
Food Class Cereal Vegetables Fruits Red
meats
Poultry Fish Milk Eggs
USA 0.06-0.66 0.001-0.14 0.005-0.06
0.08-0.50 0.01-0.26 0.13-1.48 0.01-0.26 0.06-0.20
England 0.02-0.53 0.01-0.09 0.005-0.01
0.05-0.14 0.05-0.15 0.10-0.61 0.01-0.08 0.05-0.2
Germany 0.03-0.88 0.04-0.10 0.002-0.04
0.13-0.28 0.05-0.15 0.24-0.53 0.01-0.10 0.05-0.20
Finland 1 0.005-0.12
0.001-0.02 0.002-0.03
0.05-0.10 0.05-0.10 0.18-0.98 0.01-0.09 0.05-0.20
Finland 2 0.01-0.27 0.01-0.02 - 0.27-0.91 - - 0.01-0.25 0.02-0.15 New Zealand 0.004-0.09 0.001-0.02 0.001-0.004
0.01-0.04 0.05-0.10 0.03-0.31 0.003-0.025
0.24-0.98
China 1 0.005-0.02
0.002-0.02 0.001-0.003
0.01-0.03 0.02-0.06 0.03-0.20 0.002-0.01
0.02-0.06
China 2 0.017-0.11
0.002-0.09 0.005-0.04
0.05-0.25 0.05-0.10 0.10-0.60 0.01-0-03 0.05-0.15
China 3 1.06-6.9 0.34-45.7 - - - - - -Venezuela
0.123-0.51
0.002-2.98 0.005-0.06
0.17-0.83 0.10-0.70 0.32-0.93 0.11-0.43 0.50-1.5
Finland 1: before 1984 and 2: after 1984. China 1: non-Keshan disease areas, 2: Keshan disease areas, and 3: China, Kaschin-Beck disease area, selenosis area.
1.6 Se le n iu m Uses
1.7 M
ethodsofA
nalysisThe determination of the total Se in biological materials is now a routine task for many laboratories; however, a few problems still remain. A review of the various methods of selenium pretreatment and determination are given below.
1.7.1 Separation and preconcentration
1.7.1.1 Volatilisation
Hydrogen selenide is formed when Se (IV) is reduced with NaBH4 in a strong acid medium. Selenium (VI) is reduced to Se (IV) before hydride generation, usually with boiling 4-7 M HCI. To avoid the back-oxidation of Se (IV) by residual Cl2, the system must be flushed with an inert gas during the process. It advisable to strip the hydride from the system at low pH in order to avoid dissociation. The efficiency of the Se (IV) reduction with NaBH4 is increased if iodine or bromide is present during the reduction step. The reaction is accelerated by using a HBr medium for prereduction and hydride generation. Generation of H2Se is interfered by the presence of metals fine precipitates of which are formed upon reduction with NaBH4 and which can capture and decompose the H2Se. Other interferents include hydride-forming elements, which compete for the reagent, and redox species. These types of interference have been comprehensively discussed (14). The mechanisms have been studied with emphasis on bivalent metals (Sn (II), Ni, Co, Cd, Zn, Fe (II)) and Cu, Ag and Au. Interferences can be alleviated by increasing the HCI and decreasing the NaBH4 concentrations, masking with 1-10-phenanthroline or hexacyanoferrate (III) or addition of Fe (III) that acts as a redox buffer. The most troublesome is the interference with Cu. Separation or masking copper can remove this type of interference. Ni is also an interferent that can be masked with citric acid or removed. Lead can be precipitated as PbCI2. The sources of systematic errors in HG-AAS have been studied by the radiotracer technique (14).
Various semiautomated or automated systems for hydride generation have been developed (14). Experimental detection limits can be enhanced by trapping the H2Se on a Pd-modified graphite furnace or cryogenically on GC packing. The memory effects related to the deposition of unreacted analyte, metal selenide (e.g., CuSe), or H2Se on the surface of the Teflon mixing tube and gas-liquid separator have been discussed. Other volatilisation methods include the distillation of SeBr4 or SeCI4 from concentrated HBr and HCI, respectively, or the formation of volatile species by reacting Se (IV) with NaBEtior 1,2-diaminobenzene and its derivatives.
1.7.1.2 Extraction
Selenium (IV) has been extracted as Sel4 into toluene. Piazselenols formed by the reaction of Se (IV) with 1,2-diaminobenzene or 2,3-diaminonaphthalene or its derivatives are readily extractable into nonpolar solvents. Extraction of Se (IV) with dithiocarbamates while interferents are masked with ascorbic acid is an alternative procedure (14).
1.7.1.3 Sorption
Sorption of Se on thiol cotton fibre, Bismuthiol II sulphonate and anion-exchange resins have been reported. Sorption of the Se-APDC complex on activated carbon is an alternative (14).
1.7.2 Titrimetric methods
Titrimetric methods have been used for the determination of milligram amounts of Se. This method is based on the formation of sparingly soluble selenium compounds, and can be classified into four groups: as reduction of Se (VI) to Se (IV), and of Se (IV) to Se (0) and oxidation of Se (IV) to Se (VI) and Se (0) to Se (IV) or Se (VI). In the iodometric determination, an excess of potassium iodide is added and liberated iodine is titrated with standard sodium thiosulphate solution. The disadvantage of the method is that the starch-iodine end point is rendered less sharp by red selenium. It can be prevented by extracting the liberated iodine with an organic solvent, such as chloroform or carbon tetrachloride. Similarly, Te (IV) forms the complex, Tel62', which quantitatively reacts with thiosulphate Na2S20 3. To prevent the hydrolysis of Te(S20 3)22', an excess of sodium thiosulphate is necessary (2).
Se2° 32'+ 4 f + 6 H+— - S e + 2 L + 3 H O
2
T e l* + 4 S20 3 2' 6 f + Te(S20 3)22' + S40 2'
Te(S20 3)22 + 2 ^ Te(OH)2 + 2H + + 2 S20 3 2'
2 Te(OH)2 ^ Te + H2TeQ3 + H O
1.7.3 UV-visible spectrophotometric methods
Spectrophotometric methods are more sensitive and selective than both gravimetric and titrimetric methods. Spectrophotometric measurements are based on the formation of complex compounds. For the colorimetric determination of selenium, reductants such as tin (II) chloride or hydrazine can be used. The solutions of the elements obtained by such reduction absorb at 390 nm and 259-260 nm, respectively. Gum arabic or poly(vinyl alcohol) can be used as solution stabilisers.
Methods based on the formation of piazselenols with O-diamines, complexes with organic reagents containing sulphur, diazonium with organic reagents containing sulphur, diazonium salts by oxidation of organic compounds, and Se (II) complexes with semicarbazide and thiocarbazide are known. Reaction of Se (IV) with 3,3'-diaminobenzidine (DAB) at pH 2.5 gives an intense yellow compound, diphenylpiazselenol, that is extracted at pH 5 with toluene. EDTA is used to mask the interference from doubly charged cations. The most widely used is the method based on the reaction of Se (IV) with 3,3’-diaminobenzidine to form the yellow piazselenol either in the aqueous phase or on extraction into toluene (e = 1x10⁴) at 420 nm (2,14).
1.7.4. Spectrofluorimetric methods
Spectrofluorimetric methods are usually not sufficiently sensitive for biological specimens; however, toxic concentrations of the element can be determined. Monopiazselenol is formed from diaminobenzidine (DAB) and selenious acid. Se in the sample should first be converted to Se (IV), which forms a monopiazselenol, extractable in an organic solvent. The reaction rate of 2,3- diaminonaphthalene (DAN) produces a complex similar to that produced by DAB but with a higher intensity signal. Another fluorescent method used recently is based on the oxidation of 2- (a-Pyridyl) thioquinaldinamide (PTQA) by Se (IV) in acidic medium. This method does not require extraction before the fluorescence measurement, and detection limits of 10 pg L'1 have been reported (14,15).
1.7.5 Atomic Absorption Spectrometry (AAS) methods
Flame AAS offers a sensitivity of 0.6 pm m l/1 in the recommended air-C2H2 oxidising (lean) flame when measurements are carried out at 196.1 nm. Because of
considerable radiation scatter, background correction is essential in order to improve accuracy.
Methods based on AAS have been used extensively for the determination of Se. These include hydride-generation AAS in which hydrogen selenide is formed as a volatile analyte by the reduction of Se with reagents such as NaBH4 (see section 1.7.1.1 and 1.8.3.3), Zn, Kl, and SnCI2. Noble metals, oxidants, potassium iodide and some ions can interfere with the analysis. To separate the interferents, selenium is extracted from the aqueous solutions using an appropriate organic compound, leading to increased sensitivity (14).
1.7.6 Graphite furnace atomic absorption spectrometry methods
Graphite furnace AAS offers a detection limit of 10 pg. Iron oxide formed in the presence of oxygen is the major interferent causing overcorrection when D2 background correction is used. The remedies include either Zeeman background correction or the addition of CO or Pt. Other spectral interferences are caused by the presence of Ni and P2. Deuterium correction may not compensate for the background of Ca and Mg phosphates, so for routine analysis, Zeeman correction should be used. Volatility losses can also cause errors in this determination. Selenium, if present as organoselenium, can be lost during the ashing and atomisation stages because of the formation of volatile H2Se or Se02. The thermal behaviour is dependent on the oxidation states (14). Nickel stabilises Se (IV) and Se (VI) in the presence of NaCI and Na2S 04 and also converts the interfering PO+ into free P atoms.
The sulphate interference can be overcome by the addition of Ba(N03)2. Matrix modification is always required in order to prevent losses due to volatilisation.
1.7.7 Atomic emission spectrometry (AES) methods
1.7.8 Atomic fluorescence spectrometry (AFS) methods
Non-dispersive AFS with atomisation of H2Se using a combined electrothermally heated quartz tube-fiame atomiser offers a detection limit of 0.03 ng. Electrothermal atomic fluorescence spectrometry offers a detection limit of 15 - 80 fg and with Pd(N03)2 as matrix modifier can be applied to various samples (14).
1.7.9 Neutron activation methods
There are only three radionuclides of selenium produced by thermal neutron irradiation, 75Se, 77Se, 81Se, with half lives of 120 days, 15.55 and 18.6 min, respectively.
In the application of neutron activation, the unknown sample and a known weight of pure Se are exposed simultaneously to the same neutron flux. After irradiation, the sample and standard are allowed to cool for 2 weeks in order to reduce interference from short lived isotopes. For the radiochemical determination of Se, both sample and standard are digested with acid and the element is separated from the solution and precipitated by hydrazine or hydroxylamide from 8 mol L'1 HCI or by sulphur dioxide from 6 mol L*1 HCI in boiling solution. The precipitated Se is dried and weighed, and its activity is measured under the same conditions. The detection limit on 75Se ranges from 0.0005 to 0.10 pg according to the sample size, neutron, flux, irradiation period and the type of radiochemical separation used (2).
1.7.10 The choice of techniques for Se determination
Haygarth et al (16) have reviewed the broad range of contemporary instrumental techniques commonly reported for the determination of total selenium. The techniques include fluorimetry, radiochemical neutron activation analysis (RNAA), hydride generation atomic spectrometry (HGAAS), both with a commercially available HG system and flow injection (FI) HG systems, HG inductively coupled plasma atomic emission spectrometry (HG-ICP-AES), and HG-ICP mass spectrometry (HG- ICP- MS). The authors conclude that fluorimetry, HGAAS and HG-ICP-AES will continue to be usefully employed for routine laboratory determination of Se, although the fluorimetric methods are becoming dated.
Total
-selenium » Sample —pretreatment
Titration methods • X-Diffraction
Spectroscopy
Atomic Absorption S Graphite-furnance AAS Atomic Fluorescence S
OES
4
'ICP-MS Fluorescence S UV-Visible S
Selenium
species -> Sample —pretreatment Electrophoresis
i— Gas •Chromatography
L -
Liquid-Normal phase or Reversed phased Ion-exchange Size Exclusion
— Sequential extraction
-Ion-exchange columns - Adsortion columns
— Liquid-liquid extraction
Electro-analytical speciation
[image:43.612.82.521.13.465.2]^--- ► Cathodic stripping voltametry
Figure 1. 3 Schematic description of the analytical methods used for selenium speciation and determination.
1.7.11 Speciation techniques
distribution of species in a particular sample or matrix. Chemical element speciation is related to the specific form of an element defined as isotopic composition, electronic or oxidation state, and/or complex or molecular structure. Some of the separation techniques used for chemical speciation are reviewed below.