organic papers
o180
Aouatef Cherouanaet al. C5H7N5O2+SO42ÿH2O DOI: 10.1107/S1600536803000953 Acta Cryst.(2003). E59, o180±o182 Acta Crystallographica Section EStructure Reports
Online ISSN 1600-5368
Guaninium sulfate monohydrate
Aouatef Cherouana,
Nourredine Benali-Cherif* and Lamia Bendjeddou
Laboratoire de Chimie MoleÂculaire, du ControÃle de l'Environnement et des Mesures Physico-Chimiques, Faculte des Sciences, DeÂpartement de Chimie, Universite Mentouri de Constantine, 25000 Constantine, Algeria
Correspondence e-mail: [email protected]
Key indicators Single-crystal X-ray study T= 293 K
Mean(C±C) = 0.003 AÊ Rfactor = 0.032 wRfactor = 0.081
Data-to-parameter ratio = 11.3
For details of how these key indicators were automatically derived from the article, see http://journals.iucr.org/e.
#2003 International Union of Crystallography Printed in Great Britain ± all rights reserved
In the crystal structure of the title compound, C5H7N5O2+SO42ÿH2O, the guaninium cation, the sulfate
anion and the water molecule form a network of hydrogen bonds. The structure consists of layers of guaninium ions and water molecules parallel to the diagonal of theacplane, linked by strong hydrogen bonds.
Comment
The structure elucidation of nucleic acids and their derivatives is of interest, because of their widespread biological occur-rence (Richardset al., 1972; Perutz & Eyck, 1972). A number of these compounds are effective metabolic inhibitors with useful chemotherapeutic activity (Roy-Burman, 1970; Balis, 1968; Hitchings & Elion, 1963). In several crystal structures of compounds with organic bases and inorganic acids, the structural cohesion is assured by strong hydrogen bonds, as was observed in guaninium dinitrate dihydrate (Bouchouitet al., 2002), adeninium sulfate (Langer & Huml, 1978a), adeninium hemisulfate hydrate (Langer & Huml, 1978b) and adeninium hydrobromide hemihydrate (Langer & Huml, 1978c). Two structures of guanine with inorganic acids have been reported, namely guaninium dinitrate dihydrate and guaninium dichloride (MatkovicÂ-CÏalogovic & SankovicÂ, 1999).
The determination of the crystal and molecular structure of guaninium sulfate hydrate, (I), forms part of a study of the interactions between organic bases and inorganic acids. The dimensions of the sulfate anion (Fig. 1) are comparable with those found in other sulfates (e.g. Cherouana et al., 2002; Srinivasan et al., 2001). The SÐO bond lengths are in the range 1.4653 (16)±1.4874 (13) AÊ, while the OÐSÐO angles range from 108.23 (8) to 110.88 (9). As was observed in
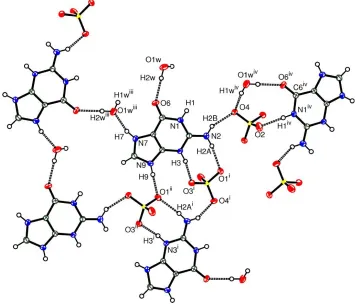
guaninium dinitrate dihydrate, the imino groups of the py-rimidine and imidazolyl moieties (N3 and N7) in guanine are protonated. There is an intricate hydrogen-bond network (Fig. 2). The diprotonated guanine in (I) is hydrogen bonded
to four sulfate groups [viaN1ÐH1 O2 for the ®rst group, N3ÐH3 O3 and N2ÐH21 O1 for the second group, N9Ð H9 O1 for the third and N2ÐH21 O3 and N2ÐH22 O4 for the last group]. We also observed that the water molecule forms three hydrogen bonds with the guaninium and sulfate ions, in two modes,viz. as donor with the sulfate anion [via
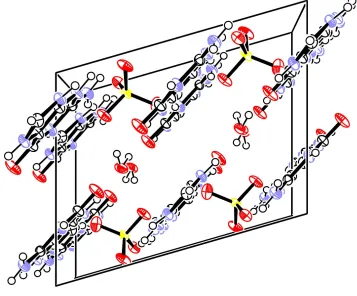
O1WÐH1W O4 and O1WÐH2W O6] and as acceptor with the guaninium ion [viaN7ÐH7 O1W]. This system of hydrogen bonds among the guaninium cations, the sulfate anions and the water molecule generates a succession of layers parallel to the diagonal of the ac plane (Fig. 3). Layers of guaninium cations and water molecules are linked by strong anion±cation and anion±water hydrogen bondsviathe sand-wiched sulfates.
Experimental
Colorless single crystals of guaninium sulfate monohydrate were obtained after two weeks by slow evaporation, at room temperature, of an equimolar aqueous solution of guanine and sulfuric acid.
Crystal data C5H7N5O2+SO42ÿH2O
Mr= 267.24
Monoclinic,P21=c
a= 8.9940 (3) AÊ
b= 10.2020 (2) AÊ
c= 11.0440 (3) AÊ
= 106.04 (2)
V= 973.9 (1) AÊ3
Z= 4
Dx= 1.823 Mg mÿ3
MoKradiation Cell parameters from 6875
re¯ections
= 2.8±26.4
= 0.37 mmÿ1
T= 293 (2) K Plate, colorless 0.400.100.01 mm Data collection
Nonius KappaCCD diffractometer
'scans
Absorption correction: none 6875 measured re¯ections 1821 independent re¯ections 1631 re¯ections withI> 2(I)
Rint= 0.033
max= 26.4
h=ÿ11!11
k=ÿ12!12
l=ÿ12!12
Re®nement Re®nement onF2
R[F2> 2(F2)] = 0.032
wR(F2) = 0.081
S= 1.11 1821 re¯ections 161 parameters
H atoms treated by a mixture of independent and constrained re®nement
w= 1/[2(F
o2) + (0.0361P)2
+ 0.4753P]
whereP= (Fo2+ 2Fc2)/3
(/)max< 0.001
max= 0.26 e AÊÿ3
min=ÿ0.41 e AÊÿ3
Table 1
Hydrogen-bonding geometry (AÊ,).
DÐH A DÐH H A D A DÐH A
N3ÐH3 O3i 0.86 1.75 2.6011 (19) 167
N9ÐH9 O1ii 0.86 1.81 2.6526 (19) 167
N7ÐH7 O1Wiii 0.86 1.80 2.637 (2) 164
N1ÐH1 O2iv 0.86 1.91 2.738 (2) 160
N2ÐH2A O1i 0.86 2.09 2.934 (2) 166
N2ÐH2B O4 0.86 2.07 2.829 (2) 146 O1WÐH1W O4iv 0.86 (2) 2.00 (2) 2.838 (2) 164 (3)
O1WÐH2W O6 0.86 (2) 1.93 (2) 2.793 (2) 178 (1) Symmetry codes: (i) ÿx;1
2y;32ÿz; (ii) x;1y;z; (iii) 1ÿx;12y;12ÿz; (iv)
x;1 2ÿy;zÿ12.
Acta Cryst.(2003). E59, o180±o182 Aouatef Cherouanaet al. C5H7N5O2+SO42ÿH2O
o181
organic papers
Figure 2
ORTEP-3 (Farrugia, 1997) view, showing the intricate hydrogen-bond
interactions between anions and cations. [Symmetry codes: (i)ÿx, y+1 2,
ÿz+3
2; (ii)x,y+ 1,z; (iii)ÿx+ 1,y+12,ÿz+12; (iv)x,ÿy+12,zÿ12.]
Figure 3
ORTEP-3 (Farrugia, 1997) diagram of the layered packing of the title
compound, viewed down thebaxis.
Figure 1
ORTEP-3 (Farrugia, 1997) view of the title compound, with the atomic
organic papers
o182
Aouatef Cherouanaet al. C5H7N5O2+SO42ÿH2O Acta Cryst.(2003). E59, o180±o182H atoms attached to C and N atoms were ®xed at localized posi-tions and re®ned using a riding model. H atoms belonging to the water molecule were re®ned with an overall isotropic displacement parameter, using restraints.
Data collection:KappaCCD Reference Manual(Nonius, 1998); cell re®nement: DENZO and SCALEPACK (Otwinowski & Minor, 1997); data reduction:DENZOandSCALEPACK; program(s) used to solve structure:SIR92 (Altomareet al., 1993); program(s) used to re®ne structure:SHELXL97 (Sheldrick, 1997); molecular graphics: ORTEP-3 (Farrugia, 1997); software used to prepare material for publication:WinGX(Farrugia, 1999).
This work is supported by Mentouri-Constantine Univer-sity, Algeria. We thank Drs M. Pierrot and M. Giorgi (LBS-UMR 6517, Faculte des Sciences et Techniques de Saint JeÂroÃme, Avenue Escadrille Normandie Niemen, 13397 Marseille Cedex 20, France) for providing diffraction facilities.
References
Altomare, A., Cascarano, G., Giacovazzo, C. & Guagliardi, A. (1993).J. Appl. Cryst.26, 343±350.
Balis, M. E. (1968). Antagonists and Nucleic Acids. New York: American Elsevier.
Bouchouit, K., Benali-Cherif, N., Benguedouar, L., Bendheif, L. & Merazig, H. (2002).Acta Cryst.E58, o1397±o1399.
Cherouana, A., Benali-Cherif, N., Bendjeddou, L. & Merazig, H. (2002)Acta Cryst.E58, o1351±o1353.
Farrugia, L. J. (1997).J. Appl. Cryst.30, 565. Farrugia, L. J. (1999).J. Appl. Cryst.32, 837±838.
Hitchings, G. H. & Elion, G. B. (1963). InMetabolic Inhibitors, Vol. I, edited by J. H. Quastel and R. M. Hochster, pp. 215±237. New York: Academic Press. Langer, V. & Huml, K. (1978a).Acta Cryst.B34, 1157±1163.
Langer, V. & Huml, K. (1978b).Acta Cryst.B34, 2229±2234. Langer, V. & Huml, K. (1978c).Acta Cryst.B34, 1881±1884.
MatkovicÂ-CÏalogovicÂ, D. & SankovicÂ, K. (1999).Acta Cryst.C55, 467±469. Nonius (1998). KappaCCD Reference Manual. Nonius BV, Delft, The
Netherlands.
Otwinowski, Z. & Minor, W. (1997). Methods in Enzymology, Vol. 276,
Macromolecular Crystallography, Part A, edited by C. W. Carter Jr and R. M. Sweet, pp. 307±326. New York: Academic Press.
Perutz, M. F. & Ten Eyck, L. F. (1972).Cold Spring Harbor Symp. Quant. Biol.
36, 295±310.
Richards, M. F., Wyckoff, H. W., Carlson, W. D., Allewell, N. M., Lee, M. & Mitsui, Y. (1972).Cold Spring Harbor Symp. Quant. Biol.36, 25±43. Roy-Burman, P. (1970).Analogs of Nucleic Acid Components. New York:
Springer-Verlag.
Sheldrick, G. M. (1997).SHELXL97. University of GoÈttingen, Germany. Srinivasan, N., Sridhar, B. & Rajaram, R. K. (2001),Acta Cryst.E57, o754±
supporting information
sup-1
Acta Cryst. (2003). E59, o180–o182supporting information
Acta Cryst. (2003). E59, o180–o182 [doi:10.1107/S1600536803000953]
Guaninium sulfate monohydrate
Aouatef Cherouana, Nourredine Benali-Cherif and Lamia Bendjeddou
S1. Comment
The structure elucidation of nucleic acids and their derivatives is of interest, because of their widespread biological
occurrence (Richards et al., 1972; Perutz & Eyck, 1972). A number of these compounds are effective metabolic inhibitors
with useful chemotherapeutic activity (Roy-burman, 1970; Balis, 1968; Hitchings & Elion, 1963). In several crystals of
compounds with organic bases and inorganic acids, the structure cohesion is assured by strong hydrogen bonds as was
observed in guaninium dinitrate dihydrate (Bouchouit et al., 2002), adeninium sulfate (Langer & Huml, 1978a),
adeninium hemisulfate hydrate (Langer & Huml, 1978b) and adeninium hydroboromide hemihydrate (Langer & Huml,
1978c). Two structures of guanine with inorganic acids have been reported, namely guaninium dinitrate dihydrate and
guaninium dichloride (Matkovic-Calogovic & Sankovic, 1999).
The determination of the crystal and molecular structure of guaninium sulfate hydrate, (I), forms part of a study on the
interactions between organic bases and inorganic acids. The dimensions of the sulfate anion (Fig. 1) are comparable with
those found in other sulfates (e.g. Cherouana et al., 2002; Srinivasan et al., 2001). The S—O bond lengths are in the
range 1.4653 (16)–1.4874 (13) Å, while the O—S—O angles range from 108.23 (8) to 110.88 (9)°. As was observed in
guanium dinitrate dihydrate, the imino groups of the pyrimidine and imidazolyl moieties (N3 and N7) in guanine are
protonated. There is an intricate hydrogen-bond network (Fig. 2). The diprotonated guanine in (I) is hydrogen bonded to
four sulfate groups [via N1—H1···O2 for the first group, N3—H3···O3 and N2—H21···O1 for the second group, N9—
H9···O1 for the third and N2—H21···O3 and N2—H22···O4 for the last group]. We also observed that the water molecule
forms three hydrogen bonds with the guaninium and sulfate ions, where it has two different behaviors, viz. as donor with
the sulfate anion [via O1w—H1w···O4 and O1w—H2w···O6] and as acceptor with the guaninium ion [via N7—
H7···O1w]. This system of hydrogen bonds among the guaninium cations, the sulfate anions and the water molecule
generates a succession of layers parallel to the diagonal of ac plane (Fig. 3). Layers of guaninium cations and water
molecules are linked by strong anion–cation and anion–water hydrogen bonds via the sandwiched sulfates.
S2. Experimental
Colorless single crystals of guaninium sulfate monohydrate were obtained after two weeks by slow evaporation at room
temperature of an equimolar solution of guanine and sulfuric acid.
S3. Refinement
H atoms attached to C and N atoms were fixed at localized positions and refined using a riding model. H atoms belonging
supporting information
[image:5.610.129.478.71.263.2]sup-2
Acta Cryst. (2003). E59, o180–o182Figure 1
ORTEP-3 (Farrugia, 1997) view of the title compound with the atomic labelling scheme. Displacement ellipsoids are
drawn at the 50% probability level.
Figure 2
ORTEP-3 (Farrugia, 1997) view showing the intricated hydrogen-bond interactions between anions and cations.
[image:5.610.127.483.318.625.2]supporting information
[image:6.610.125.482.76.372.2]sup-3
Acta Cryst. (2003). E59, o180–o182Figure 3
ORTEP-3 (Farrugia, 1997) diagram of the layered packing of the title compound, viewed down the b axis.
(I)
Crystal data
C5H7N5O2+·SO42−·H2O
Mr = 267.24 Monoclinic, P21/c
Hall symbol: -P 2ybc
a = 8.9940 (3) Å
b = 10.2020 (2) Å
c = 11.0440 (3) Å
β = 106.04 (2)°
V = 973.9 (1) Å3
Z = 4
F(000) = 552
Dx = 1.823 Mg m−3
Mo Kα radiation, λ = 0.71073 Å Cell parameters from 6875 reflections
θ = 2.8–26.4°
µ = 0.37 mm−1
T = 293 K Plate, colorless 0.4 × 0.1 × 0.01 mm
Data collection
Nonius KappaCCD diffractometer
Radiation source: fine-focus sealed tube Graphite monochromator
φ scans
6875 measured reflections 1821 independent reflections
1631 reflections with I > 2σ(I)
Rint = 0.033
θmax = 26.4°, θmin = 2.8°
h = −11→11
k = −12→12
supporting information
sup-4
Acta Cryst. (2003). E59, o180–o182Refinement
Refinement on F2 Least-squares matrix: full
R[F2 > 2σ(F2)] = 0.032
wR(F2) = 0.081
S = 1.11 1821 reflections 161 parameters 1 restraint
Primary atom site location: structure-invariant direct methods
Secondary atom site location: difference Fourier map
Hydrogen site location: inferred from neighbouring sites
H atoms treated by a mixture of independent and constrained refinement
w = 1/[σ2(F
o2) + (0.0361P)2 + 0.4753P] where P = (Fo2 + 2Fc2)/3
(Δ/σ)max < 0.001 Δρmax = 0.26 e Å−3 Δρmin = −0.41 e Å−3
Special details
Geometry. All e.s.d.'s (except the e.s.d. in the dihedral angle between two l.s. planes) are estimated using the full covariance matrix. The cell e.s.d.'s are taken into account individually in the estimation of e.s.d.'s in distances, angles and torsion angles; correlations between e.s.d.'s in cell parameters are only used when they are defined by crystal symmetry. An approximate (isotropic) treatment of cell e.s.d.'s is used for estimating e.s.d.'s involving l.s. planes.
Refinement. Refinement of F2 against ALL reflections. The weighted R-factor wR and goodness of fit S are based on F2, conventional R-factors R are based on F, with F set to zero for negative F2. The threshold expression of F2 > σ(F2) is used only for calculating R-factors(gt) etc. and is not relevant to the choice of reflections for refinement. R-factors based on F2 are statistically about twice as large as those based on F, and R- factors based on ALL data will be even larger.
Fractional atomic coordinates and isotropic or equivalent isotropic displacement parameters (Å2)
x y z Uiso*/Ueq
S1 0.15170 (5) 0.18894 (4) 0.76616 (4) 0.01967 (15)
O1 0.07493 (16) 0.06048 (12) 0.72724 (13) 0.0277 (3)
O4 0.23663 (17) 0.22839 (13) 0.67648 (14) 0.0312 (3)
O3 0.03023 (17) 0.28698 (12) 0.76575 (14) 0.0320 (3)
O2 0.25598 (18) 0.17756 (13) 0.89364 (14) 0.0357 (4)
O6 0.39762 (17) 0.64077 (14) 0.34702 (14) 0.0346 (4)
N3 0.15176 (17) 0.71507 (13) 0.59978 (14) 0.0198 (3)
H3 0.0981 0.7299 0.6518 0.024*
N9 0.18591 (17) 0.94558 (14) 0.55504 (14) 0.0203 (3)
H9 0.1365 0.9819 0.6026 0.024*
N7 0.32181 (17) 0.92071 (14) 0.42100 (14) 0.0221 (3)
H7 0.3735 0.9382 0.3681 0.027*
N1 0.26823 (17) 0.57203 (14) 0.48693 (14) 0.0211 (3)
H1 0.2857 0.4919 0.4708 0.025*
N2 0.13960 (18) 0.49136 (14) 0.62537 (15) 0.0244 (3)
H2A 0.0872 0.5038 0.6787 0.029*
H2B 0.1615 0.4130 0.6073 0.029*
C4 0.2061 (2) 0.81454 (16) 0.54207 (17) 0.0185 (4)
C8 0.2576 (2) 1.00756 (17) 0.47956 (17) 0.0230 (4)
H8 0.2614 1.0980 0.4700 0.028*
C5 0.2918 (2) 0.79703 (16) 0.45925 (17) 0.0197 (4)
C2 0.18605 (19) 0.59172 (16) 0.57161 (16) 0.0189 (4)
C6 0.3272 (2) 0.66855 (17) 0.42342 (17) 0.0218 (4)
supporting information
sup-5
Acta Cryst. (2003). E59, o180–o182H1W 0.438 (3) 0.367 (2) 0.225 (3) 0.059 (6)*
H2W 0.472 (3) 0.493 (2) 0.271 (3) 0.059 (6)*
Atomic displacement parameters (Å2)
U11 U22 U33 U12 U13 U23
S1 0.0285 (2) 0.0127 (2) 0.0228 (3) 0.00125 (16) 0.01545 (18) 0.00129 (15) O1 0.0373 (7) 0.0177 (6) 0.0332 (8) −0.0060 (5) 0.0185 (6) −0.0062 (5) O4 0.0410 (8) 0.0238 (7) 0.0397 (9) 0.0050 (6) 0.0294 (7) 0.0076 (6) O3 0.0409 (8) 0.0187 (7) 0.0478 (9) 0.0089 (6) 0.0313 (7) 0.0072 (6) O2 0.0531 (9) 0.0231 (7) 0.0276 (9) −0.0035 (6) 0.0054 (7) 0.0021 (5) O6 0.0496 (9) 0.0269 (7) 0.0398 (9) 0.0010 (6) 0.0335 (7) −0.0051 (6) N3 0.0254 (8) 0.0176 (7) 0.0215 (9) −0.0007 (6) 0.0147 (6) −0.0010 (5) N9 0.0255 (7) 0.0156 (7) 0.0225 (8) 0.0017 (6) 0.0111 (6) −0.0023 (6) N7 0.0289 (8) 0.0198 (8) 0.0212 (9) −0.0028 (6) 0.0130 (6) 0.0014 (6) N1 0.0306 (8) 0.0145 (7) 0.0213 (9) 0.0010 (6) 0.0123 (6) −0.0027 (5) N2 0.0317 (8) 0.0184 (8) 0.0266 (9) −0.0011 (6) 0.0140 (7) 0.0024 (6) C4 0.0215 (8) 0.0163 (8) 0.0189 (10) −0.0009 (6) 0.0074 (7) −0.0008 (6) C8 0.0302 (9) 0.0167 (8) 0.0221 (10) −0.0012 (7) 0.0075 (7) 0.0002 (7) C5 0.0253 (9) 0.0176 (8) 0.0196 (10) −0.0016 (7) 0.0117 (7) −0.0004 (6) C2 0.0205 (8) 0.0186 (8) 0.0175 (9) −0.0006 (6) 0.0054 (6) −0.0013 (6) C6 0.0257 (9) 0.0205 (9) 0.0220 (10) −0.0004 (7) 0.0113 (7) −0.0020 (7) O1W 0.0284 (7) 0.0383 (9) 0.0367 (9) −0.0038 (6) 0.0184 (6) −0.0123 (6)
Geometric parameters (Å, º)
S1—O4 1.4643 (13) N9—C4 1.362 (2)
S1—O2 1.4647 (16) N7—C8 1.320 (2)
S1—O3 1.4803 (13) N7—C5 1.381 (2)
S1—O1 1.4883 (13) N1—C2 1.358 (2)
O6—C6 1.220 (2) N1—C6 1.396 (2)
N3—C2 1.352 (2) N2—C2 1.309 (2)
N3—C4 1.359 (2) C4—C5 1.361 (2)
N9—C8 1.345 (2) C5—C6 1.431 (2)
O4—S1—O2 110.90 (9) C5—C4—N9 108.44 (15)
O4—S1—O3 109.55 (8) N7—C8—N9 109.73 (15)
O2—S1—O3 109.42 (9) C4—C5—N7 106.31 (14)
O4—S1—O1 109.50 (8) C4—C5—C6 121.14 (15)
O2—S1—O1 109.31 (8) N7—C5—C6 132.47 (16)
O3—S1—O1 108.12 (8) N2—C2—N3 120.14 (16)
C2—N3—C4 116.90 (15) N2—C2—N1 119.97 (15)
C8—N9—C4 107.20 (14) N3—C2—N1 119.89 (15)
C8—N7—C5 108.32 (15) O6—C6—N1 121.71 (16)
C2—N1—C6 126.63 (14) O6—C6—C5 127.03 (17)
N3—C4—C5 124.13 (15) N1—C6—C5 111.26 (15)
supporting information
sup-6
Acta Cryst. (2003). E59, o180–o182Hydrogen-bond geometry (Å, º)
D—H···A D—H H···A D···A D—H···A
N3—H3···O3i 0.86 1.75 2.6011 (19) 167
N9—H9···O1ii 0.86 1.81 2.6526 (19) 167
N7—H7···O1Wiii 0.86 1.80 2.637 (2) 164
N1—H1···O2iv 0.86 1.91 2.738 (2) 160
N2—H2A···O1i 0.86 2.09 2.934 (2) 166
N2—H2B···O4 0.86 2.07 2.829 (2) 146
O1W—H1W···O4iv 0.86 (2) 2.00 (2) 2.838 (2) 164 (3)
O1W—H2W···O6 0.86 (2) 1.93 (2) 2.793 (2) 178 (1)