ON THE EVALUATION OF NON-PROBABILITY SAMPLING AND
LOGISTIC REGRESSION MODEL USED IN DRUG ADDICTION
Md. Shohel Rana*1 and Sanjit Kumer Saha2
1
Assistant Professor, Department of Statistics Islamic University, Kushtia-7003, Bangladesh.
2
Department of Statistics Islamic University Kushtia-7003, Bangladesh.
ABSTRACT
This paper presents Fundamental Ideas of Non-Probability Sampling
with an application. The application based on the prediction of drug
addicted students of Islamic University, Kushtia-7003. For this purpose
primary data are to be collected by using Network Sampling (for drug
addicted) and Purposive Sampling (for non drug addicted) techniques.
We fit the logistic Regression Model to predict the drug addicted or
non drug addicted student based on their monthly family income and
own expenditure. This project also provides the relationship among the
financial status and academic qualification of the respondent‟s parents
and addiction also.
KEYWARDS: Introduction, Literature review, Methodology (Networking and purposive
sampling, Logistic Regression Model), Results and Analysis, Summary and Conclusion.
I. INTRODUCTION
Our knowledge, our attitudes and our action are based to a very large extent on samples. This
is equally true in everyday life and in scientific research. Survey researchers routinely
conduct studies that use different methods of data collection and inference. Over about the
last 60 years most have used a probability-sampling framework. More recently, concerns with
rising costs have led some to wonder whether non-probability sampling methods might be an
acceptable alternative, at least under some conditions. There is a wide range use of
non-probability designs that include case-control studies, clinical trials, evaluation research
design, intercept surveys, and opt-in panels, to name a few. Non-probability sampling has
become especially prevalent as more and more surveys have moved online.
Volume 7, Issue 17, 84-92. Research Article ISSN 2277– 7105
Article Received on 26 July 2018,
Revised on 16 August 2018, Accepted on 06 Sept. 2018
DOI: 10.20959/wjpr201817-13184
*Corresponding Author
Md. Shohel Rana
Assistant Professor,
Department of Statistics
Islamic University,
Drug addiction is not a recent problem in Bangladesh. But it has been rising. In recent years
Drug Addiction has significantly increased in Bangladesh. This agent of human devastation
has spread its tentacles worldwide and also in our country. Drug abuse directly influences the
economic and social aspects of a country. There are millions of drug-addicted people in
Bangladesh. These are generally youths and young men between 15-30 years of age and
come from all strata of the society. But there are young people below 15 years of age and
men and women over 30. And they are from all strata of the society. Some take drug as a
pursuit of pleaser and later on it turns into an addiction. The drugs are very expensive. To
predict the addicted people, Logistic regression analysis (LRA) is a popular and widely used
analysis. LRA extends the techniques of multiple regression analysis to research situations in
which the outcome variable is categorical. In practice, situations involving categorical
outcomes are quite common. This is a situation where the response variable has only two
possible outcomes, generally called “success” and “failure” and denoted by 1 and 0. Actually
the response is essentially qualitative or dichotomous (e.g., success/failure or yes/no or
died/lived).
2. METHODOLOGY
2.1 Introduction
In a survey the methodology for collecting information is of great importance. The reliability
of results of a survey depends on the appropriate study methodology. Sampling is important
component of methodology. A scientific and systematic design is mandatory to attain a valid
conclusion and fulfill its objective. This study was conducted in various steps that constitute
methodology all together.
2.2 Data Collection procedure
Here, we use primary data and the data for the study were collected by the direct interview
from different respondents by network sampling (for drug addicted student) and purposive
sampling technique works like chain referral.
2.4 Purposive Sampling
Purposive sampling is a non-probability sampling technique where we select units to be
sampled based on our knowledge and personal judgment. This type of sampling technique is
also known as Judgmental Sampling and Authoritative sampling.
Purposive sampling is used in cases where the specialty of an authority can select a more
representative sample that can bring more accurate results than by using other probability
sampling techniques.
The main objective of purposive sampling is to produce a sample that can be considered
„„representative‟‟ of the population.
2.5 Logistic Regression Model
Logistic regression analysis (LRA) is a popular and widely used analysis. LRA extends the
techniques of multiple regression analysis to research situations in which the outcome
variable is categorical. In practice, situations involving categorical outcomes are quite
common. This is a situation where the response variable has only two possible outcomes,
generally called “success” and “failure” and denoted by 1 and 0. Actually the response is
essentially qualitative or dichotomous (e.g., success/failure or yes/no or died/lived).
3. ANALYSIS AND RESULT
3.1 Introduction
Statistical analysis is a component of data analytics. Statistical analysis involves collecting
and scrutinizing every data sample in a set of items from which samples can be drawn.
3.2 Checking the Impact of the Running Year on Addiction:
From figure 4.4, it can say that the 4th year student are more drug addicted (about 20%) than
the student of other years.
3.3 Checking the Impact of Father’s Academic Qualification on addiction
From figure 4.8, it can say that the students whose father is SSC passed are more addicted
(about 16%) than others.
3.4 Descriptive Analysis of the Family Income (Monthly)
Table 4.4: Frequency table of the respondent’s family income (monthly).
Graphical Representation
From the above frequency table 4.4 and figure 4.13, it is observed that the maximum income
is 50000 taka and minimum income is 3000 taka. The average income is 18650 taka. The
maximum respondent‟s family income is 23000 taka.
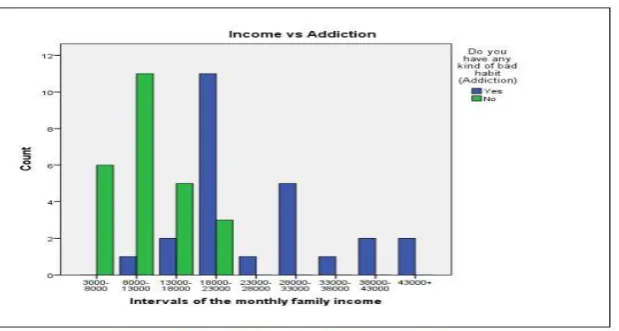
3.5 Checking the Impact of Family Income (Monthly) on Addiction
From figure 4.14, it is observed that the students at family income level (3000-8000) taka are
not drug addicted, at (18000-23000) taka large numbers of students are drug addicted and
very few are not drug addicted and income 23000 taka or more they are pure drug addicted
So it can say that, as income increase the number of drug addicted student‟s increases.
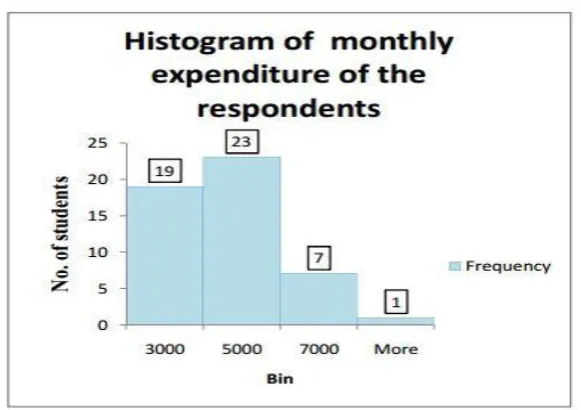
[image:6.595.153.444.314.519.2]3.6 Descriptive Analysis of the Respondent’s Expenditure (Monthly)
Table 4.5: Frequency table of the respondent’s expenditure (monthly).
Graphical Representation
From the frequency table 4.5 and figure 4.15, it is observed that the maximum expenditure is
8000 taka and minimum expenditure is 2000 taka. The average expenditure is 3940 taka. The
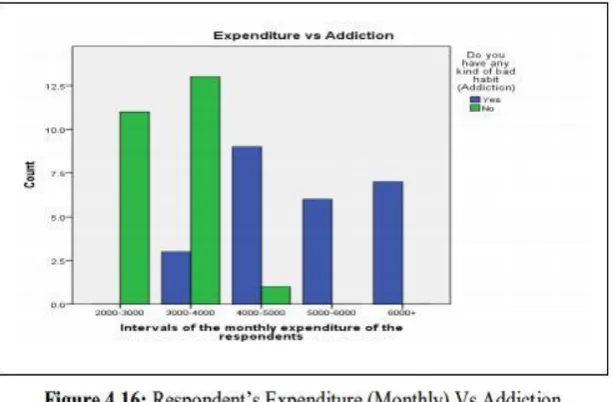
3.7 Checking the Impact of Respondent’s Expenditure (Monthly) on Addiction:
Graphical Representation
From figure 4.16, we see that the students whose expenditure at level (2000-3000) taka are
not drug addicted and as expenditure increases the number of drug addicted students
increases, that means students at higher expenditure are highly drug addicted.
3.8 Logistic Regression Model
To fit logistic regression model, we use addiction as response variable, monthly family
income and monthly respondent‟s expenditure as predictor variable. Since the response
variable is binary, it has two outcomes. So we code the two cases as 0 for non drug addicted
and 1 for drug addicted respondents.
Table 4.6: Estimated coefficients table.
Coefficient ˆi
Intercept -7.456
[image:7.595.146.453.115.316.2]Family income 0.071 Respondent expenditure 0.2936
Table 4.7: Odds ratio table.
Coefficient ˆ ˆ
i R
O e
Intercept 0.00000753
Family income 1.000388
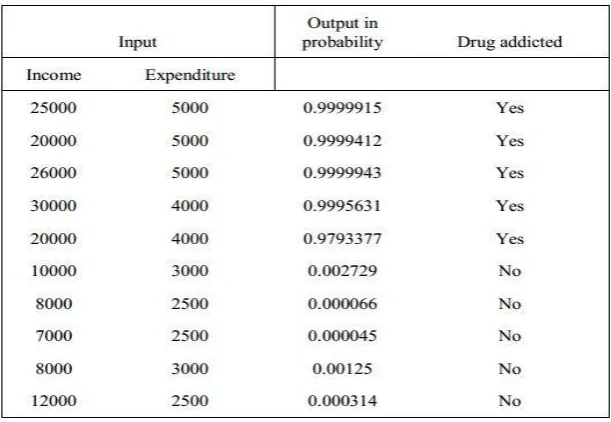
3.8.1 Prediction
Table 4.8: Prediction table based on family income and expenditure.
Table 4.8, showed that if I input the value of higher income and expenditure in the fitted
model, then the output value is approximately 1, which indicates the respondent is drug
addicted. And if I input the value of lower income and expenditure in the fitted model, then
the output value is approximately 0, which indicates the respondent is not drug addicted.
4. SUMMARY AND CONCLUSION
From this study, it is conclude that the 4th year students are more drugs addicted than the
student of other years. It is also observed that the academic qualification of most of the father
at S.S.C level and mother at primary level. Very few parents are graduate level. Most of the
respondent‟s family incomes are within 13000 to 23000 taka and own expenditure is in the
interval 3000 to 4000 taka. From this study it can also say that the students at rich family are
more drugs addicted than the poor family students. That means as income and expenditure
increases the number of drug addicted students increases. So drug addiction of the respondent
4. Sukhatme, P. V. and Sukhatme, B.V. (1977): Sampling Theories of Surveys with
Applications, ISAS, New Delhi.
5. Chudhury, A. and Stenger, H. (1992): Survey Sampling Theory and Methods, Chapman
and Hall Tayor and Francis Group, Yew York.
6. Mukhapadhyay, P. (1998): Theory and Methods of Survey Sampling, Prentice Hall, New
Delhi.
7. Henry, G. T., Practical sampling. Newbury Park, CA: Sage, 1990.
8. Kish, L., Survey sampling. New York: Wiley, 1965.
9. Islam, M.N., An introduction to sampling methods. Revised edition. Dhaka: Mullick &
brothers press, 2007.
10.Jonhnson, R. A. and Wichern, D. W. (2002): Applied Multivariate Statistical Analysis, 7th
edition, John Wiley, New York.
11.Agresti, A. (2002): Categorical Data Analysis, 2nd edition, John Wiley, New York.
12.Drug Addiction In Bangladesh: conveylive.com
http://conveylive.com/a/Drug_Addiction_In_Bangladesh
13.Battaglia, Michael p., Nonprobability sampling. Encyclopedia of Survey Research
Methods, 2008. SAGE Publications, 8 Nov.2011.
14.Mugera, W., Non-probability Sampling Techniques, University of Nairobi, April 2013.
15.AAPOR (American Association for Public Opinion Research). “Report of the AAPOR
task force on Non-probability Sampling.” May 2013.
https://www.aapor.org/AAPORKentico/AAPOR_Main/media/MainSiteFiles/NPS_TF_Re
port_Final_7_revised_FNL_6_22_13.pdf
16.Non-probability sampling, Statistics Canada, Date Modified: 2013-07-23.
http://www.statcan.gc.ca/edu/power-pouvoir/ch13/nonprob/5214898-eng.htm
17.Non-probability sampling, dissertation.laerd.com, (Accessed 4.17.2015)
http://dissertation.laerd.com/non-probability-sampling.php
18.Snowball-sampling, dissertation.laerd.com (Accessed 4.17.2015)
http://dissertation.laerd.com/snowball-sampling.php
19.Snowball-sampling, Explorable.com, (Accessed 5.03.2015)
https://explorable.com/snowball-sampling
20.Purposive-sampling, dissertation.laerd.com (Accessed 4.17.2015)
http://dissertation.laerd.com/purposive-sampling.php
21.Judgmental-sampling, Explorable.com, (Accessed 5.03.2015)