ISSN Print: 2333-9705
DOI: 10.4236/oalib.1105000 Nov. 26, 2018 1 Open Access Library Journal
Microarray Meta Analysis of BRCA1 Mutated
Genes Involved in Breast Cancer
Veerabhadrappa Kubsad Sukanya
1, Prashantha Nagaraja
2, Sumathra Manokaran
1,
Aall Hanumanthareddy Manjunatha Reddy
1*, Pallavi Surana
11Department of Biotechnology, RV College of Engineering, Bengaluru, India 2Scientific Biominds Ltd., Bengaluru, India
Abstract
Women with BRCA1 and BRCA2 gene mutations are at increased risk of breast cancer, compared with women who don’t carry the mutation in famili-al and somatic condition is remains chfamili-allenge. The aim of this work is to identify differentially expressed gene patterns related with BRCA1 and BRCA2 gene mutations that significantly expressed in breast cancer drug tar-gets. We have developed microarray meta-analysis to predict differential gene expression levels between hereditary BRCA1 mutations linked with sporadic breast cancer, using statistical methods to identify upregulated and downre-gulated genes to perform meta-analysis; further SVM classifier to identify gene ranks and their associated gene networks helps to classify gene profiles used for drug targets. We have predicted 2381 upregulated and 2057 down regulated genes that significantly (p-value < 0.01) associated with BRCA1 and BRCA2 related gene mutations. We also predicted that SVM classifiers showing 810 genes significantly associated with 4 different types of which 592 genes is helpful for protein expression that shows metastatic condition. Based on gene-gene interaction network prediction showing 30 genes is significantly associated with GO terms and many signaling pathways; we mainly use these genes for potential drug targets. Furthermore this result helps predict anti-cancer drug targets.
Subject Areas
BiotechnologyKeywords
Microarray, Breast Cancer, Drug Targets, Drug Discovery, Gene Signatures, Meta-Analysis, BRCA1, BRCA2
How to cite this paper: Sukanya, V.K., Nagaraja, P., Manokaran, S., Hanuman- thareddy, A. Reddy, M. and Surana, P. (2018) Microarray Meta Analysis of BRCA1 Mutated Genes Involved in Breast Cancer. Open Access Library Journal, 5: e5000.
https://doi.org/10.4236/oalib.1105000
Received: October 24, 2018 Accepted: November 23, 2018 Published: November 26, 2018 Copyright © 2018 by authors and Open Access Library Inc.
This work is licensed under the Creative Commons Attribution International License (CC BY 4.0).
DOI: 10.4236/oalib.1105000 2 Open Access Library Journal
1. Introduction
Cancer is a genetic disease that leads to uncontrolled cell proliferation. It is a multistep process arising from gene mutations involved in signaling, cell-cycle and/or cell-death pathways resulting in a mis-regulation of the pathways [1]. These mutations produce an oncogene with a dominant function, and/or tumor suppressor genes causing a loss of function. Either ways, the cell cycle is dis-rupted leading to uncontrolled cell division and growth—a common feature of every cancer type [2].
Breast cancer is a complex collection of diseases with characteristic clinical, histopathological, and molecular features [3]. Breast carcinogenesis involves ge-netic and epigege-netic alterations that cause aberrant gene function [4]. The com-mencement and development of breast cancer is caused due to the gathering of genetic mutations which lead to abnormal cell functions [5]. These genetic mu-tations can be inherited or irregular and may lead to the activation of oncogenes and block tumor suppressor genes [5]. It is also shown that breast cancer can be caused by epigenetic alterations, which do not affect the primary DNA sequence but cause abnormal transcriptional regulation that causes a change in gene ex-pression patterns involved in cellular proliferation, survival and differentiation [4]. Breast cancer is the most commonly occurring disease with around 1.38 mil-lion new breast cancer cases being diagnosed every year, globally [6]. It is also the most common cancer affecting women and stands second in causing cancer deaths among women [4] and fifth in cancer overall [6]. The survival of breast cancer patients is mainly associated with two factors—early detection of disease and adjuvant systemic treatment which includes chemotherapy and hormone therapy [3]. Treatments are largely dependent on clinic pathological conditions that include age, tumor size, histological grade, estrogen receptor (ER), proge-sterone receptor (PR), and HER2 status [3]. Although all patients with breast cancer are treated with chemotherapy, only a few patients will benefit from it [3]. Selecting an appropriate adjuvant therapy for breast cancer patients depends on reliable predictive markers [3].
The microarray-based gene expression profiling has had a tremendous devel-opment in the past decade [3]. The discovery of this technology has been consi-dered as a new dawn in cancer biology and oncology practice [3]. It has aided in the analysis of the multiple gene expression levels in a tumor sample [3]. With many gene expression profiling studies performed in the last decade, the datasets are available for analysis and meta-analysis [3]. Microarray-based gene expression profiling studies have helped in understanding the complexity of breast cancer which is not a simple disease but a collection of many genetic mutations [5].
DOI: 10.4236/oalib.1105000 3 Open Access Library Journal jieswill help in understanding the diagnosis, progress and development of per-sonalized therapies for breast cancer.
2. Material and Methods
In order to identify meta analysis of BRCA1, BRCA2, BRCA1/2 and normal genes involved in breast cancer of both familial, sporadic, familial cancer aggre-gation and normal cells that helps the role of gene expression in disease progres-sion can be analyzed using raw microarray data. We need to determine the dis-ease mechanism and the role of signaling pathways, 1) gene expression mea-surements 2) definitions of signaling pathways and 3) drug target identification.
2.1. Raw Data Selection
We searched public gene expression datasets from GEO microarray database to identify expression patterns neoadjusted chemotherapy patients were seriously affect gene expression patterns and profiles will identify used 3 different condi-tions. First 12 samples of breast cancer affected to women with hereditary BRCA1 gene mutation, 1 sample from BRCA2 gene mutation of hereditary women, 8 samples had BRCAx (BRACA1/2) type mutation of familial history of breast/ovarian cancer, 10 samples were sporadic disease, 4 samples are familial cancer aggregation (FCA) but without prevalence of breast/ovarian cancer and 6 normal breast samples. All the probesets is annotated with reference platforms of hgu133plus2 is used to compare the gene names to identify differentially ex-pressed genes.
2.2. Preprocessing of Raw Data
DOI: 10.4236/oalib.1105000 4 Open Access Library Journal
2.3. Differential Expression Analysis
The limma package of affymetrix data is used to identify differential expressed genes in breast cancer. The simplest dataset features replicated designs and progress through experiments with two or more groups, direct designs and fac-torial designs of different time course experiments. To assign column names of a set creates contrast matrix to perform all pairwise comparisons to compute es-timated coefficients and standard errors of a given datasets.
The differential expression of the genes was analyzed by experimental shrin-kage of the errors that leads arrive at a common value. This was attained by computing the t-statistics and log-odds of differential expression. It generates list of top 10 (“number = 10”) differentially expressed genes sorted by B-values (“sort.by = B”) for each of the three comparison groups (“coef = 1”) in this sam-ple set. The summary table has logFC is the log2-fold change, the AveExpr is the average of expression value across all arrays and channels, the moderated t-statistic (t) is the logFC to its standard error, the p value is the associated p-value, the adj. p value is the p-value adjusted for multiple testing and the B-value (B) is the log-odds that a gene is differentially expressed (the-higher-the-better). Usually one wants to base gene selection on the adjusted p-value rather than the t- or B-values. Filters out candidates that have p-values < 0.05 in each group (“coef = 1”) and provides the number of candidates for each list. These numbers should be identical with the sum of the values in each circle of the above Venn diagram. Same as above, but with complex filter: p-value < 0.01 AND at least 2-fold change AND expression value A > 10. This function plots, heat diagram gene expression profiles of genes which are significantly differentially expressed in the primary condition (this is not a cluster analysis heat map). Genes are sorted by differential expression under the primary condition. The argument “primary = 1” selects the first contrast column in the “results” matrix as a primary condition.
2.4. Meta Analysis and Classification
Using geNETClassifier algorithm to classify the genes was differentially ex-pressed in different disease datasets along with gene networks. The ge-nome-wide association studies of expression sets or expression matrix files of ranked genes, probe sets of different variables is optimized with training sets. Using multi-class SVM based classifier to quires genes chosen for classifica-tion; the mutual-information (interactions) and the co-expression (correlations) between the genes are also calculated and analyzed by the algorithm. These allow estimating the degree of association between the variables and they are used to generate a gene network for each class. These networks can be plotted, providing an integrated overview of the genes that characterized each disease (i.e. each class).
2.5. Functional Annotation and Enrichment Analysis
DOI: 10.4236/oalib.1105000 5 Open Access Library Journal information was carried out using the GO database. Using the Prolifer package, the cluster analysis was done and it comprehends on the genes within the mole-cular functions and biological processes. The over-represented biological func-tions and pathways of the differentially expressed genes were identified using DAVID (Database for Annotation, Visualization and Integrated Discovery) and GOrilla tools.
3. Results and Discussion
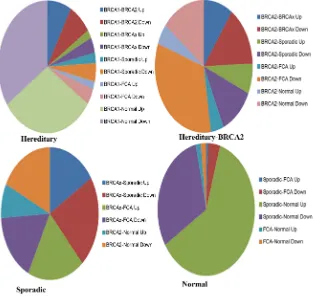
In the current study, we have predicted the analysis of breast cancer genes that is classified based on familial, sporadic, FAC and normal cell types. Using Meta analysis techniques to classify differential expression of genes involved in breast cancer of BRCA1, BRCA2 and BRCA1/2 mutations. There are different sets of genes while comparing the hereditary (BRCA1-BRCA2), BRCA1-BRCAx, BRCA1-sporadic, BRCA1-FCA, BRCA1-normal, BRCA2-BRCAx, BRCA2-spo- radic, BRCA2-FCA, BRCA2-normal, BRCAx-sporadic, BRCAx-FCA, BRCAx- normal, sporadic-FCA, sporadic-normal, FCA-normal sets to classify upregu-lated and downreguupregu-lated genes that functionally involved in breast cancer.
3.1. Differential Gene Expression Analysis
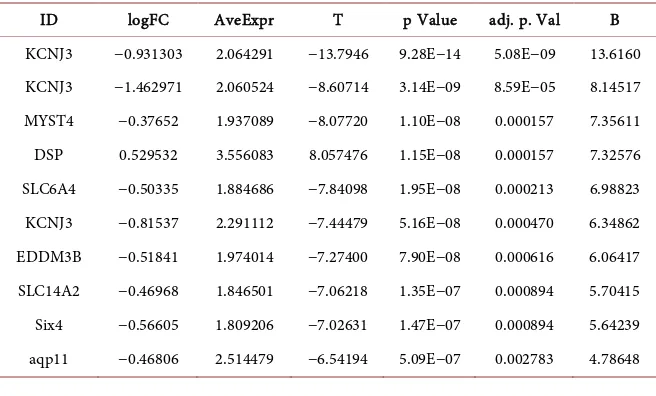
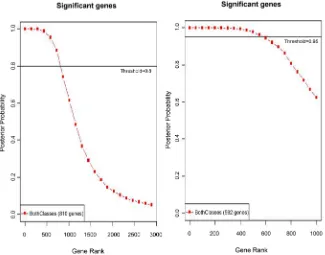
After normalization of raw data by calculating foreground and background in-tensities of color of all probe sets is used to predict differential gene expression. Using limma package to determine the differential gene expression based on significance prediction of p-value (<0.05). A total of 54,675 genes are signifi-cantly used for differential classification. A total of 592 genes are upregulated and 810 genes shows downregulated that differentially expressed in BRCA1 gene mutation of ER signaling pathways in breast cancer. Using hierarchical cluster-ing of 41 datasets uscluster-ing the 810 genes out of 54,675 genes with unique gene re-sulting in main branch, it is sub classified according to type of samples heredita-ry BRCA1, hereditaheredita-ry BRCA2, hereditaheredita-ry BRCAx, Sporadic, Sporadic FCA and Normal cell types by PAM50 classifier. The BRCA1 related most of the samples is cancers in ER cluster including BRCA1, BRCA2, BRCAx, FCA tumors of breast cancer (Figure 1 and Table 1).
3.2. Molecular Subtypes of BRCA1 Mutation Related Genes in
Breast Cancer
DOI: 10.4236/oalib.1105000 6 Open Access Library Journal
Figure 1. Differential gene expression of significant genes predicted based on p < 0.01.
Table 1. (a) Differential expression of BRCA1 gene mutation in ER cells of breast cancer; (b) Differential expression of BRCA2 gene mutation in ER cells of breast cancer; (c) Dif-ferential expression of BRCAx gene mutation in ER cells of Breast cancer; (d) DifDif-ferential expression of FCA and Normal cells in ER cells of breast cancer.
(a)
BRCA1-BRCA2 BRCA1-BRCAx BRCA1-Sporadic BRCA1-FCA BRCA1-Normal Up Down Up Down Up Down Up Down Up Down
86 82 22 40 27 48 20 42 331 369 (b)
BRCA2-BRCAx BRCA2-Sporadic BRCA2-FCA BRCA2-Normal Up Down Up Down Up Down Up Down 48 72 36 58 21 162 25 71
(c)
BRCAx-Sporadic BRCAx-FCA BRCA2-Normal Up Down Up Down Up Down
56 78 66 58 29 62 (d)
Sporadic-FCA Sporadic-Normal FCA-Normal Up Down Up Down Up Down
DOI: 10.4236/oalib.1105000 7 Open Access Library Journal enrichment analysis shows 19 genes is encodes for protein synthesis that signifi-cantly associated with transcriptional regulation control and cellular response of apoptosis. The overall list of genes is predicted in Table 2.
3.3. Differential Classification of BRCA2 Mutation Related Genes
in Breast Cancer
The differential classification of BRCA2 mutation in breast cancer showed 22 upregulated and 40 downregulated genes. This gene mutation was found in ER cells of breast cancer. These genes have the post-transcriptional regulation (Mir9-2) in multicellular organisms that affect the stability and translation of mRNAs. The calcium dependent was governed by the CDH2 receptor genes. The cell-cell adhesion of glycoprotein has the cadherin repeats of transmem-brane regions, which are highly conserved. All these genes are present in at the top of the data (Table 3).
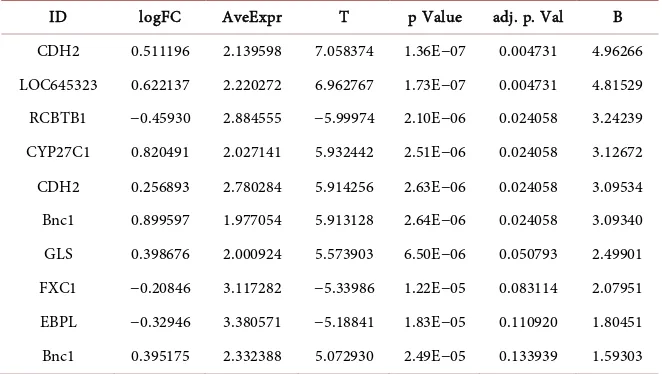
3.4. Differential Expression of BRCAx Samples in Breast Cancer
The BRCAx is compared with sporadic samples of breast cancer shows 27 upre-gulated and 48 down reupre-gulated genes. The 10 top reupre-gulated genes such as CDH2 is common regulator of cell-cell adhesion in transmembrane protein, LOC645323 gene has transcriptional regulation in putative alternative promoters of breast cancer genes, RCBTB1 is interacts with the ACE2A receptor that regulate B-cell(Table 4).
3.5. Differential Expression of Sporadic Gene Mutation Samples in
Breast Cancer
[image:7.595.210.538.535.733.2]In Sporadic gene mutation shows 18 upregulated genes and 98 down regulated genes that differentially expressed in sporadic genes. To evaluate the reproduci-bility of the expression patterns of the signatures shows LOC645323, CDH2, CYP27C1 RCBTB1 genes is significantly associated with transcriptional regulation
Table 2. Upregulated genes of BRCA1 genes predicted based on p < 0.01.
DOI: 10.4236/oalib.1105000 8 Open Access Library Journal
Table 3. Upregulated genes of BRCA2 genes predicted based on p < 0.01.
ID logFC AveExpr T p Value adj. p. Val B Mir9-2 0.6957603 2.220272 7.6294039 3.27E−08 0.0017874 5.68855 CDH2 0.4915699 2.139586 6.6502505 3.85E−07 0.0105239 4.22686 GLC 0.4155692 2.000924 5.6926966 4.74E−06 0.0863581 2.63784 Bnc1 0.7709860 2.027141 5.4618724 8.77E−06 0.1017289 2.23363 RCBTB1 −0.425034 2.884555 −5.439906 9.30E−06 0.1017289 2.19479 Bnc1 0.8099578 1.977054 5.2163559 1.69E−05 0.1543520 1.79598 NPL 0.1634098 2.141903 4.9712574 3.27E−05 0.2556709 1.35210 SHROOM2 −0.281433 3.023001 −4.912555 3.83E−05 0.2619858 1.24488 CDH2 0.2152811 2.780284 4.856113 4.46E−05 0.2710691 1.14149 FXC1 −0.191883 3.117282 −4.815805 4.97E−05 0.2719095 1.06749
Table 4. Upregulated genes of BRCAx genes predicted based on p < 0.01.
ID logFC AveExpr T p Value adj. p. Val B CDH2 0.511196 2.139598 7.058374 1.36E−07 0.004731 4.96266 LOC645323 0.622137 2.220272 6.962767 1.73E−07 0.004731 4.81529 RCBTB1 −0.45930 2.884555 −5.99974 2.10E−06 0.024058 3.24239 CYP27C1 0.820491 2.027141 5.932442 2.51E−06 0.024058 3.12672 CDH2 0.256893 2.780284 5.914256 2.63E−06 0.024058 3.09534 Bnc1 0.899597 1.977054 5.913128 2.64E−06 0.024058 3.09340 GLS 0.398676 2.000924 5.573903 6.50E−06 0.050793 2.49901 FXC1 −0.20846 3.117282 −5.33986 1.22E−05 0.083114 2.07951 EBPL −0.32946 3.380571 −5.18841 1.83E−05 0.110920 1.80451 Bnc1 0.395175 2.332388 5.072930 2.49E−05 0.133939 1.59303
within mutastatis. This revealed 18 Sporadic - 98 Sporadic basal-like tumors in the RCBTB1 data set. The performance of the signature was estimated by LOC645323, using the SVM algorithm (Table 5).
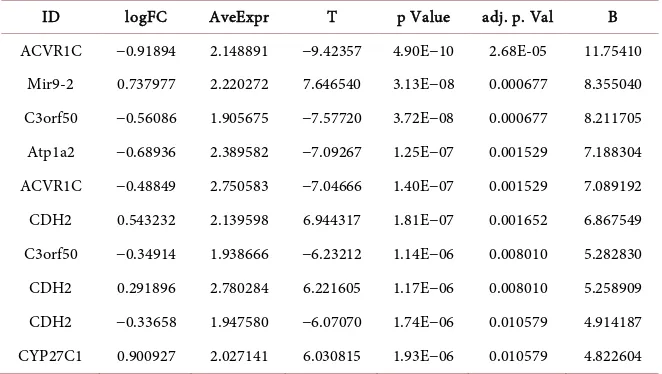
3.6. Differential Expression of FCA Normal Tissues
The FCA with normal dataset has 42 upregulated and 46 down regulated genes that significantly associated with Breast cancer (Table 6).
3.7. Functional Enrichment
[image:8.595.209.540.309.496.2]DOI: 10.4236/oalib.1105000 9 Open Access Library Journal
Table 5. Upregulated genes of sporadic genes predicted based on p < 0.01.
ID logFC AveExpr T p Value adj. p. Val B LOC645323 0.710737 2.220272 7.114588 1.18E−07 0.006443 4.437710
CDH2 0.549862 2.139598 6.790722 2.68E−07 0.007337 3.980876 CYP27C1 0.906285 2.027141 5.860969 3.03E−06 0.041897 2.569314 RCBTB1 −0.50127 2.884555 −5.85673 3.07E−06 0.041897 2.562568 GLS 0.436698 2.00092 5.460915 8.79E−06 0.096169 1.919413 Bnc1 0.874186 1.977054 5.13946 2.08E−05 0.189758 1.381185 CDH2 0.241086 2.780284 4.96437 3.33E−05 0.260447 1.082783 Tmem111 −0.27922 3.087107 −4.80371 5.14E−05 0.351129 0.806166 FAM134A −0.18538 3.28670 −4.74348 6.04E−05 0.366654 0.702488 IL23A 0.268365 2.347062 4.599524 8.90E−05 0.475319 0.451335
Table 6. Upregulated genes of FCA genes predicted based on p < 0.01.
ID logFC AveExpr T p Value adj. p. Val B ACVR1C −0.91894 2.148891 −9.42357 4.90E−10 2.68E-05 11.75410
Mir9-2 0.737977 2.220272 7.646540 3.13E−08 0.000677 8.355040 C3orf50 −0.56086 1.905675 −7.57720 3.72E−08 0.000677 8.211705 Atp1a2 −0.68936 2.389582 −7.09267 1.25E−07 0.001529 7.188304 ACVR1C −0.48849 2.750583 −7.04666 1.40E−07 0.001529 7.089192 CDH2 0.543232 2.139598 6.944317 1.81E−07 0.001652 6.867549 C3orf50 −0.34914 1.938666 −6.23212 1.14E−06 0.008010 5.282830 CDH2 0.291896 2.780284 6.221605 1.17E−06 0.008010 5.258909 CDH2 −0.33658 1.947580 −6.07070 1.74E−06 0.010579 4.914187 CYP27C1 0.900927 2.027141 6.030815 1.93E−06 0.010579 4.822604
Bnc1, RCBTB1, NPL and SHROOM2 gens traditionally done in functional enrichment analysis, one instead considers the overlap between the annotations made to a gene set and a branch of terms in the Gene Ontology. To accurately capture the significance of annotation overlap we develop a randomization scheme that preserves the transitive annotation features of the GO DAG while calculating the probability of obtaining a certain number of annotations between a gene set and a GO branch.
[image:9.595.209.540.309.496.2]se-DOI: 10.4236/oalib.1105000 10 Open Access Library Journal perted the genes which only expressed in breast cancer shows only 30 genes is most common expression in breast cancer and is potentially used as a biomark-ers. The most common genes such as GATA3, Foxa1, Tox3, Arg3, Arg2, Mmp12, Ptx3, AREG, SYNPO2, Scgb2a2, TFAP2B, Ptx3, Dach1, Vgll1, REEP6, MPP7, ANKRD30A, Igf2bp3, CYP4Z1, SLC6A4, FAM134A, DSP, PSPH, SDR16C5, AQP11, GLS, PSPH, TMC5 and SLITRK6 genes is mainly associated with transcriptional regulation (Figure 2 and Table 7).
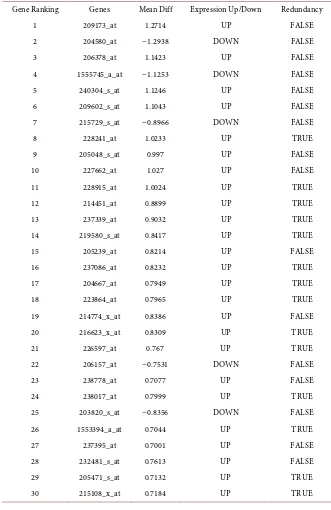
Table 7. Gene ranking of SVM classified gene signatures predicted using breast cancer data.
DOI: 10.4236/oalib.1105000 11 Open Access Library Journal
Figure 2. Significantly associated genes predicted based on SVM classifier of breast can-cer data.
3.9. Gene Network Prediction
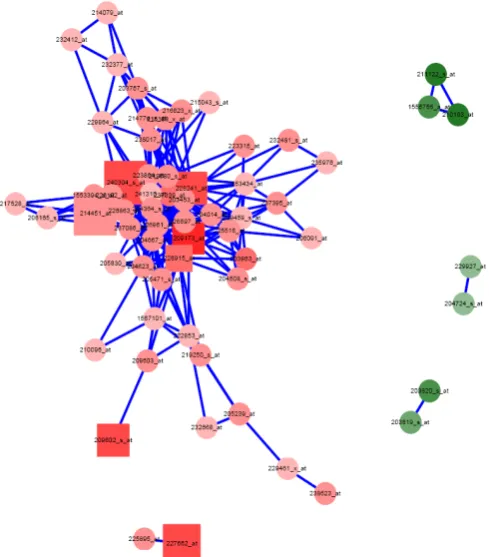
We used SVM method to construct network using geNETClassifier algorithm to identify informative gene pairs and assign weights to sample pairs. There are two parametes to combine optimal combinations such as accuracy of the k-model fold cross validation by varying threshold values from 0.11 to 0.8 in intervals of 0.01 and the another threshold value of 0.85 to 0.9 in intervals of 0.5. We have performed 26 different experiments that varying these two threshold values that measure the accuracy of gene network. There are 592 genes were involved in gene network that has significant association with 54 genes alone have optimal isolation. The overall gene network is predicted in Figure 3 and top 30 gene signatures that predicted based on SVM Classifiers were represented in Figure 4
(Table 8).
4. Conclusion
DOI: 10.4236/oalib.1105000 12 Open Access Library Journal
Figure 3. Gene-gene network predicted based on classifiers of breast cancer significant genes used for drug targets.
[image:12.595.252.497.422.701.2]DOI: 10.4236/oalib.1105000 13 Open Access Library Journal
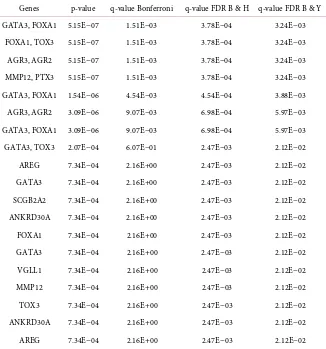
Table 8. Top genes that significantly associated with breast cancer.
Genes p-value q-value Bonferroni q-value FDR B & H q-value FDR B & Y GATA3, FOXA1 5.15E−07 1.51E−03 3.78E−04 3.24E−03
FOXA1, TOX3 5.15E−07 1.51E−03 3.78E−04 3.24E−03 AGR3, AGR2 5.15E−07 1.51E−03 3.78E−04 3.24E−03 MMP12, PTX3 5.15E−07 1.51E−03 3.78E−04 3.24E−03 GATA3, FOXA1 1.54E−06 4.54E−03 4.54E−04 3.88E−03 AGR3, AGR2 3.09E−06 9.07E−03 6.98E−04 5.97E−03 GATA3, FOXA1 3.09E−06 9.07E−03 6.98E−04 5.97E−03 GATA3, TOX3 2.07E−04 6.07E−01 2.47E−03 2.12E−02 AREG 7.34E−04 2.16E+00 2.47E−03 2.12E−02 GATA3 7.34E−04 2.16E+00 2.47E−03 2.12E−02 SCGB2A2 7.34E−04 2.16E+00 2.47E−03 2.12E−02 ANKRD30A 7.34E−04 2.16E+00 2.47E−03 2.12E−02 FOXA1 7.34E−04 2.16E+00 2.47E−03 2.12E−02 GATA3 7.34E−04 2.16E+00 2.47E−03 2.12E−02 VGLL1 7.34E−04 2.16E+00 2.47E−03 2.12E−02 MMP12 7.34E−04 2.16E+00 2.47E−03 2.12E−02 TOX3 7.34E−04 2.16E+00 2.47E−03 2.12E−02 ANKRD30A 7.34E−04 2.16E+00 2.47E−03 2.12E−02 AREG 7.34E−04 2.16E+00 2.47E−03 2.12E−02
pathways of all 6 types of datasets and these genes are mainly used for potential drug targets. Furthermore this result helps to identify metastatic signature which could facilitate further research in metastasis, such as outcome prediction, drug discovery, and other functional studies.
Acknowledgements
The authors would like to express thanks to Dr. VidyaNiranjan, Prof and Head Department of Biotechnology, RV College of Engineering, Dr. Subramanya K.N. Principal, RV College of Engineering and the Faculty at Scientific Biominds Ltd., Bengaluru.
Conflicts of Interest
There is no conflict of interest.References
[1] Brumby, A.M. and Richardson HE. (2005) Using Drosophila melanogaster to Map Human Cancer Pathways. Nature Reviews Cancer, 5, 626-639.
DOI: 10.4236/oalib.1105000 14 Open Access Library Journal
[2] Sandal, T. (2002) Molecular Aspects of the Mammalian Cell Cycle and Cancer. The Oncologist, 7, 73-81. https://doi.org/10.1634/theoncologist.7-1-73
[3] Colombo, P.E., Milanezi, F., Weigelt, B. and Reis-Filho, J.S. (2011) Microarrays in the 2010s: The Contribution of Microarray-Based Gene Expression Profiling to Breast Cancer Classification, Prognostication and Prediction. Breast Cancer Re-search,13, 212. https://doi.org/10.1186/bcr2890
[4] Lo, P.K. and Sukumar, S. (2008) Epigenomics and Breast Cancer. Pharmacogenom-ics, 9, 1879-1902. https://doi.org/10.2217/14622416.9.12.1879
[5] Connolly, R. and Stearns, V. (2012) Epigenetics as a Therapeutic Target in Breast Cancer. Journal of Mammary Gland Biology and Neoplasia, 17, 191-204.
https://doi.org/10.1007/s10911-012-9263-3