Structural Evolution of Polyacrylonitrile Fibers in
Stabilization and Carbonization
Sungho Lee1*, Jihoon Kim1, Bon-Cheol Ku1, Junkyung Kim2, Han-Ik Joh1 1Institute of Advanced Composite Materials,Korea Institute of Science and Technology,
Jeollabuk-do, Korea (South)
2Korea Institute of Science and Technology, Seoul, Korea (South)
Email: *[email protected]
Received January 26, 2012; revised February 25, 2012; accepted March 31,2012
ABSTRACT
The effect of structural evolution polyacrylonitrile (PAN) on mechanical properties was investigated in stabilization and carbonization. PAN spun fibers were stabilized in a convection oven with a constant tension for various times at 250˚C. Fourier Transform Infrared spectroscopy (FTIR) and gel fraction results suggested that intra and intermolecular stabili- zation reactions occurred simultaneously. X-ray diffractograms revealed a disruption of crystalline structure and an ap- pearance of pre-graphitic structure of PAN fibers due to stabilization. These structural changes by stabilization resulted in the significant decrease of tensile properties of fibers. In Raman spectra with heat treated fibers from 400˚C up to 1200˚C, the intensity ratio of the D to G bands (ID/IG) decreased as heat treatment temperature increased, indicating an
increase of basal plane of graphitic layer of heat treated fibers. Tensile strength of heat treated fibers at 1200˚C was found to be as high as 2.2 GPa.
Keywords: Polyacrylonitrile; Stabilization; Carbonization; XRD; Tensile Properties; Carbon Fibers
1. Introduction
Carbon fibers are manufactured from three precursor materials such as rayon polyacrylonitrile (PAN), and mesophase pitch. Rayon was the first precursors for commercialized carbon fibers (CF) [1,2]. Due to low productivity of rayon-based CF, PAN and mesophase pitch have been more preferred. However, mesophase pitch-based CFs are inferior to PAN-based CF in tensile strength [1]. Furthermore, the difficulty of mesophase pitch synthesis with a high average molecular weight with no or small side groups required for melt spinning process is another drawback. Therefore, PAN has been most widely used materials for carbon fiber precursors for more than thirty years. Approximately 90% of CFs produced in the world is PAN-based CF [1,3].
To produce PAN-based CFs, three stages are required: wet spinning, stabilization, and carbonization. Stabiliza- tion of PAN is performed by heating from 200˚C to 300˚C in air under tension, leading to cyclization, dehy- drogenation, and oxidation. PAN molecules are cyclized to transform into a non-meltable ladder structure, which is critical to avoid melting during carbonization [4]. It is known that nitrile groups in PAN are initiated thermally through a free radical mechanism, leading to cyclized
network of hexagonal carbon-nitrogen rings [5]. Further, the nitrile groups in PAN with a large dipole provide high cohesive energy density and chain stiffness, which result in excellent tensile strength [6]. Commercially, PAN precursors are polymerized with acidic comono- mers such as acrylic acid, methacrylic acid, and itaconic acid [5]. Stabilization is one of the most important factors to determine mechanical strength of PAN based carbon fibers. Fitzer et al. reported optimization of stabi- lization of PAN fibers and effect of carbonization of resulting fibers on tensile strength [4]. Even though stabilization of PAN fibers has been studied for more than thirty tears, the exact mechanism and the structure of stabilized PAN fiber are unknown.
In this study, a systematic study on the stabilization and carbonization of PAN fibers was reported to investi- gate the change of structure and properties. PAN fibers were wet spun and stabilized for various duration times. Evolution of the extent of stabilization was observed using Fourier Transform Infrared spectroscopy (FT-IR). Thermal behavior of the stabilized PAN fibers was observed by differential scanning calorimetry (DSC) and thermogravimetry (TGA). To investigate structure, X-ray diffraction was used. Furthermore, structural change of fibers during carbonization was observed using X-ray diffraction and Raman spectroscopy. Tensile test of the
stabilized and carbonized fibers were performed.
2. Experimental
Commercial PAN was obtained from Sigma-Aldrich. Molecular weight was found to be ~100,000 g/mol by HLC8320GPC (TOSOH, Japan). A lab scale spinning line was developed [7]. A spinneret with one hundred fifty holes was mounted for wet spinning at 20˚C. A diameter of each hole was 0.1 mm. A wet spinning line had four baths: one coagulation bath and three washing baths. The coagulation bath contained DMSO/distillated water (=5:5) mixture at 20˚C, and three washing baths were operated with distillated boiling water. After spinning, fibers were dried in a convection oven for 2 days at 60˚C.
Stabilization of fibers was performed in a convection oven at 250˚C for various duration times (5 - 180 min). A constant tension was applied to fiber tows during stabi- lization. Gel fractions of the stabilized fibers were mea- sured after equilibrium swelling (7 days) in dimethyl sul- phoxide (DMSO) solvent (Aldrich Chemical Company, Inc. Milwaukee, WI). Mixtures were filtered to remove DMSO. Then, the remaining gels were dried in vacuum oven at 50˚C for 7 days. Gel fraction was obtained using the mass ratio of the remainings to original fibers. Heat treatment of stabilized fibers under nitrogen atmosphere was performed using a tubular furnace (Korea Furnace Development Co. Ltd., Korea). After fiber loading, the temperature increased to a set point of 400˚C - 1200˚C at a rate of 5˚C/min, and fibers were cooled down without hold.
Fourier Transform Infrared spectroscopy (FTIR) spe- ctra were obtained using a Nicolet iS10 FTIR spectro- meter (Thermo Scientific, USA) in a range of 400 - 4000 cm−1 with an Attenuated Total Reflectance (ATR) mode.
Stabilized fibers were heated up to 500˚C in an air or nitrogen atmosphere at a rate of 10˚C/min for studying the effect of stabilization time on thermal behaviors using a differential scanning calorimetry (DSC) Q20 (TA Instrument, USA). Thermogravimetric analysis (TGA) was performed in a nitrogen atmosphere with a rate of 20˚C/min using a TGA Q50 (TA Instrument, USA). X-ray diffractometer (XRD, Rigaku D/Max2500H, Japan) of Cu Kα radiation (λ = 1.5406 Å) was used over the 2θ range of 10˚ to 50˚ to observe structural change during stabilization and heat treatment. Raman spectroscopy was performed using LabRAM HR system (Horiba Jobin Yvon, France) with 16 mW and 633 nm laser for heat treated fibers. All the spectra were obtained over a spec- tral range of 500 - 3000 cm−1.
For tensile testing, a single fiber was loaded to a paper tab with a 25 mm gauge length. An epoxy resin was applied to both ends of fibers, and cured for 24 hr at 50˚C.
Fiber diameters were measured by an optical microscope (Olympus BX51, Japan). The tensile properties were determined using an Instron Universal Tester 5567 (Instron, USA) at 25˚C. The crosshead speed was 5 mm/min for all specimens, and twenty replicates were tested at each condition.
3. Results and Discussion
[image:2.595.338.508.565.697.2]3.1. FTIR Analysis of Stabilized PAN Fibers
Figure 1 shows FTIR spectra of PAN fibers before and after stabilization in a convection oven at 250˚C with various times. Before stabilization, distinct absorption bands appeared at 2939, 2243, 1454, and 1360 cm−1 as-
signed to νC-H in CH2, νC≡N in CN, δC-H in CH2, and δC-H
in CH, respectively (Figure 1(a)). A band at 1071 cm−1
resulted from S=O groups of DMSO solvent, which were remained after spinning [8]. There was no significant change with stabilized fibers for 5 and 10 min (Figures 1(b) and (c)). Stabilized fibers for 30 min showed an appearance at 1595 cm−1 assigned to conjugated C=N
stretching with a little intensity (Figure 1(d)). With sta- bilized fibers for 60 min, a band at 1595 cm−1 became
bigger, but intensities of bands at 2939, 2243, and 1454 cm−1 decreased, resulting from the cyclization and dehy-
drogenation of fibers (Figure 1(e)). For 120 min, two shoulders appeared at 1710 and 1660 cm−1 (Figure 1(f)).
Shimada and Takahagi reported that these shoulders are assigned to the free ketones in hydronaphthyridine rings and the conjugated ketones in acridone rings, re- sulting from the oxygen uptake reaction [9,10]. Further- more, a new small band at 2200 cm−1 was observed with
stabilized fibers. It is reported that the band is assigned to
the α,β-unsaturated nitrile groups due to hydrogenation,
or tautomerization and isomerisation of the ladder poly- mer [11,12]. In Figure 1(g), it is interesting that the band and shoulder at 2243 and 1454 cm−1, respectively, are
distinct. This reveals that all PAN are not cyclized even after stabilization for 180 min at 250˚C.
4000 3500 3000 2500 2000 1500 1000
T
rans
mittanc
e (%)
Wavenumber (cm-1) (g) 180 min
(f) 120 min
(e) 60 min (d) 30 min (c) 10 min
(b) 5 min
(a) pure
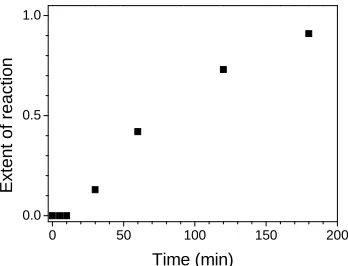
The degree of stabilization or extent of reaction (EOR), which ranges from 0 to 1 for no stabilization to complete stabilization, was quantified using the intensity of the peak at 1595 and 2243 cm−1 assigned to C=N and C≡N,
respectively, in FTIR spectra [EOR = I1595/(I1595 + I2243)]
[13]. As expected, the longer stabilization time led to the higher EOR value in Figure 2. 0 to 0.91 with stabilized fibers for 5 to 180 min.
Gel fraction test of Pure PAN and its stabilized fibers was performed. As expected, pure PAN fibers were dis- solved in DMSO and gel was not observed. However, gel contents of stabilized fibers for 5 and 10 min were 50 and 100%. Furthermore, stabilized fibers for more than 10 min did not dissolved in DMSO for 7 days. Gupta and Harrison studied stabilization of co-polymer PAN as temperature increased up to 380˚C with a heating rate of 1˚C/min, and claimed intramolecular cyclization and in- termolecular cross-linking reactions took place in amor- phous and crystalline regions at a different temperature range [14]. According to their report, intramolecular cy- clization reactions started in amorphous and crystalline region at 175˚C and ~215˚C. As temperature increased, intermolecular cross-linking reactions initiated in amor- phous and crystalline region at ~300˚C.
Stabilized fibers for 10 min developed yellow from white of pure PAN fibers, which indicates that fibers were not stabilized enough. Furthermore, it is interesting to note that FTIR results showed no significant change of spectra with stabilized fibers for 10 min, compared to pure PAN fibers. In our stabilization temperature (250˚C), it is likely that intermolecular cross-linking reactions happened even though intramolecular cyclization was not completed. This suggests that intra and intermolecular stabilization reactions occurred simultaneously.
3.2. Thermal Behavior of Stabilized PAN Fibers The stabilization of PAN fibers was investigated using non-isothermal DSC analysis. The first heating thermo- grams at a rate of 10˚C/min in N2 atmosphere are dis-
0 50 100
0.0 0.5 1.0
150 200
Extent o
f reaction
[image:3.595.335.505.352.481.2]Time (min)
Figure 2. Extent of reaction (EOR = I1595/(I1595 + I2243)) as a function of stabilization time at 250˚C.
played in Figure 3. The cyclization temperature (Tc) and
(ΔHc) were summarized in Table 1. The PAN fibers be-
fore stabilization showed one cyclization peak at 294.6˚C. An onset temperature was 280.6˚C, and the curves com- pleted at 307.4˚C (Figure 3(a)). It is known that com- pared to itaconic acid modified PAN, which can have two separated peaks due to ionic and free radical mecha- nism, pure PAN fiber is cyclized only by a free radical mechanism, revealing one peak [15]. The similar peaks were observed with stabilized fibers for 5 and 10 min. However, the peak with stabilized fibers for 30 min was shifted to higher temperature (307˚C). Compared to un- stabilized fibers, the heat of reaction decreased from 520 J/g to 474 J/g, which indicates that PAN molecules were stabilized for 30 min in a convection oven. As stabilized time goes longer, the peak was broader with a higher cyclization temperature. Furthermore, heat of the cycli- zation became smaller in Figure 3(g), and it is evident that the stabilization for 180 min led to a significant de- gree of cyclization, which is consistent with FTIR results. It should be noted that the DSC thermograms in Figure
50 100 150 200 250 300 350 400 450 500
Heat flow
(W/g
)
Temperature (oC)
(g) 180 min
(f) 120 min
(e) 60 min
(d) 30 min
(c) 10 min
(b) 5 min
[image:3.595.86.260.572.705.2](a) pure
Figure 3. Non-isothermal DSC thermograms (nitrogen at- mosphere) of (a) PAN fiber and its stabilized fibers at 250˚C for: (b) 5 min; (c) 10 min; (d) 30 min; (e) 60 min; (f) 120 min; and (g) 180 min.
Table 1. The cyclization temperatures (Tc) and heats of cy- clization (ΔHc) measured by DSC in nitrogen and air for PAN fiber and its stabilized fibers for various time at 250˚C.
Stabilization
time (min) Tc (˚C) in N2 ΔHc (J/g) in N2 Tc (˚C) in air
0 294.6 520 321.7
5 295.2 518 320.4
10 295.6 520 319.9
30 307.4 474 319.6
60 313.1 423 318.9
120 327.7 328 -
[image:3.595.309.537.593.734.2]3 were obtained in N2 atmosphere, which indicates that
only heat initiated all exothermic reactions without oxy- gen. Hence, an oxidative reaction took place in a convec- tion oven results in decrease of heat of the cyclization in the DSC thermograms. Furthermore, the partially cy- clized PAN fibers revealed a higher cyclization tempera- ture than did pure PAN fibers, suggesting that more thermal energy is needed for cyclization of the rest of unreacted PAN fibers.
The non-isothermal DSC analysis was also performed in an air atmosphere in Figure 4. Heat of the cyclization (ΔHc) was not calculated since we could not suggest an
accurate method to make a base line practically due to the shape of the DSC thermograms, rendering a strong intensity difference in both sides of curves. Figure 4(a)
represents the thermogram of pure PAN fibers before stabilization with one peak at 321.7˚C. It is interesting to note that the peak is at higher temperature compared to the DSC thermograms in nitrogen atmospheres (294.6˚C in Figure 3(a)). The curve after peak was not back to an original base line, which was not observed with the thermograms in nitrogen (Figure 3(a)). Similar thermo- grams were reported in an air atmosphere, but there was no clear explanation [4]. We believed that heat capacity difference between PAN fibers and corresponding oxi- dized PAN fibers resulted in heat flow difference in DSC thermograms. Stabilized fibers for 5, 10 and 30 min in
Figures 4(b), (c) and (d), respectively, showed a peak at 320.4˚C, 318.9˚C, and 319.9˚C with a similar intensity. The peak became smaller with 60 min of stabilization time. As stabilization time increased, even the peak dis- appeared (Figures 4(f) and (g)).
Figure 5 represents TGA analysis of PAN and its sta- bilized fibers with a ramp of 20˚C/min in N2 atmosphere
before and after stabilization. PAN fibers before stabili- zation showed four stages of weight change (Figure 5(a)). In the first stage up to 295˚C, there was no weight loss. However, ~35% of weight loss from 295˚C to 325˚C was
50 100 150 200 250 300 350 400 450 500
C)
100 200 300 400 500 600 700
30 40 50 60 70 80 90 100
H
eat flow
(W/g)
Temperature (o
(g) 180 min
(f) 120 min
(e) 60 min
(d) 30 min
(c) 10 min
(b) 5 min
(a) pure
(g) 180 min
(f) 120 min (e) 60 min
(d) 30 min
(c) 10 min (b) 5 min
Weig
ht %
Temperature (oC)
(a) pure
Figure 4. Non-isothermal DSC thermograms (air atmos- phere) of (a) PAN fiber and its stabilized fibers at 250˚C for: (b) 5 min; (c) 10 min; (d) 30 min; (e) 60 min; (f) 120 min; and (g) 180 min.
Figure 5. TGA thermograms (nitrogen atmosphere) of (a) PAN fiber and its stabilized fibers at 250˚C for: (b) 5 min; (c) 10 min; (d) 30 min; (e) 60 min; (f) 120 min; and (g) 180 min.
observed in the second stage, indicating that a significant chemical reaction took place, and volatile gases came out [16]. It is recalled that cyclization peak temperature was at 294.6˚C in a DSC thermogram (Figure 3(a)). A fur- ther decrease of weight (65% to 40%) was found from 325˚C to 480˚C in the third stage. In the last stage up to 700˚C, a monotonous decrease of weight was observed with a total weight loss of ~63%.
Compared to pure PAN fiber, a small decrease of weight in the second stage was observed with stabilized fibers for 5 and 10 min (Figure 5(b) and (c)). Stabilized PAN fibers for 30 min showed a higher on-set tempera- ture of sudden decrease and a lower weight loss (Figure 5(c)). A weight decrease started at 312˚C, and ~33% of weight loss was found at 340˚C. Cyclization peak tem- perature of stabilized fibers for 30 min was observed at 307.4˚C in a DSC thermogram (Figure 3(c)). Further- more, there was not a significant weight change observed with stabilized fibers from 325˚C to 700˚C, leading to three stages. A further weight loss of ~15% was com- pleted at 700˚C. Similar curves stabilized fibers for 60 and 120 min were observed with a total weight loss of ~33% and ~38%, respectively (Figures 5(e) and (f)). As stabilization time increased, it is likely that there are two stages with a decreased total weight loss as expected. PAN fiber stabilized for 180 min showed ~28% of weight loss at 700˚C (Figure 5(g)). This indicated that a little amount of PAN was remained for the further reac- tion after stabilization at a low temperature region.
3.3. X-Ray Diffraction Analysis of Stabilized PAN Fibers
40 50
10 20 30
20 30
(g)
(f)
(g) 180 min (f) 120 min (e) 60 min (d) 30 min (c) 10 min (b) 5 min (a) pure
Int
ensit
y (
a.u.
)
2(o)
0 50 100 150 200
0.0 0.2 0.4 0.6
for PAN and its stabilized fibers. As stabilization time increased, a change of tensile modulus was not sig- nificant: 13.5 and 12.4 GPa for PAN and stabilized fibers for 180 min, respectively.
It is recalled that FTIR spectra of stabilized fibers for 120 min showed the significant degree of cyclization (EOR = 0.73 in Figure 2). Furthermore, X-ray diffra- tograms showed the structural change of PAN fibers. It is likely that mechanical properties of stabilized fibers such as tensile strength were determined by structure. It is suggested that the ladder structure of stabilized fibers resulted in less tensile strength compared to pure PAN fibers due to disruption of orientation and crystalline structure by thermal stabilization. Strain-to-failure of PAN fibers in Figure 7(c) was found to be 11%, but fi- bers stabilized for 5 min showed strain-to-failure of 18% due to relaxation of PAN fibers during stabilization even though a constant tension was applied. Stabilized fiber for 30 min showed the value of 14%. Up to stabilization time of 180 min, strain-to-failure decreased down to 7%. This is consistent to the result by Gupta and Harrison [18]. They reported that a decrease of strain-to-failure was attributed to intermolecular cross-linking reactions to lead to a network formation.
Figure 6. The integrated azimuthal profiles (2 scans) of (a) PAN fiber and its stabilized fibers at 250˚C for: (b) 5 min; (c) 10 min; (d) 30 min; (e) 60 min; (f) 120 min; and (g) 180 min. The inset profiles are the enlarged 2 scans for (f) and (g).
was found. For stabilized fibers for 120 min, an intensity of two peaks became low, indicating the disruption of orientation and crystalline structure by thermal stabili- zation. Furthermore, a peak at 2θ of ~25.6˚ appeared. This peak is more distinct with stabilized fibers for 180 min, which showed a very small peak at 2θ of ~17˚ and disappearance of the peak at 2θ of ~29.3˚. Mathur et al. reported that a broad peak at 2θ = 25.5˚ appeared with prolonged stabilization, associated with the (002) planes of the pre-graphitic structure [17]. Therefore, it is evident in Figure 6(g) that an original PAN structure changed by stabilization.
3.5. Heat Treatment of Stabilized PAN Fibers Stabilized fibers for 180 min were heat treated at various temperatures from 400 up to 1200˚C. The integrated azi- muthal profiles (2 scans) of heat treated fibers are dis- played in Figure 8. The peak associated with (100) plane of pure PAN at 2θ of ~17˚ disappeared with all heat treated fibers (Figure 6). Furthermore, a peak at 2θ of ~25.6˚ with stabilized fibers was shifted to 2θ of ~25.2˚ for heat treated fibers at 400˚C. This peak associated with (002) plane was not significantly changed with heat treated fibers at higher temperature up to 1200˚C. In Fig- ure 8(g), X-ray diffractogram of PAN based commercial carbon fibers (T-300, Toracaya Co., Ltd. Japan) showed a peak at 2θ of ~25.2˚, indicating that our heat treated fibers are similar to turbostratic carbon structure of T-300 3.4. Tensile Properties of Stabilized PAN Fibers
Figure 7 displays tensile properties of PAN and its stabilized fibers. Tensile strength of PAN fibers without stabilization was ~0.5 GPa (Figure 7(a)). Stabilized PAN fibers for up to 30 min showed no significant change of tensile strength. A further increase of stabilization time led to a monotonous decrease of tensile strength, and tensile strength of ~0.23 GPa was observed with stabilized PAN fibers for 120 min. No further decrease was found. In Figure 7(b), tensile moduli were shown
0 50 100 150 200
0 5 10 15 20
0 50 100 150 200
0 5 10 15 20
(b)
Y
o
un
g'
s
m
o
dul
u
s
(G
P
a
)
Time (min)
(a)
Tens
ile s
tr
eng
th
(G
P
a
)
Time (min)
(c)
Str
a
in
-to
-f
a
ilu
re (%)
Time (min)
(a) (b) (c)
Figure 7. Tensile properties of PAN fiber and its stabilized fibers: (a) Tensile strength; (b) Tensile modulus; and (c) Strain- o-failure as a function of stabilization time.
fibers [19]. Figure 9 represents Raman spectra of heat treated fiber and T-300 carbon fibers. A weak shoulder at ~1190 cm−1 and two peaks at ~1340 cm−1 and ~1580
cm−1 were observed for all fibers. A broad peak around
1150 - 1200 cm−1 is associated with functional groups
such as C=O [20]. Thus, a shoulder at ~1200 cm−1
ob-served for all fibers can be inferred as functional groups obtained during stabilization. For carbon fibers, the D and G band at 1360 cm−1 and 1600 cm−1 are attributed to
structural disorder within graphite planes and the graph-itic crystalline structure, respectively [21]. Furthermore, a broad peak around 1500 - 1550 cm−1 was observed with
heat treated fibers and T-300 carbon fibers, indicating high contents of amorphous carbon [21]. From Raman spectra, the intensity ratio of the D to G bands (ID/IG) was
calculated to be 2.17, 1.98, 1.72, 1.64, 1.43, and 1.48 for heat treated fibers at 400, 600, 800, 1000, 1200˚C, and T-300 fibers, respectively. The value decreased as heat treatment temperature increased, indicating an increase of basal plane of graphitic layers in heat treated fibers. It is evident that even though turbostratic structure is dominant with amorphous carbon in our fibers, the heat treatment led to the development of graphene layers.
Tensile test was performed for heat treated fibers to investigate the effect of heat treatment on mechanical properties of stabilized fibers. In Figure 10(a), tensile strength and modulus with fibers heat treated at 400˚C were found to be 308 ± 33 MPa and 17 ± 3 GPa, respectively. A gradual increase of tensile strength and modulus was observed as temperature increased up to 800˚C (Figures 10(a) and (b)). However, the values were significantly increased with heat treatment at 1000˚C, and tensile strength and modulus with fibers heat treated at 1200˚C were found to be 2219 ± 228 MPa and 215 ± 36 GPa, respectively. As expected, tensile strain de- creased from 4.9% to 0.9% for heat treated fibers at 400 and 1200˚C, respectively (Figure 10(c)). Fitzer et al. observed volatile gases produced during heat treatment [4]. HCN was dominant at below 700˚C with other gases such as CO2, CO, and H2O. Furthermore, N2 was a main
volatile byproduct at above 700˚C. They reported that
[image:6.595.337.504.232.354.2]such a gas release was a subsequent effect of heat treat- ment to develop graphitic structure. Tensile strength in
Figure 10 is consistent with their results so that a significant increase was observed with fibers heat treated at above 1000˚C. This supports the development of graphene layers observed in Raman spectra. It is recalled that the peak of (002) plane in X-ray diffratograms did not change as heat treatment temperature increased. This suggests that temperature up to 1200˚C is not high enough to result in reducing the interlayer spacing (d002)
significantly. However, tensile strength of the resulting
10 20 30 40 50
2(O)
Intensity (a.u.)
(f) T-300
(e) 1200o
C (d) 1000o
C (c) 800o
C (b) 600o
C (a) 400oC
˚
500 1000 1500 2000 2500 3000
Figure 8. The integrated azimuthal profiles (2 scans) of heat treated fibers at (a) 400˚C; (b) 600˚C; (c) 800˚C; (d) 1000˚C; (e) 1200˚C; and (f) T-300 carbon fibers.
(f) T-300
(e) 1200oC
(d) 1000o
C
(c) 800o
C
(b) 600oC
Inte
n
s
ity (a
.u
.)
Raman shift (cm-1)
(a) 400o
C
400 600 800 1000 1200
[image:6.595.338.502.412.538.2]0 1 2 3
Figure 9. Raman spectra of heat treated fibers at (a) 400˚C; (b) 600˚C; (c) 800˚C; (d) 1000˚C; (e) 1200˚C; and (f) T-300 carbon fibers.
Temperature (oC)
T
ens
ile s
tr
ength (
G
Pa) (a)
400 600 800 1000 1200 0
100 200 300
400 600 800 1000 1200
0 2 4 6
Temperature (oC)
S
tra
in
(%
)
(c)
Temperature (o C)
T
e
ns
ile
m
o
d
u
lu
s
(
G
P
a
) (b)
(a) (b) (c)
[image:6.595.72.529.589.710.2]carbon fibers was as high as 2.2 GPa.
4. Conclusion
Polyacrylonitrile (PAN) fibers were spun using the lab scale wet spinning line. Fibers were stabilized in a con- vection oven with a constant tension for various times at 250˚C. FT-IR spectra of stabilized fibers indicated cycli- zation of PAN fibers to form a network structure. FTIR and gel fraction results suggested that intra and intermo- lecular stabilization reactions occurred simultaneously. As expected, the longer stabilization time led to the higher extent of reaction (EOR) value: 0 to 0.91 with stabilized fibers for 5 to 180 min. Non-isothermal DSC analysis of PAN and its stabilized fibers in nitrogen ex- hibited evolution of cyclization as a function of stabiliza- tion time. A longer stabilization time led to a smaller heat of cyclization and broader thermograms. TGA analysis of PAN fibers showed a dramatic decrease of weight from 295˚C to 325˚C, where the cyclization peak was found in DSC thermograms. This indicated that volatile gases came out due to a strong exothermic reaction. However, such a decrease was not observed with stabi- lized fibers for 120 and 180 min at 250˚C since a little amount of PAN was remained for the reaction. X-ray diffractograms revealed a disruption of crystalline struc- ture and an appearance of pre-graphitic structure of PAN fibers at 2θ of ~25.6˚ due to stabilization. It was sug- gested that structural change by stabilization resulted in the significant decrease of tensile properties of fibers. From X-ray diffractograms of heat treated fibers, the pre-graphitic structure of stabilized fibers was developed to turbostratic structure. Furthermore, heat treatment up to 1200˚C led to an increase of the integrated intensity ratio of the D to G bands, indicating the development of graphene layers. Tensile strength of fibers heat treated at 1200˚C was found to be as high as 2.2 GPa.
5. Acknowledgements
This work was supported by a grant from Korea Institute of Science and Technology Institutional program and the Fundamental R&D Program for Core Technology of Materials funded by the Ministry of Knowledge Eco- nomy, Republic of Korea.
REFERENCES
[1] J. D. Buckley and D. D. Edie, “Carbon-Carbon Materials and Composites,” NASA Reference Publication 1254, 1992.
[2] M. K. Seo, S. H. Park, S. H. Kang and S. J. Park, “Carbon Fibers (III): Recent Technical and Patent Trends,” Car-bon Letters, Vol. 10, No. 1, 2009, pp. 43-51.
[3] A. Koganemaru, Y. Bin, Y. Agari and M. Matsuo,
“Com-posites of Polyacrylonitrile and Multiwalled Carbon Nanotubes Prepared by Gelation/Crystallization from Solution,” Advanced Functional Materials, Vol. 14, No. 9, 2004, pp. 842-850. doi:10.1002/adfm.200305034
[4] E. Fitzer, W. Frohs and M. Heine, “Optimization of Sta-bilization and Carbonization Treatment of PAN Fibers and Structural Characterization of the Resulting Carbon Fibers,” Carbon, Vol. 24, No. 4, 1986, pp. 387-395. doi:10.1016/0008-6223(86)90257-5
[5] J. Kim, Y. C. Kim, W. Ahn and C. Y. Kim, “Reaction Mechanisms of Polyacrylonitrile on Thermal Treatment,” Polymer Engineering & Science, Vol. 33, No. 22, 1993, pp. 1452-1457. doi:10.1002/pen.760332203
[6] A. Yamane, D. Sawai, T. Kaneda, T. Kanemoto, M. Ito and R. S. Porter, “Development of High Ductility and Tensile Properties upon Two-Stage Draw of Ultrahigh Molecular Weight Poly(Acrylonitrile),” Macromolecules, Vol. 30, No. 14, 1997, pp. 4170-4178.
doi:10.1021/ma9614095
[7] S. Lee, J. Kim, B. C. Ku, J. Kim and Y. Chung, “Effect of Process Condition on Tensile Properties of Carbon Fi-ber,” Carbon Letters, Vol. 12, No. 1, 2011, pp. 26-30. doi:10.5714/CL.2011.12.1.026
[8] Q. Ouyang, L. Cheng, H. Wang and K. Li, “Mechanism and Kinetics of the Stabilization Reactions of Itaconic Acid-Modified Polyacrylonitrile,” Polymer Degradation and Stability, Vol. 93, No. 8, 2008, pp. 1415-1421. doi:10.1016/j.polymdegradstab.2008.05.021
[9] I. Shimada and T. Takahagi, “FT-IR Study of the Stabili-zation Reactions of Polyacrylonitrile in the Production of Carbon Fibers,” Journal of Polymer Science Part A: Polymer Chemistry, Vol. 24, No. 8, 1986, pp. 1989-1995. [10] T. Takahagi, I. Shimada, M. Fukuhara, K. Morita and A.
Ishitani, “XPS Studies on the Chemical Structure of the Stabilized Polyacrylonitrile Fiber in the Carbon Fiber Production Process,” Journal of Polymer Science Part A: Polymer Chemistry, Vol. 24, No. 11, 1986, pp. 3101- 3107.
[11] S. Dalton, F. Heatley and P. M. Budd, “Thermal Stabili-zation of Polyacrylonitrile Fiber,” Polymer, Vol. 40, No. 20, 1999, pp. 5531-5543.
doi:10.1016/S0032-3861(98)00778-2
[12] T. J. Xue, M. A. McKinney and C. A. Wilkie, “The Thermal Degradation of Polyacrylonitrile,” Polymer De- gradation and Stability, Vol. 58, No. 1-2, 1997, pp. 193-202. doi:10.1016/S0141-3910(97)00048-7
[13] Y. Zhu, M. A. Wilding and S. K. Mukhopadhyay, “Esti-mation, using Infrared Spectroscopy, of the Cyclization of Poly(Acrylonitrile) during the Stabilization Stage of Car-bon Fibre Production,” Journal of Materials Science, Vol. 31, No. 14, 1996, pp. 3831-3837.
doi:10.1007/BF00352799
[14] A. Gupta and I. R. Harrison, “New Aspects in the Oxida-tive Stabilization of PAN-Based Carbon Fibers,” Carbon, Vol. 34, No. 11, 1996, pp. 1427-1445.
doi:10.1016/S0008-6223(96)00094-2
2001, pp. 1707-1718.
doi:10.1016/S0032-3861(00)00583-8
[16] N. Chatterjee, S. Basu, K. Palit and M. M. Maiti, “XRD Characterization of the Thermal Degradation of Poly-acrylonitrile,” Journal of Polymer Science Part B: Poly-mer Physics, Vol. 33, No. 12, 1995, pp. 1705-1712. [17] R. B. Mathur, O. P. Bahl, J. Mittal and K. C. Nagpal,
“Structure of Thermally Stabilized PAN Fibers,” Carbon, Vol. 29, No. 7, 1991, pp. 1059-1061.
doi:10.1016/0008-6223(91)90189-P
[18] A. Gupta and I. R. Harrison, “New Aspects in the Oxida-tive Stabilization of PAN-Based Carbon Fibers II,” Car-bon, Vol. 35, No. 6, 1997, pp. 809-818.
doi:10.1016/S0008-6223(97)00025-0
[19] D. Li, H. Wang and X. Wang, “Effect of Microstructure on the Modulus of PAN-Based Carbon Fibers during
High Temperature Treatment and Hot Stretching Graph-itization,” Journal of Materials Science, Vol. 42, No. 12, 2007, pp. 4642-4649. doi:10.1007/s10853-006-0519-4 [20] N. Keller, N. I. Maksimova, V. V. Roddatis, M. Schur, G.
Mestl, Y. V. Butenko, V. L. Kuznetsov and R. Schlogl, “The Catalytic Use of Onion-Like Carbon Materials for Styrene Synthesis by Oxidative Dehydrogenation of Ethyl-benzene,” Angewandte Chemie International Edition, Vol. 41, No. 11, 2002, pp. 1885-1888.
doi:10.1002/1521-3773(20020603)41:11<1885::AID-AN IE1885>3.0.CO;2-5