CONCEPTUAL EXPLANATION TO STUDY THE DEVELOPMENT OF SURFACE ROUGHNESS
OF FRP COMPOSITE PILES DURING DRIVING PROCESS
Lecturer, College of
ARTICLE INFO ABSTRACT
The surface roughness of FRP composite piles may be significantly altered during the driving process. This change could affect the interface pile design parameters. Therefore, an accurate quantification of this change is required to precisely determine the
of an experimental study that investigated the change in surface roughness and interface shear coefficient of two different FRP counterface surfaces that sheared against two different types of sand under increased normal stress levels. The test results indicated that quantifiable surface roughness and interface resistance changes could be induced by the interface shearing process under increased normal stress levels. A conceptual explanation is provid
behaviour. In conclusion, the outcomes of this study demonstrate the importance of considering the shear induced wear of FRP materials during the driving installation process.
Copyright © 2015 Hussein A. Shaia. This is an open access article distributed under the Creative Commons Att distribution, and reproduction in any medium, provided the original work is properly cited.
INTRODUCTION
During the last two decades fiber reinforced polymer (FRP) tube were used to overcome the negative effects of the aggressive environmental conditions on the conventional pile materials such as steel, concrete, and timber (Iskander and Hassan 2001). As FRP-soil interface shear behaviour controls the pile’s shaft resistance, some studies have investigated FRP granular interface shear resistance (Pando et al
Han 1999, Sakr et al. 2005). These studies have concluded that the interface shear behaviour is controlled by the engineering properties of granular and counterface continuum materials, and the applied normal stress level. The engineering properties of the granular materials include particle shape and grading (D50, mean particle size), and relative density whereas the
engineering properties of the counterface continuum materials include surface roughness, and hardness, HV. Uesugi and Kishida (1986) proposed a normalized roughness parameter, Rn=Rmax/D50, that was able to express successfully
influence of surface roughness of counterface continuum material on the interface friction coefficient,
Rmax is the absolute vertical distance between the highest and
lowest valley along the surface profile over a sample length equal to D50 (Uesugi and Kishida 1986), and
friction angle of the granular material. In fact, FRP composite piles are usually installed by driving method (Sakr
Therefore, during the installation process, FRP pile’s shaft will be subjected to interface shear process under different normal stress levels which is function of the driving depth as shown in Fig. 1. The coefficient of the interface friction is dependent on
Corresponding author: Hussein A. Shaia, Lecturer, College of Engineering, University of Thi
ISSN: 0975-833X
Vol.
Article History:
Received 24th February, 2015
Received in revised form 09th March, 2015
Accepted 15th April, 2015
Published online 25th May,2015
Key words:
FRP Pile, Surface roughness, Interface friction, Direct shear test.
RESEARCH ARTICLE
CONCEPTUAL EXPLANATION TO STUDY THE DEVELOPMENT OF SURFACE ROUGHNESS
OF FRP COMPOSITE PILES DURING DRIVING PROCESS
*Hussein A. Shaia
Lecturer, College of Engineering, University of Thi-Qar/ Iraq
ABSTRACT
The surface roughness of FRP composite piles may be significantly altered during the driving process. This change could affect the interface pile design parameters. Therefore, an accurate quantification of this change is required to precisely determine the pile shaft resistance. This letter presents the results of an experimental study that investigated the change in surface roughness and interface shear coefficient of two different FRP counterface surfaces that sheared against two different types of sand nder increased normal stress levels. The test results indicated that quantifiable surface roughness and interface resistance changes could be induced by the interface shearing process under increased normal stress levels. A conceptual explanation is provided in this study to interpret the observed behaviour. In conclusion, the outcomes of this study demonstrate the importance of considering the shear induced wear of FRP materials during the driving installation process.
is an open access article distributed under the Creative Commons Attribution License, which distribution, and reproduction in any medium, provided the original work is properly cited.
During the last two decades fiber reinforced polymer (FRP) tube were used to overcome the negative effects of the aggressive environmental conditions on the conventional pile materials such as steel, concrete, and timber (Iskander and soil interface shear behaviour controls the pile’s shaft resistance, some studies have investigated
FRP-et al. 2002, Frost and
. 2005). These studies have concluded that aviour is controlled by the engineering properties of granular and counterface continuum materials, and the applied normal stress level. The engineering properties of the granular materials include particle shape and grading relative density whereas the engineering properties of the counterface continuum materials include surface roughness, and hardness, HV. Uesugi and Kishida (1986) proposed a normalized roughness parameter, , that was able to express successfully the influence of surface roughness of counterface continuum material on the interface friction coefficient, =tan (), where is the absolute vertical distance between the highest and lowest valley along the surface profile over a sample length (Uesugi and Kishida 1986), and is the interface In fact, FRP composite usually installed by driving method (Sakr et al., 2005). Therefore, during the installation process, FRP pile’s shaft will be subjected to interface shear process under different normal stress levels which is function of the driving depth as shown in 1. The coefficient of the interface friction is dependent on
Lecturer, College of Engineering, University of Thi-Qar/ Iraq.
the sliding and ploughing resistances where their contributions are mainly function of the normal stress and the hardness of the counterface surface. Sliding will tend to dominate for a hard counterface material whereas ploughing gets activated beyond a critical normal stress for a softer counterface (Dove and Forst 1999). As the FRP material has a moderate surface hardness compared to steel, it is expected that ploughing mechanism could take place during FRP composite pile driving process. Ploughing includes severe plastic deformation that damages the counterface surface asperities as the
and displace material from the surface during translation. Furthermore, ploughing is often accompanied with development of microcracks in the counterface. Therefore, the surface roughness of FRP materials may be significantly altered during installation process. Evaluation of this change in the surface roughness is required to achieving an accurate interface pile design.
Few studies have been directed to quantify the interface shear induced surface roughness change and its effec
interface shear coefficient. Zettler
that the surface roughness of geomembranes is increased when sheared against granular medium. They attributed the observed change in geomembrane surface roughness to particles ploughing effects under shearing process. Fuggle
investigated the change in the surface roughness of different types of infrastructure pipe as a result of an interface shearing process against granular materials. In general they concluded that the surface roughness of FRP pipe materials did not change under the shearing process. This result could be attributed to the low normal stress (50 kPa) that has been used by Fuggle et al. (2006) which could be less than the critical normal stress value that is required to activate the ploughing
International Journal of Current Research
Vol. 7, Issue, 05, pp.15610-15614, May, 2015
CONCEPTUAL EXPLANATION TO STUDY THE DEVELOPMENT OF SURFACE ROUGHNESS
OF FRP COMPOSITE PILES DURING DRIVING PROCESS
Qar/ Iraq
The surface roughness of FRP composite piles may be significantly altered during the driving process. This change could affect the interface pile design parameters. Therefore, an accurate quantification of pile shaft resistance. This letter presents the results of an experimental study that investigated the change in surface roughness and interface shear coefficient of two different FRP counterface surfaces that sheared against two different types of sand nder increased normal stress levels. The test results indicated that quantifiable surface roughness and interface resistance changes could be induced by the interface shearing process under increased ed in this study to interpret the observed behaviour. In conclusion, the outcomes of this study demonstrate the importance of considering the shear induced wear of FRP materials during the driving installation process.
ribution License, which permits unrestricted use,
the sliding and ploughing resistances where their contributions the normal stress and the hardness of the counterface surface. Sliding will tend to dominate for a hard counterface material whereas ploughing gets activated beyond a critical normal stress for a softer counterface (Dove and Forst ial has a moderate surface hardness compared to steel, it is expected that ploughing mechanism could take place during FRP composite pile driving process. Ploughing includes severe plastic deformation that damages the counterface surface asperities as the granular particles remove and displace material from the surface during translation. Furthermore, ploughing is often accompanied with development of microcracks in the counterface. Therefore, the surface roughness of FRP materials may be significantly red during installation process. Evaluation of this change in the surface roughness is required to achieving an accurate
Few studies have been directed to quantify the interface shear induced surface roughness change and its effect on the interface shear coefficient. Zettler et al. (2000) has observed that the surface roughness of geomembranes is increased when sheared against granular medium. They attributed the observed change in geomembrane surface roughness to particles ploughing effects under shearing process. Fuggle et al. (2006) investigated the change in the surface roughness of different types of infrastructure pipe as a result of an interface shearing process against granular materials. In general they concluded that the surface roughness of FRP pipe materials did not ge under the shearing process. This result could be attributed to the low normal stress (50 kPa) that has been used . (2006) which could be less than the critical normal stress value that is required to activate the ploughing
process (Dove and Forst 1999). Based on the above discussion, there is still need to investigate the behaviour of the interface shear induced FRP surface roughness and interface shear coefficient changes under increased normal stress levels. The main objective of this study is to address this point through an experimental investigation. In the following sections, the testing materials and the conducted experimental program will be presented. Then, the obtained results will be discussed and interpreted, and finally the conclusions of this study will be drawn.
Testing materials and experimental program
Glass Fiber Reinforced Polymer (GFRP), and Carbon Fiber Reinforced Polymer (CFRP) are selected as testing materials in this study. The Vickers Hardness, HV, of GFRP and CFRP is 65 and 49, respectively. The GFRP and CFRP average maximum roughness, Rmax, were determined using a stylus
[image:2.595.45.280.313.571.2]profilometer (Uesugi and Kishida1986). Two different granular materials were used in this study as listed in Tables 1.
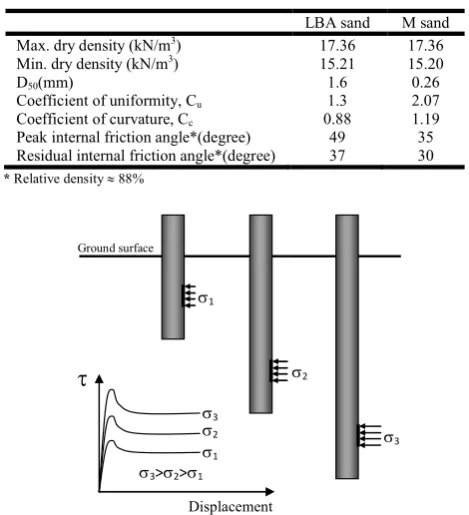
Table 1. Geotechnical properties of the testing granular materials
LBA sand M sand Max. dry density (kN/m3) 17.36 17.36
Min. dry density (kN/m3) 15.21 15.20
D50(mm) 1.6 0.26
Coefficient of uniformity, Cu 1.3 2.07
Coefficient of curvature, Cc 0.88 1.19
Peak internal friction angle*(degree) 49 35 Residual internal friction angle*(degree) 37 30
* Relative density 88%
To simulate the pile driving conditions in terms of the normal stress change as the driving depth increases, as shown in Fig. 1, the proposed testing approach in this study involves subjecting the FRP counterface testing specimen to consecutive interface shearing tests under increased normal stress levels (27.7, 55.5, 97.3, and 183.5 kPa). The surface roughness of FRP counterface testing specimen, in terms of Rmax, was measured
after shearing under each normal stress level. Modified direct shear apparatus was used for this purpose. The top part of shear box comprises a square box (60 mm x 60 mm) and height of 24 mm. The bottom part of the shear box comprises a sheet of the counterface continuum material glued to a rigid plywood base which is longer than the top part of shear box so the shear area
remains constant during a test. The testing granular materials were prepared at 88% relative density using air pluviation technique. The tests were performed at horizontal displacement rate of 0.52 mm/min. Finally, it should be mentioned that the setup of the testing in this study investigate the small shear displacement behaviour. However, field cases could involve tens of meters of displacement.
RESULTS AND DISCUSSION
Shear induced surface roughness changes
A cumulative relative roughness change, ΔRmax, is used to
quantify the surface roughness change. It is defined as follows:
where (Rmax)i and (Rmax)f are the initial Rmax as received from
the manufacture, and Rmax after the completion of the interface
shear test under each normal stress level, respectively (Abuel-Naga and Shaia, 2014). The test results in Fig. 2 suggest that
∆ / can be considered as normal stress level independent. Furthermore, ∆ / is function of surface hardness, HV, and the normalized roughness parameter Rn=Rmax/D50 (Uesugi and Kishida1986). It increases as HV
[image:2.595.326.543.367.540.2]increases and decreases as Rn increases.
Fig. 2. Evolution of surface roughness as the normal stress increases
The test results in Fig. 2 shows that GFRP (HV=65) shows a low abrasion resistance higher ( ∆ / ) compared to CFRP (HV=49). According to Caceres (2002), the wear behaviour of the materials is related to competitive processes of delamination, micro-ploughing and micro-cracking. The former is present in highly ductile material and it is accompanied by fatigue striations. Micro-cracking and micro-ploughing, which could increase the surface roughness, are present in harder material. As GFRP is harder than CFRP in terms of HV value, GFRP is expected to have a higher ∆ / .
The effect of Rn on ∆ / can be explained in terms of
D50 of the granular material. As D50 increases (Rn decreases),
the number and area of particles contacting the counterface surface decreases causing the actual contact stress per particle
R² = 0.9917
R² = 0.9887 R² = 0.9788
R² = 0.963
0 10 20 30 40 50
0 50 100 150 200 250
Δ
Rma
x
(%)
n (kPa)
GFRP-LBA; HV=65; Rn=0.025
GFRP-M; HV=65; Rn=0.116
CFRP-LBA; HV=49; Rn=0.014
CFRP-M; HV=49; Rn=0.076
Fig. 1. Evolution of normal and shear stress at a specific area element on the pile shaft during the driving process
1
2
3
Displacement
3
2
1
3>2>1
Fig. 3. Evolution of the peak interface shear coefficient as the normal stress increases
to increase. In fact, the possibility of damaging the counterface surface by micro-cracking and ploughing processes increases as contact stress per particle increases (Dove and Forst 1999). Therefore, LBA sand (D50=1.60 mm) is expected to induce
more surface roughness changes than M sand (D50=0.26 mm).
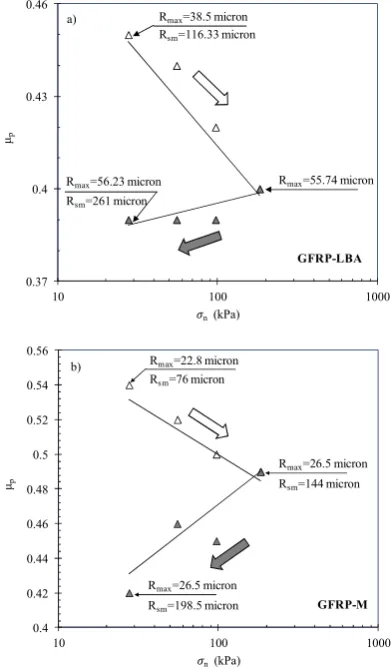
Development of the interface shear coefficient
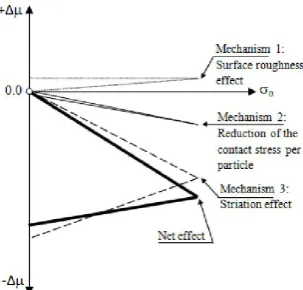
The results in Fig. 3 illustrate that the peak interface shear coefficient, p, decreases as the normal stress increases, and / can be considered as Rn independent. This behaviour
could be explained in terms of the following three mechanisms: (1) interface shear induced surface roughness increase as shown in Fig. 2; (2) change of the contact area per particle as the normal stress increases (Dove and Frost 1999); (3) interface shear induced striations in the counterface continuum surface (Renard et al., 2012).
According to Uesugi and Kishida (1986), increases as the surface roughness increases. As the surface roughness increases under the interface shearing process, as shown in Fig. 2, is expected to increase as the normal stress increases. However, as the results in Fig. 3 show an opposite behaviour, it can be concluded that the interface shear induced surface roughness increase cannot be invoked on its own to explain the observed / in Fig. 3.
For elastic polymer surfaces, Dove and Frost (1999) explained the observed decrease of as the normal stress increases in
terms of the contact area per particle that increases as normal force increases but at a rate lower than the applied normal stress causing reduction of both of the contact stress per particle and . According to the experimental results in Fig. 3, it can be expected that the second mechanism should have a predominant role over the first mechanism.
Fig. 4. Evolution of the peak interface shear coefficient under
loading/unloading normal stress path
As the second mechanism has an elastic nature and the first mechanism should increase , it was expected that values obtained from unloading normal stress path should be greater than the obtained values under the loading normal stress path. The interface shear friction coefficient measurements under loading/unloading cycle in terms of the applied normal stress are shown in Fig. 4 for GFRP-LBA and GFRP-M. The results in Fig. 4 show that values under the unloading path are lower than the irreversible trend. This result indicates that the above two mechanisms are not enough to explain the observed behaviour in Fig. 4. The concept of interface shear induced striations is similar to the mechanism of scratching a surface with an indenter (Bowden and Tabor, 1966; Gee, 2001; Flores et al. 2008). As the interface shear process between continuum surface and granular material involves movement of particles along the counterface surface, irreversible micro-cracks and ploughing in form of striations (long thin groove) parallel to the shearing direction can be created in the counterface surface as shown in Fig. 5 (Renard et al., 2012). Therefore, the counterface surface is expected to have irreversible longitudinal passes after completing the interface
y = -0.027ln(x) + 0.5435 y = -0.027ln(x) + 0.6292
0.3 0.4 0.5 0.6
10 100 1000
μp
n(kPa)
GFRP-LBA(Rn=0.025) GFRP-M (Rn=0.116)
a)
y = -0.042ln(x) + 0.5044 y = -0.04ln(x) + 0.5848
0.2 0.3 0.4 0.5
10 100 1000
μp
n(kPa)
CFRP-LBA(Rn=0.014) CFRP-M(Rn=0.076)
b)
0.37 0.4 0.43 0.46
10 100 1000
μp
n(kPa)
Rmax=38.5 micron
Rmax=56.23 micron
Rsm=116.33 micron
Rmax=55.74 micron
Rsm=261 micron
GFRP-LBA a)
0.4 0.42 0.44 0.46 0.48 0.5 0.52 0.54 0.56
10 100 1000
μp
n(kPa)
Rmax=22.8 micron
Rmax=26.5 micron
Rsm=198.5 micron
Rsm=76 micron
Rmax=26.5 micron
Rsm=144 micron
[image:3.595.336.532.136.471.2]Fig. 5 Interface shear induced striation
Fig. 6. Schematic conceptual explanation for the effect of the different proposed mechanisms on the change of the interface
shear coefficient as the normal stress increases.
shear test under a lower normal stress. So, when the same counterface surface is sheared under the next higher normal stress, these passes will be used by the granular particles as preferential translating passes along the counterface surface. Consequently less particle translating resistance is expected. Therefore, the interface shear coefficient will decrease.
The spacing surface profile parameter, Rsm, measured in a
direction perpendicular to the shearing direction can be used to quantify the interface shear induced striations as shown in Fig. 5. The parameter Rsm expresses the average spacing between
two crossing points on the midline that includes high and low peaks as shown in Fig. 5 (Gadelmawla et al., 2002). The development of striations can be noticed by monitoring the change in Rsm value. The results in Fig. 4 show the Rsm value
increases significantly (more than double) after subjecting the GFRP to loading/unloading interface shear path. Furthermore, the results in Fig. 4 also show that Rmax does not change under
the unloading path.
Based on the above discussion, the change of interface shear coefficient, Δp, under increased normal stress levels can be
schematically conceptualized as shown in Fig. 6 where the first and the third mechanism are irreversible whereas the second mechanism is reversible. However, the third mechanism should have a predominant role over the first and the second mechanisms in order to get a net Δ change similar to the observed behaviour in Fig.4.
Conclusion
Experimental tests were carried out in this study quantify the interface shear induced surface roughness changes under increased normal stress levels for FRP materials. The test results show that the rate of surface roughness change is function of the counterface surface hardness, HV, and the normalized roughness parameter Rn. The test results also
indicate that the peak interface shear coefficient decreases as the normal stress increases. This behaviour could be explained in terms of the interface shear induced surface roughness increase, the change of the contact area per particle as the normal stress increases, and the interface shear induced striations in the counterface continuum surface. However, it is concluded that the later is the most predominant factor. In conclusion, the outcomes of this study demonstrate the importance of considering the shear induced wear of FRP materials during the driving process.
REFERENCES
Bowden, F. P. and Tabor, D. 1966. Friction, lubrication, and wear: a survey of work during the last decade. British
Journal of Applied Physics 17, 1521-1544.
Caceres, P. G. 2002. Effect of microstructure on the abrasive wear properties of infiltrated tungsten alloys. Materials
Characterization 49,1 – 9
Dove, J. E. and Frost, J. D. 1999. Peak friction behavior of smooth geomembrane particle interfaces. Journal of
Geotechnical and Geoenvironmental Engineering ASCE
125, No. 7, 544-555.
Frost, J. D. and Han, J. 1999. Behavior of interfaces between fiber‐reinforced polymers and sands. Journal of Geotechnical and Geoenvironmental Engineering ASCE
125, No. 8, 633–640.
Fuggle, A., Frost, J. D. and Iscimen, M. 2006. Quantification of Shear Induced Wear on Curved Surfaces. Proceedings of
Geo-Institute Congress – Geotechnical Eng. in the Information Technology Age, Atlanta, CD-ROM.
Flores, S. E., Pontin, M. G. and Zok, F. W. 2008. Scratching of elastic/plastic materials with hard spherical indenters.
Journal of Applied Mechanics ASME 75, No. 6, 061021.
Gee, M. G. 2001. Low load multiple scratch tests of ceramics and hard metals. Wear 250, No. (1-12), 264-281.
Gadelmawla, E. S., Koura, M. M., Maksoud, T. M. A., Elewa, I. M. and Soliman, H. H. 2002. Roughness parameters.
Journal of Materials Processing Technology 123, No. 1,
133-145.
Iskander, M. G. |and Hassan, M. 2001. Accelerated degradation of recycled plastic piling in aggressive soils. Journal of
Composites for Construction 5, No. 3, 179-187.
Pando, M. A., Filz, G. M., Dove, J. E. and Hoppe, E. J. 2002. Interface shear tests on FRP composite piles. Deep
Foundations 2002: An International Perspective on Theory, Design, Construction, and Performance, ASCE, Reston,
Va., pp.1486-1500.
Renard, F., Mair, K. and Gundersen, O. 2012. Surface roughness evolution on experimentally simulated faults.
[image:4.595.88.240.229.374.2]Sakr, M., El Naggar, M. H. and Nehdi, M. 2005. Interface characteristics and laboratory constructability tests of novel fiber-reinforced polymer/concrete piles. Journal of Composites for Construction 9, No. 3, 274-283.
Uesugi, M. and Kishida, H. 1986. Frictional resistance at yield between dry sand and mild steel. Soils Found. 26, No. 4, 139–149.
Zettler, T. E. and Frost, J. D. 2000. Shear Induced Changes in Geomembrane Surface Topogrpahy. Geosynthetics International 7, No. 1, 243-267.