AN INSIGHT INTO INTERRELATIONSHIP OF MAXIMAL OXYGEN INTAKE
BPS GMC[W],
ARTICLE INFO ABSTRACT
Modern sedentary life style and faulty food habits are leading to development of early life obesity. The journey from early life obesity to cardiovascular
their cardio
efficiency, it was used in this study to estimate cardio to find out
was conducted on 30 obese and 30 non
max was estimated by Queen’s College Step test. Parameters measured and ca height, BMI, Waist
was negative correlation between BMI and VO correlation was observed between WHR and VO VO2max
group
difference was observed in absolute VO concluded that
weight
Copyright © 2015 Shalini Sharma.This is an open access article distributed under the Creative Commons Att distribution, and reproduction in any medium, provided the original work is properly cited.
INTRODUCTION
Modern sedentary life style and faulty leading to development of early life obesit 2005). People are prone to develop cardio and other chronic diseases at young age of of early life obesity (Krauss, et al., 1998). early life obesity to cardiovascular disease w slow regression of their cardio-respiratory e respiratory efficiency refers to the ability and respiratory system to supply oxygen to during sustained physical activity. VO2max capacity to transport and utilize oxygen duri exercise. It is also known as aerobic capaci physical fitness of a person. As VO2max
measure of cardio-respiratory efficiency (Anderson, 1971; Bannerjee, et al., 1982), it has been us
estimate cardio-respiratory efficiency. Over identified as a major health problem throug
*Corresponding author: Shalini Sharma
BPS GMC[W], Khanpur Kalan, Sonepat, Haryana, India
ISSN: 0975-833X
Article History:
Received 25th May, 2015
Received in revised form
28th June, 2015
Accepted 03rd July, 2015
Published online 21st August,2015
Key words: BMI;
Cardiorespiratory efficiency; Obesity;
VO2 max;
Young women
Citation:
Shalini Sharma, 2015. “An insight into interrelationship of maximal oxygen intake
International Journal of Current Research, 7, (8
RESEARCH ARTICLE
AN INSIGHT INTO INTERRELATIONSHIP OF MAXIMAL OXYGEN INTAKE
NON-OBESE YOUNG WOMEN
*Shalini Sharma
BPS GMC[W], Khanpur Kalan, Sonepat, Haryana, India
ABSTRACT
Modern sedentary life style and faulty food habits are leading to development of early life obesity. The journey from early life obesity to cardiovascular disease will be evident by slow regression of their cardio-respiratory efficiency. As VO2 max is an accepted measure of cardio
efficiency, it was used in this study to estimate cardio-respiratory efficiency. Present study was aimed to find out whether obesity affects cardio-respiratory efficiency of young women or not. The study was conducted on 30 obese and 30 non-obese female volunteers aged between 18 and 22 years. VO max was estimated by Queen’s College Step test. Parameters measured and ca
height, BMI, Waist-Hip circumference Ratio[WHR], Pulse rate, Blood pressure and VO
was negative correlation between BMI and VO2max but it was not significant (p>0.05). A negative correlation was observed between WHR and VO2max but it was significant (p<0.05).
max per kg lean body mass shows no significant differe indicating same cardio respiratory performance in difference was observed in absolute VO2max of obese and non concluded that cardio-respiratory efficiency was not affected in ob
ht group; however ability to do exhausting work was less in o
is an open access article distributed under the Creative Commons Attribution License, which distribution, and reproduction in any medium, provided the original work is properly cited.
food habits are ty (Norman, et al., ovascular diseases their life because The journey from will be evident by efficiency. of the circulatory to skeletal muscles max is the maximum during incremental ity, which reflects max is an accepted (Anderson, et al., sed in this study to rweight has been ghout the world
BPS GMC[W], Khanpur Kalan, Sonepat, Haryana, India.
(Freedman, et al., 1997; Ogden, et al., 1998; Must, et al., 1999 signify adult obesity and development of weight-relate increased morbidity (Whitaker, et al., 1994). Decreased physica lifestyle have been implicated development of pediatric obesi et al., 1996). Despite that aerobic the management of pediatric ov have examined the impact of fitness or functional performan (Epstein, et al., 1993; Drinkard, 2000). Increased fat mass is associ performance in overweight adul et al., 2000). However, the ca tolerance remains in que primarily those who have stud obese children and adolesc maximal oxygen uptake (VO2 compared with normal-weight have concluded that exercise children and adolescents is increased metabolic demands of
Available online at http://www.journalcra.com
International Journal of Current Research
Vol. 7, Issue, 08, pp.19086-19094, August, 2015
INTERNATIONAL
An insight into interrelationship of maximal oxygen intake in obese 8), 19086-19094.
AN INSIGHT INTO INTERRELATIONSHIP OF MAXIMAL OXYGEN INTAKE IN OBESE AND
Modern sedentary life style and faulty food habits are leading to development of early life obesity. disease will be evident by slow regression of respiratory efficiency. As VO2 max is an accepted measure of cardio-respiratory respiratory efficiency. Present study was aimed respiratory efficiency of young women or not. The study obese female volunteers aged between 18 and 22 years. VO2 max was estimated by Queen’s College Step test. Parameters measured and calculated were weight, Hip circumference Ratio[WHR], Pulse rate, Blood pressure and VO2max. There max but it was not significant (p>0.05). A negative max but it was significant (p<0.05). In this study ence in obese and normal weight both the groups No significant max of obese and non-obese females. Therefore we obese group as compared to normal obese group.
ribution License, which permits unrestricted use,
., 1997; Ogden, et al., 2002; Troianao, ., 1999). Overweight commonly
nd is associated with the ed co morbid conditions and
y (Whitaker, et al., 1997; Kuczmarski, cal activity and a more sedentary
ted as important factors in the sity (Must A, 1996; Gortmaker, robic exercise is widely used in overweight, relatively few studies of excess adiposity on exercise nce in children and adolescents ., 1993; Drinkard, et al., 2001; Goran, et al., ssociated with decreased exercise
adults and adolescents (Goran cause of this limited exercise
estion. Several investigators, e studied moderately overweight and cents, have reported similar 2 max) relative to body weight control subjects. These studies ise intolerance in overweight attributable primarily to the of carrying an excess load, rather
INTERNATIONAL JOURNAL OF CURRENT RESEARCH
than a true decrease in cardio- respiratory fitness (Maffeis et al., 1994). However, some studies have reported that overweight individuals have significantly decreased maximal heart rate; heart rate reserve, which is defined as maximal heart rate minus resting heart rate (Peterson et al., 2004); and myocardial work efficiency. Whether these differences significantly influence fitness and performance is unclear. Obesity-related changes in exercise catecholamine response, myocardial metabolism, and left ventricular morphology may be associated with these findings (Peterson et al., 2004). Peak oxygen uptake (VO2), that is, the highest oxygen uptake elicited during an exercise test to exhaustion, is recognized as the best single indicator of young people's aerobic fitness. It is used in the prescription of aerobic exercises, in the monitoring of physical training adaptations, and as a predictive parameter of associated morbidities (ACSM, 2006). To determine the extent to which the physiological markers of aerobic fitness change as result of exposition to regular endurance exercise in children and adolescents, it is required longitudinal studies, as well as to consider the influence of age and growth during pubertal development (Armstrong, et al., 2011). Also, it has been extensively noted that peak VO2 is highly correlated with body size, thus concurrent effects of size with age and maturation on peak VO2 need to be appropriately accounted for.
REVIEW OF LITERATURE
VO2 max, or maximal oxygen uptake, is one factor that can determine an athlete's capacity to perform sustained exercise and is linked to aerobic endurance. VO2 max refers to the maximum amount of oxygen that an individual can utilize during intense or maximal exercise. It is measured as "milliliters of oxygen used in one minute per kilogram of body weight. This measurement is generally considered the best indicator of an athlete's cardiovascular fitness and aerobic endurance. Theoretically, the more oxygen you can use during high level exercise, the more ATP (energy) you can produce. This is often the case with elite endurance athletes who typically have very high VO2 max values. A clear link exists between oxygen consumption (VO2) of the body and cardio-respiratory fitness because oxygen delivery to tissues is dependent on lung and heart function. VO2max (maximal oxygen uptake, maximal aerobic power) is the maximal rate at which oxygen can be used by the body during maximal work; it is related directly to the maximal capacity of the heart to deliver blood to the muscles. VO2max can be measured or predicted by fitness tests (e.g. maximal tests, submaximal tests, Polar Fitness Test). VO2max is a good index of cardio-respiratory fitness and a good predictor of performance capability in aerobic events such as distance running, cycling, cross-country skiing, and swimming. VO2max can be expressed either as milliliters per
minute (ml/min = ml min-1) or this value can be divided by
the person’s body weight in kilograms (ml/kg/min = ml kg -1min-1). Obesity is a complex condition that can lead to a
plethora of health problems including decreased fitness, metabolic complications, and psychological co-morbidities (Wang, et al., 2006). Obesity is characterized by a greater
than average increase in adiposity over time. If left untreated, obesity-related co-morbidities may develop in children at an early age that include sleep apnea, (Li, et al., 2010) cardiovascular disease risk factors, type 2 diabetes, and mental health issues, (Poirier, et al., 2006; Must, et al., 1999; Sanderson, et al., 2011). Additional evidence suggests that it is highly likely that obese children will carry their excess weight into adulthood and thus have an increased risk of becoming obese adults in the absence of intervention (Power, et al., 1997). It has been demonstrated that obese children have poor maximal cardio-respiratory fitness level than their normal weight peers, given the increased effort required to move a larger mass (Dupuis, et al., 2000). This is troublesome as physical fitness (VO2max) has been shown to be a modifiable health indicator in children and adolescents that may prevent the onset of metabolic complication, independent of the presence of excess adiposity (Ortega, et al., 2008). As a result, the physical fitness of obese children warrants further investigation, as it may serve to be a valuable component of clinical assessment of health risk in an obese pediatric population.
Research shows that although VO2 max has a genetic component it can also be increased through training. The two methods for increasing VO2 max include increases in both training volume and intensity. Research also indicates that the less fit an individual is, the more they can increase their VO2 max through training. In fact, novice exercisers have been able to increase VO2 max by 20 percent through proper training. Fit athletes have a harder time increasing their VO2 max, most likely because they are already so near their genetic potential. The point at which oxygen consumption plateaus defines the VO2 max or an individual's maximal aerobic capacity. It is generally considered the best indicator of cardio-respiratory endurance and aerobic fitness. However, as well discuss in a moment, it is more useful as an indicator of a person's aerobic potential or upper limit than as a predictor of success in endurance events. Aerobic power, aerobic capacity and maximal oxygen uptake are all terms used interchangeably with VO2 max. VO2 max is usually expressed relative to bodyweight because oxygen and energy needs differ relative to size.
participants (n = 62) were able to attain a true VO2max, reinforcing the notion that VO2peak is a more realistic outcome in obese children (Breithaupt, et al., 2012). It has also been suggested that obese children may perceive various intensities of physical exertion differently than their normal weight counterparts (French, et al., 1995; Schwimmer, et al., 2003; Epstein, et al., 1992). One study has previously illustrated that obese children rated their perceived exertion on an incremental treadmill test significantly higher than a normal weight control group (Marinov, et al., 2002). However, there is very limited research available for evaluating rate of perceived exertion during graded exercise tests in obese children and no available research on perceived exertion for sub-maximal graded exercise tests in this population. Despite this finding, other research has found that children are successful at reporting subjective measures of physical exertion during graded exercise tests (Mahon, et al., 1998), and this may also be true for obese children. To our knowledge, no study has compared how obese children from a clinical cohort perceive their exertion while completing both maximal and sub-maximal graded fitness tests.
AIMS AND OBJECTIVES
1. To find out whether obesity affects cardio-respiratory efficiency of young women or not.
2. To alert them at proper time to take necessary action and will also help to plan the type of exercise suitable for their health need.
MATERIALS AND METHODS
The study was conducted on thirty (30) obese and thirty (30) non-obese female volunteers aged between 18 and 22 years in the department of physiology B.P.S Government medical college for women khanpur kalan, consent was taken. They were classified as obese and non-obese according to obesity
classification based on Body Mass Index (BMI). The revised
BMI cut-off for Asians as recommended by WHO was considered to classify overweight and obesity (WHO Expert Consultation, 2004). The purpose of the study was explained to all the participants. Institutional ethical committee approval had been taken before start of study. Pulse rate and blood pressure were measured at the brachial artery from the arm using the Omron T8 Automatic Blood Pressure instrument.
Inclusion criteria for both groups
1) Healthy young adults aged between 18-22 years 2) Sedentary life style.
Exclusion criteria for both groups
1) Subjects with history of cardiopulmonary disease 2) Chronically ill
3) Medication for long duration
4) History of any major surgery (cardiac, pulmonary, abdominal) related to study and
5) Subjects undergoing any physical conditioning program.
Participants were instructed to empty their bladder prior to anthropomorphic measurements. Weight was recorded to the nearest 0.1 kg with clothing using a standard scale. Height was
measured to the nearest 1 cm without footwear. BMI was
calculated using Quetlet’s index as weight (kg) over height
(m2).
BMI = Weight (Kg) / (height in meter)2
W/H Ratio (Waist-Hip Circumference ratio): The waist
Circumference is the minimum Circumference between costal margin and iliac crest, measured in horizontal plane, with the subject standing. Hip circumference is the maximum Circumference in the horizontal plane, measured over the buttocks. The ratio of the former to the latter provides an index of proportion of intra-abdominal fat. Estimation of
VO2max by Queen College Step Test (McArdle, et al., 1972);
It was performed using stepping bench of 16.25 inches height. Stepping was done for total duration of 3 minutes at the rate of 24 steps ups/min for boys and 22 Steps ups/ min for girls, which was set by a metronome. After completion of exercise subjects were allowed to remain standing comfortably and carotid pulse rate was measured from 5th to 20th sec. of recovery period. This 15 sec pulse rate counted to beats/min
and the following equations (Mc Ardle, et al., 2001; Mc Ardle,
et al., 1972) used to predict VO2max.
For males – VO2max (ml/kg/min.) = 111.33–(0.42 × pulse rate in beats/min)
For females – VO2max (ml/kg/min) = 65.81–(0.1847 × pulse rate in beats/min).
The data obtained was analyzed using SPSS package (Version 19). Unpaired t-test was used to test the significance of difference between mean values of VO2max of obese and normal weight group, to test the significance of difference between mean values of VO2max in obese females and normal weight females.
RESULTS
[image:3.595.82.516.663.780.2]ANTHROPOMETRICS PROFILES IN THE STUDY POPULATION (TABLE 1.1 & TABLE 1.2)
Table 1. Group statistics of baseline parameters of the study groups
Group Statistics
Variables Group N Mean Std. Deviation Std. Error Mean
AGE(years) 1 30 19.90 0.995 0.182
2 30 19.62 0.942 0.175
HEIGHT (cm) 1 30 158.61 6.05 1.105
2 30 159.82 5.72 1.062
BMI (Kg/m2) 1 30 20.31 1.02 0.186
2 30 26.39 3.28 0.6092
WAIST(Inches) 1 30 26.70 1.32 0.240
2 30 30.55 3.32 0.61
WHR 1 30 0.74 0.043 0.0077
2 30 0.75 0.058 0.0109
Group 1= normal weight,
Table 1.2
Independent Samples Test
Levene's Test for Equality
of Variances t-test for Equality of Means
F Sig. t df Sig.
(2-tailed)
Mean Difference
Std. Error Difference
AGE (Years) Equal variances assumed 0.009 0.926 1.107 57 0.273 0.27 0.25
Equal variances not assumed 1.108 56.97 0.273 .27 0.25
HEIGHT Equal variances assumed 0.086 0.771 -.789 57 0.433 -1.210 1.53
Equal variances not assumed -.790 56.97 0.433 -1.210 1.53
BMI Equal variances assumed 16.975 0.0001 -9.676 57 0.0001 -6.077 0.62
Equal variances not assumed -9.539 33.22 0.0001 -6.07 0.63
WAIST(in inches) Equal variances assumed 21.584 0.0001 -5.890 57 0.0001 -3.85 0.65
Equal variances not assumed -5.816 36.340 0.0001 -3.85 0.66
Equal variances assumed 0.880 0.352 -1.538 57 0.130 -.0205 0.013
Equal variances not assumed -1.530 50.888 0.132 -.020 0.013
Group 1= normal weight,
Group 2= Overweight & Obese, WHR= Waist Hip Ratio, BMI= Body mass index.
There are no significant differences observed in the age, Height & WHR in the obese group compared to normal control group (Age 19.90 ± .995 vs 19.62 ±.942, Height 158.61±6.053 vs 159.82±5.721, WHR 0.74 ± 0.043 vs 0.75 ± 0.058 respectively with a p values >0.05 , Table 1.1 and 1.2). But BMI and Waist circumference were significantly higher amongst obese & Overweight group compared to non obese group (BMI 26.39 ± 3.28 vs 20.31±1.02, Waist circumference
30.55±3.32 vs 26.70±1.32; p value 0.0001).
Pressure Pulse Profiles & VO2 Max in the study Population (Table 2.1 & 2.2) Table 2.1
Group Statistics
Group N Mean Std. Deviation Std. Error Mean
PULSE RATE (basal) 1 30 80.33 9.711 1.773
2 30 79.86 6.479 1.203
SBP (In mmhg) 1 30 118.80 4.944 0.903
2 30 118.41 5.193 0.964
DBP (in mmhg) 1 30 78.13 3.319 0.606
2 30 78.83 3.485 0.647
Pulse after exercise 1 2 30 30 146.10 144.72 13.397 17.596 2.446 3.268
VO2 MAX
1 30 56.8727 0.90960 0.16607
2 30 56.8860 1.09740 0.20378
Table 2.2
Independent Samples Test
Levene's Test for
Equality of Variances t-test for Equality of Means
F Sig. t df Sig.
(2- tailed)
Mean Difference
Std. Error Difference
PULSE RATE (basal) Equal variances assumed 5.708 0.020 .218 57 0.828 .471 2.157
Equal variances not assumed .220 50.720 0.827 .471 2.143
SBP (mmHg) Equal variances assumed 0.146 0.704 .293 57 0.771 .386 1.320
Equal variances not assumed .292 56.605 0.771 .386 1.321
DBP (mmHg) Equal variances assumed .176 0.676 -.784 57 0.436 -.694 .886
Equal variances not assumed -.783 56.607 0.437 -.694 .887
pulse after exercise Equal variances assumed 0.816 0.370 .339 57 0.736 1.376 4.063
Equal variances not assumed .337 52.311 0.737 1.376 4.082
VO2 MAX Equal variances assumed 0.427 .516 -.051 57 0.960 -.01335 .26204
Equal variances not assumed -.051 54.382 0.960 -.01335 .26288
Group 1= normal weight,
Group 2= Overweight & Obese, SBP= Systolic blood pressure in mmHg,
DBP= Diastolic Blood Pressure in mmHg, VO2 Max= Maximum Oxygen utilization
[image:4.595.96.506.381.495.2]Figure 1. Regression analysis of VO2 max based on BMI
Model Summary and Parameter Estimates
Dependent Variable: VO2 MAX
Equation Model Summary Parameter Estimates
R Square F df1 df2 Sig. Constant b1
Linear 0.001 .074 1 57 0.787 57.095 -.009
The independent variable is BMI.
[image:5.595.129.467.474.744.2]The graph 1 depicts regression analysis of Vo2 max based on BMI. When we compared VO2 max of whole study population it was observed that there was a negative correlation between BMI & VO2 max however it was not significant (P=0.787).
Model Summary and Parameter Estimates
Dependent Variable: VO2 MAX
Equation Model Summary Parameter Estimates
R Square F df1 df2 Sig. Constant b1
Linear 0.042 2.51 1 57 0.118 58.737 -.065
The independent variable is Waist (in inches).
[image:6.595.166.434.184.394.2] [image:6.595.78.529.446.489.2] [image:6.595.185.410.537.722.2]The graph 2 depicts regression analysis of Vo2 max based on waist circumference (WC). When we compared VO2 max of whole study population it was observed that there was a negative correlation between WC & VO2 max however it was not significant (P=0.118).
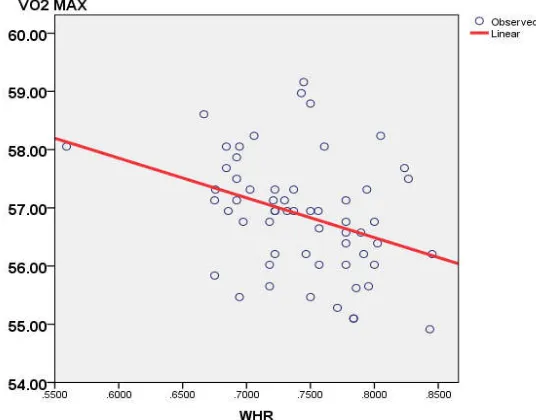
Figure 3. Regression analysis of VO2 Max Based on Waist Hip Ratio
Model Summary and Parameter Estimates
Dependent Variable: VO2 MAX
Equation Model Summary Parameter Estimates
R Square F df1 df2 Sig. Constant b1
Linear 0.126 8.238 1 57 0.006 61.950 -6.827
The independent variable is WHR.
The graph 3 depicts regression analysis of Vo2 max based on waist Hip Ratio (WHR). When we compared VO2 max of whole study population it was observed that there was a negative correlation between WHR & VO2 max and it was significant (P=0. 0.006).
Figure 4. Scatter diagram showing the relationship between BMI and pulse rate
Variable Pulse rate
BMI r 0.8
[image:6.595.126.473.747.785.2]DISCUSSION
VO2max is a measure of the functional limit of cardio respiratory system and single most valid index of maximal exercise capacity. The absolute value of VO2max is one of the indices of an individual’s cardio-respiratory fitness to transport oxygen to working muscles. Earlier studies have used VO2max values in ml/kg/min to assess the level of cardio respiratory fitness. The aim of the present study was to investigate the association between aerobic test performance and body build measured by BMI and waist circumference & Waist Hip Ratio. We studied the performance of overweight, obese and normal weight adolescents, finding that overweight and non-overweight young individuals have similar absolute (mLO2/minute) cardio-respiratory fitness but that the functional impairment observed in overweight young individuals is significantly associated with the increased energy demands needed to move their excess body weight. The additional metabolic cost of excess adiposity in overweight adolescents was demonstrated most clearly during unloaded cycling.
For overweight young individuals simply moving their lower limbs induced significantly greater absolute oxygen uptake and led to consumption of a significantly larger proportion of their cardio-respiratory reserve. In addition, the greater metabolic cost of unloaded cycling was shown to predict a poorer performance during the functional performance evaluation walk/run test. Part of the metabolic cost of motion in significantly overweight young individuals likely is attributable to decreased mechanical efficiency. Chatterjee et al in 2005 used Queens College step test in their study to assess cardio-respiratory fitness in obese and non-obese boys aged 10-16 yrs and it was found that VO2 max per kg of body weight was relatively less in obese subjects indicating reduced aerobic capacity. They concluded that during exhaustive exercise, the excessive hyperactive body musculature fails to uptake sufficient amount of oxygen due to deposition of proportionately high amount of fat mass (Chatterjee, et al., 2005). It was found that during the weight reduction program in obese, their VO2max (ml/kg/min) increased due to withdrawal of fat induced inhibitory action toward oxygen utilization by body musculature (Bandyopadhyay, et al., 2003).
Our result also depicts similar results. Absolute VO2max indicates an individual’s cardio-respiratory fitness to transport
oxygen to working muscles (Chatterjee, et al., 2005). The
present study shows that there is no significant difference in absolute VO2 max of obese and non-obese group indicating there is no extra stress on cardio-respiratory system because of excess fat. Buskirk and Taylor (1957),
Davies et al (1975), and Anne-Caroline Norman et al (42),
also have similar findings in their studies. In a recent study
conducted by Wood et al (43) in overweight and obese adults
also found results supporting present study. In their study comparison of VO2max in non-obese and obese was not done but they observed that VO2 platue was reached in 85% of overweight and obese adults after performing continuous incremental exercise and some tests fulfilling criteria for
reaching VO2 platue. Chatterjee et al. (2009) have
contradictory finding, in which absolute VO2max is higher in obese indicating higher cardiac load during working. In the
current study VO2 max of whole study population was found
to have a negative correlation between WHR & VO2 max and it was significant (P=0. 0.006, Graph 3). Ideal reference for the VO2max as a test of cardiovascular-respiratory performance might well be the weight of muscles actually performing the work. In this study VO2max per kg lean body mass shows no significant difference in obese and normal weight group indicating same cardio respiratory performance in both the groups. Chatterjee et al. (39) found similar results in their study. Davies et al. (1975) found contradictory result. Changes in body composition, that is, proportional increase in fat-free mass in relation to the decrease of total body mass, as end result of the endurance training-based intervention have a beneficial effect to aerobic fitness and consequently in the health status of the obese boys. Longitudinal data based on Canadian and Belgian studies indicated, on average, that peak velocity of growth in stature and peak VO2 tend to be coincident biological events (Geithner, et al., 2004).
Our results also indicate that utilization of oxygen at tissue level may be more efficient in proportion to total mass and active fat-free mass in obese individuals. In this study we found a significant negative correlation between WHR and VO2max (ml/kg/min) (p=0.006 Figure3). This indicates the striking effects of increasing WHR on Cardio respiratory fitness. This is in line with the findings of the earlier studies (Chatterjee, et al., 2005; Bandopadhyay, et al., 2003; Bandopadhyay, 2012). Norman et al in 2005 studied influence of excess adiposity on exercise fitness and performance in overweight children and adolescents by cycle ergometry fitness test and found that overweight and non-over weight adolescents had similar absolute cardio-respiratory fitness but the functional impairment was significantly associated with increased energy demands needed to move their excess bodyweight (Norman, et al., 2005). Patkar and Joshi in 2011 compared cardio-respiratory fitness between obese and non-obese subjects and concluded that cardio-respiratory efficiency was not affected in obese group as compared to normal weight group, however ability to do exhausting work was less in obese (Patkar, et al., 2011).
Summary
Therefore the exercise programs can be best designed to increase caloric expenditure and thus to decrease body fat rather than to improve aerobic fitness. There was no detrimental effect of obesity on cardio-respiratory efficiency in the study groups.
Suggestions
Considering these findings of the study, therapeutic exercise programs for obese young adults can be best designed to increase caloric expenditure and thus to decrease body fat rather than to improve aerobic fitness. Thus incorporation of activities need not be at high sustained intensities. This will increase their compliance for exercise programs. In addition accurate guidance regarding the type of food consumption will increase the tolerance for maximum exercise and reduce the incidence of obesity related health hazards in later years of life.
REFERENCES
ACSM, 2006. American College of Sports Medicine. ACSM’S Guidelines for Exercise Testing and Prescription. Philadelphia, Pa, USA: Lippincott Williams & Wilkins.
Anderson, KM., Shephard, RJ., Denolin, H., Varnauskas, E., Masironi, R. 1971. Fundamentals of exercise testing (WHO, Geneva).
Armstrong, N., Barker, AR. 2011. Endurance training and elite young athletes. Medicine and Sport Science., 56:59–83. Bandyopadhyay, 2012. Cardiorespiratory fitness in obese girls.
Indian J Physiol Pharmacol., 56(4):393-395.
Bandyopadhyay, A., Chatterjee, S. 2003. Body composition, morphological characteristics and their relationship with cardiorespiratory fitness. ErgonomicsSA., 1: 19–27.
Banerjee, PK., Chatterjee, S., Chatterjee, P., Maitra, SR. 1982.
Maximal oxygen uptake in boys. Indian Journal of Medical
Research., 75: 380–386.
Breithaupt, P., Adamo, KB., Colley, RC. 2012. The HALO submaximal treadmill protocol to measure cardiorespiratory fitness in obese children and youth: a proof of principle study. Appl Physiol Nutr Metab., 37:1–7.
Buskirk, E., Taylor, HL. 1957. Maximal oxygen intake &its relation to body composition with special reference to
chronic physical activity & obesity. Journal of Applied
Physiology., 11: 72–78.
Chatterjee, S., Chatterjee, P., Bandyopadhyay, A. 2009.
Cardiorespiratory fitness of obese boys. Indian Journal of
Physiology & Pharmacology. 49:315-317
Davies, CTM., Godfrey, S., Light, M., Sageant, AJ., Zeidifard, E. 1975. Cardiopulmonary responses to exercise in obese
girls & young women. Journal of Applied Physiology., 38:
373–376.
Drinkard, B., McDuffie, J., McCann, S., Uwaifo, GI., Nicholson, J., Yanovski, JA. 2001. Relationships between walk/run performance and cardiorespiratory fitness in adolescents who are overweight. Phys Ther., 81:1889– 1896.
Dupuis, JM., Vivant, JF., Daudet, G., et al. 2000. Personal sports training in the management of obese boys aged 12 to 16 years [In French] Arch Pediatr Adolesc Med., 7:1185– 93.
Epstein FH, Higgins M. 1992. Epidemiology of Obesity. Philadelphia, PA: JB Lippincott Co.
Epstein, LH., Goldfield, GS. 1999. Physical activity in the treatment of childhood overweight and obesity: current evidence and research issues. Med Sci Sports Exerc., 31(suppl):S553–S559.
Freedman, DS., Srinivasan, SR., Valdez, RA., Williamson, DF., Berenson, GS. 1997. Secular increases in relative weight and adiposity among children over two decades: the Bogalusa Heart Study. Pediatrics., 99:420–426.
French, SA., Story, M., Perry, CL. 1995. Self-esteem and obesity in children and adolescents: a literature review. Obes Res., 3:479–90.
Geithner, CA., Thomis, MA., Vanden Eynde, B. et al. 2004. Growth in peak aerobic power during adolescence. Medicine and Science in Sports and Exercise., 36(9):1616– 1624.
George, JD., Paul, SL., Hyde, A., et al. 2009. Prediction of maximum oxygen uptake using both exercise and non-exercise data. Meas Phys Educ Exerc Sci., 13:1–12. Goran, M., Fields, DA., Hunter, GR., Herd, SL., Weinsier, RL.
2000. Total body fat does not influence maximal aerobic capacity. Int J Obes Relat Metab Disord. 24:841–848. Gortmaker, SL., Must, A., Sobol, AM., Peterson, K., Colditz,
GA., Dietz, WH. 1996. Television viewing as a cause of increasing obesity among children in the United States, 1986–1990. Arch Pediatr Adolesc Med.,1996;150:356–362.
Krauss, RM., Winston, M., Fletcher, BJ., Grundy, SM. 1998.
Obesity Impact on Cardiovascular Disease. Circulation.,
98: 1472–1476.
Kuczmarski, RJ., Flegal, KM., Campbell, SM., Johnson, CL. 1994. Increasing prevalence of overweight among US adults. The National Health and Nutrition Examination Surveys, 1960 to 1991. JAMA., 272:205–211.
Li, C., Ford, ES., Zhao, G., Croft, JB., Balluz, LS., Mokdad, AH. 2010. Prevalence of self-reported clinically diagnosed sleep apnea according to obesity status in men and women: National Health and Nutrition Examination Survey, 2005– 6. Prev Med., 51:18–23.
Maffeis, C., Schena, F., Zaffanello, M., Zoccante, L., Schutz, Y., Pinelli, L. 1994. Maximal aerobic power during running and cycling in obese and non-obese children. Acta Paediatr., 83:113–116.
Mahon, AD., Stolen, KQ., Gay, JA. 1998. Differentiated ratings of perceived exertion at ventilatory threshold in children and adults. Eur J Appl Physiol Occup Physiol., 78(2):115–20.
Marinov, B., Kostianev, S., Turnovska, T. 2002. Ventilatory efficiency and rate of perceived exertion in obese and non-obese children performing standardized exercise. Clin Physiol Funct I.,22:254–60.
McArdle, W.D. et al. 1972. Reliability and interrelationships between maximal oxygen uptake, physical work capacity and step test scores in college women. Medicine and Science in Sports., 4:182-186.
McArdle, WD., Katch, IF., Katch, LV. 2001. Exercise Physiology: Energy, Nutrition and Human Performance; 5th Ed.
Must, A., Strauss, RS. 1999. Risks and consequences of childhood and adolescent obesity. Int J Obes Relat Metab Disord., 23(suppl 2):S2–S11.
Must, A., Strauss, RS. 1999. Risks and consequences of childhood and adolescent obesity. Int J Obesity., 23:S2–11.
Norman, A., Drinkard, B., Duffie, JRM. et al. 2005. Influence
of excess adiposity on exerciser fitness& performance in
overweight children & adolescents. Pediatrics., 115: 690–
696.
Norman, AC., Drinkard, B., Jennifer, R., Ghorbani, BS., Lisa, BY., Jack, A. 2005. Influence of excess adiposity on exercise fitness and performance in overweight children and adolescents. Pediatrics., 115(6):600-696.
Norman, AC., Drinkard, B., McDuffie, JR., Ghorban, S. 2005.
Influence of excess adiposity on exerciser fitness&
performance in overweight children & adolescents.
Pediatrics., 115: 690–696.
Ogden, CL., Flegal, KM., Carroll, MD., Johnson, CL. 2002. Prevalence and trends in overweight among US children and adolescents, 1999–2000. JAMA., 288:1728–1732. Ortega, FB., Ruiz, JR., Castillo, MJ., Sjöström, M. 2008.
Physical fitness in childhood and adolescence: a powerful marker of health. Int J Obesity., 32:1–11.
Patkar, KU., Joshi, AS. 2011. Comparison of VO2max in obese and non-obese young Indian population. Indian J Physiol Pharmacol., 55(2):188-192.
Peterson, LR., Herrero, P., Schechtman, KB. et al. 2004. Effect of obesity and insulin resistance on myocardial substrate metabolism and efficiency in young women. Circulation., 109:2191–2196.
Poirier, P., Giles, TD., Bray, GA., et al. 2006. Obesity and cardiovascular disease: pathophysiology, evaluation, and effect of weight loss. Arterioscl Throm Vas., 26:968–76. Power, C., Lake, JK., Cole, TJ. 1997. Measurement and
long-term health risks of child and adolescent fatness. Int J Obes Relat Metab Disord., 21:507–26.
Rachel E. Wood, Andrew P. Hills, Gary R. Hunter, Neil A. King, Nuala M. Byrne, 2010. Vo2max in overweight and
obese adults: do they meet the threshold criteria ? Medicine
and Science in Sports and Exercise., 42(3): 470–477.
Sanderson, K., Patton, GC., McKercher, C., Dwyer, T., Venn, AJ. 2011. Overweight and obesity in childhood and risk of mental disorder: A 20-year cohort study. Aust N Z J Psychiatry., 45:384–92.
Schwimmer, JB., Burwinkle, TM., Varni, JW. 2003. Health-related quality of life of severely obese children and adolescents. J Am Med Assoc., 289:1813–9.
Troiano, RP., Flegal, KM. 1998. Overweight children and adolescents: description, epidemiology, and demographics. Pediatrics., 101(3 pt 2):497–50.
Wagner, PD. 2000. New ideas on limitations to VO2 max. Exerc Sport Sci Rev., 28:10–4.
Wang, Y., Lobstein, T. 2006. Worldwide trends in childhood overweight and obesity. Int J Pediatr Obes., 1:11–25. Whitaker, RC., Wright, JA., Pepe, MS., Seidel, KD., Dietz,
WH. 1997. Predicting obesity in young adulthood from childhood and parental obesity. N Engl J Med., 337:869– 873.
WHO Expert Consultation, 2004: Appropriate body mass index for Asian population and its implications for policy and intervention strategies. Lancet., 363: 157-163.