RESEARCH ARTICLE
Divergent physiological responses in laboratory rats and mice
raised at high altitude
Alexandra Jochmans-Lemoine1, Gabriella Villalpando2, Marcelino Gonzales2, Ibana Valverde2, Rudy Soria2and Vincent Joseph1,*
ABSTRACT
Ecological studies show that mice can be found at high altitude (HA– up to 4000 m) while rats are absent at these altitudes, and there are no data to explain this discrepancy. We used adult laboratory rats and mice that have been raised for more than 30 generations in La Paz, Bolivia (3600 m), and compared their hematocrit levels, right ventricular hypertrophy (index of pulmonary hypertension) and alveolar surface area in the lungs. We also used whole-body plethysmography, indirect calorimetry and pulse oxymetry to measure ventilation, metabolic rate (O2 consumption and CO2 production), heart rate and pulse oxymetry oxygen saturation (pO2,sat) under ambient conditions, and in response to exposure to sea level PO2(32% O2=160 mmHg for 10 min) and hypoxia (18% and 15% O2=90 and 75 mmHg for 10 min each). The variables used for comparisons between species were corrected for body mass using standard allometric equations, and are termed mass-corrected variables. Under baseline, compared with rats, adult mice had similar levels ofpO2,sat, but lower hematocrit and hemoglobin levels, reduced right ventricular hypertrophy and higher mass-corrected alveolar surface area, tidal volume and metabolic rate. In response to sea levelPO2and hypoxia, mice and rats had similar changes of ventilation, but metabolic rate decreased much more in hypoxia in mice, while pO2,sat remained higher in mice. We conclude that laboratory mice and rats that have been raised at HA for >30 generations have different physiological responses to altitude. These differences might explain the different altitude distribution observed in wild rats and mice.
KEY WORDS: Chronic hypoxia, Metabolism, Physiology, Respiration, Rodents
INTRODUCTION
Physiological changes at high altitude are required to optimize the diffusion, transport and cellular utilization of oxygen and counteract the ambient low pressure of oxygen (PO2). In endemic species that have been living for millions of years at altitude, physiological adaptations are thought to be linked to genetic selection, and are mostly characterized by a low or absent pulmonary hypertension (Tucker and Rhodes, 2001), elevated affinity of hemoglobin (Hb) for O2(Storz et al., 2010a, 2009), higher density of micro-vessels and mitochondria surface area in the heart (Qi et al., 2008), left-ventricle hypertrophy that could lead to increased stroke volume (Pichon et al., 2013), and hematocrit (Hct) level that remains
within the sea level range (Monge and Leon-Velarde, 1991; Storz et al., 2010b). Contrastingly, some species originating from sea level have high Hct level, drastic pulmonary hypertension or hypertrophy of the heart when exposed to high altitude (Tucker and Rhodes, 2001), illustrating the fact that these species might have a genetic pre-disposition that would interfere with survival at high altitude and present a ‘genetic barrier’ for colonization of high altitude regions.
Interestingly, ecological reports from South America and New Zealand indicate that mice (Mus musculus) are present up to an altitude of 4000 m (Storz et al., 2007), while rats (Rattus
norvegicus) are notably absent at high altitude (Anderson, 1997;
Innes, 2005). In these two regions, rats and mice have been introduced over the last eight to five centuries by human migrations (Wilmshurst et al., 2008; see also Storz et al., 2007); accordingly, comparative studies between rats and mice might be useful to further understand the physiological responses at altitude in species that are not ‘high altitude native’, but might nonetheless have different success for life at altitude.
Over the past 20 years, we have been able to raise laboratory rats (Sprague–Dawley) for more than 30 generations in laboratory conditions at an altitude of 3600 m above sea level, in La Paz, Bolivia. These animals present elevated Hct and Hb levels, a right ventricular hypertrophy (a sign of pulmonary hypertension), an altered alveolar structure with enlarged airspaces in the lungs, and impaired respiratory control (Lumbroso et al., 2012). Considering that elevated Hct and pulmonary hypertension impair survival and lead to right heart failure (Lumbroso et al., 2012; Naeije and Manes, 2014; Storz et al., 2010b), this might explain why rats have not been able to establish stable colonies in high altitude regions under natural conditions.
In the present study, we asked whether laboratory mice with a similar history of life at high altitude have different physiological responses from rats. To this aim we compared arterial oxygen saturation, hematological, cardiac, ventilatory, metabolic and lung characteristics in adult mice and rats from a population that have been born and raised at an altitude of 3600 m (La Paz, Bolivia) since 1992. The study was performed in males and females to address whether sex-specific physiological differences would be present in adult mice and rats at high altitude.
RESULTS
Physiological parameters, hematology and lung architecture in high altitude rats and mice
Arterial oxygen saturation, heart rate and hematology
Under baseline conditions, rats and mice had oxygen saturation (pO2,sat) values around 80%, without significant effect of species or sex (Fig. 1A). Mice had a lower right ventricular hypertrophy compared with rats (P<0.0001 for species, Fig. 1B). Heart rate (fH) was higher in mice than in rats (P<0.0001 for species, Received 21 August 2014; Accepted 29 January 2015
1
Centre de Recherche du CHU de Québec, and UniversitéLaval, Quebec, Quebec, Canada G1L3L5.2Instituto Boliviano de Biologia de Altura, and Universidad Mayor de San Andrés, La Paz, Bolivia.
*Author for correspondence (Joseph.Vincent@crsfa.ulaval.ca)
The
Journal
of
Experimental
Fig. 1C), but when the difference in body mass was taken into account by applying the allometric scaling factor (fH in beats min−1/mass in g−0.25 – see Materials and methods), mice had a lower mass-corrected fH than rats (P<0.0001 for species, Fig. 1D), and female rats had a lower mass-correctedfHthan male rats (Fig. 1D).
Compared with rats, high altitude mice showed lower Hct (P<0.0001 for species, Fig. 1E) and Hb concentration (P<0.0001 for species, Fig. 1F) values. Interestingly, the Hb value in mice was below the normal range of the sea level value (see Table 1) while Hct was slightly higher than the normal sea level range (Table 1). In rats, both Hct and Hb values were above the normal sea level range (Table 1). Compared with males, females of both species had lower
Hct (P<0.0001 for sex, Fig. 1E), and female rats had lower Hb values than male rats (Fig. 1F).
Minute ventilation, tidal volume and respiratory frequency
Compared with rats, mice had a higher mass-specific minute ventilation (V˙E), tidal volume (VT) and respiratory frequency (fR,P<0.0001 for species, Fig. 2A–C). Female mice had a higher mass-specific V˙E (P=0.04 for sex) andVT (P=0.04 for sex) than male mice (Fig. 2A,B). When corrected for body mass using standard allometric corrections, there was a significant effect of species (P<0.0001) and sex (P=0.04) for V˙E: male mice had a similar mass-correctedV˙Eand fRto male rats, but a higher mass-correctedVT(Fig. 2D–F). Female mice had a higher mass-corrected
V˙EandVTcompared with male mice (Fig. 2D,E). Mass-correctedfR was lower in female rats compared with male rats (Fig. 2F), but there was no significant effect of species.
Metabolic rate, respiratory exchange ratio and rectal temperature Compared with rats, mice had a higher mass-specific (Fig. 3A,B) or mass-corrected (Fig. 3C,D) O2 consumption (V˙O2) and CO2 production (V˙CO2) (P<0.0001). The respiratory exchange ratio (V˙CO2/V˙O2) was higher in rats than in mice (P<0.0002 for species, Fig. 3E). Rectal temperature measured before the onset of respiratory and metabolic recordings was similar in rats (35.2± 0.2°C) and mice (35.2±0.2°C). There was no effect of sex for metabolic variables.
Lung volume, lung mass and lung architecture
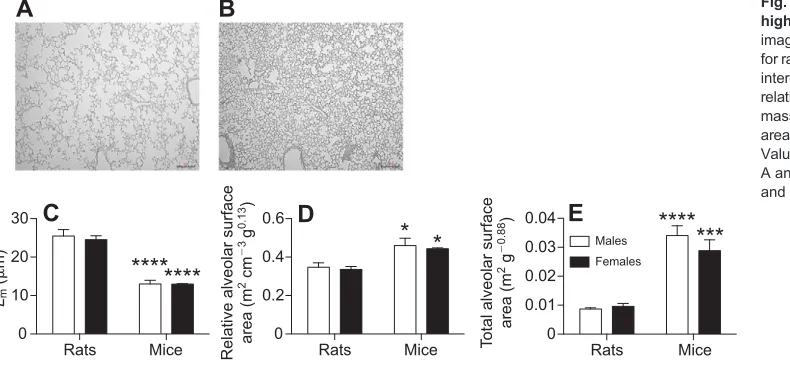
Compared with rats, mice had a higher mass-specific lung volume and lung mass (P<0.0001 for species, Fig. 4). Because the allometric scaling parameter is 1 for lung volume and lung mass (see Materials and methods), mass-specific values allow direct comparison between species of different body mass. Representative lung images are presented in Fig. 5A for rats and Fig. 5B for mice: note the enlarged air spaces in rats compared to mice. The mean linear intercept (Lm) was lower in mice than in rats (P<0.0001 for species, Fig. 5C), which was reflected in higher mass-corrected relative and total alveolar surface area in mice (P<0.0001 for species, Fig. 5C,D). There was no effect of sex for these variables.
Because alveolar surface area is directly proportional to oxygen consumption (Tenney and Remmers, 1963), we also calculated the ratio of the total alveolar surface area to O2consumption (m2ml−1 O2 consumed in 1 min). There was no significant effect of sex (P=0.58 for sex) or significant sex×species interaction. The mean value was higher in mice than in rats (Fig. 6), and both values were higher than the expected sea level values (Table 1).
Respiratory, metabolic and heart rate responses to changes in inspiredPO2in high altitude rats and mice
For the responses that were normalized to baseline values, there was no significant effect of sex; accordingly, males and females were pooled. At 12% O2[corresponding to a partial pressure of inspired O2(PIO2) of 60 mmHg–see Materials and methods], four rats (three males and one female) showed signs of distress, prolonged apneas and gasps within the first minute of exposure. The experiments were therefore stopped and data recorded at 12% (for rats and mice) are not presented–with the exception of rectal temperature. All mice supported exposure to 12% O2without signs of distress, apneas or gasps.
pO2,satandfH
pO2,satwas higher in mice than in rats upon exposure to sea level
PIO2(32% O2) and in moderate hypoxia (18% O2; Fig. 7A).fH List of symbols and abbreviations
Epo erythropoietin
fH heart rate
fR respiratory frequency
FIO2 inspired O2fraction
HIF hypoxic inducible factor
Lm mean linear intercept
LV left ventricle
PIO2 partial pressure of inspired O2
PO2 partial pressure of O2
pO2,sat pulse oxymetry O2saturation
RV right ventricle
S cardiac septum
V˙CO2 CO2production rate
V˙E minute ventilation
V˙O2 O2consumption rate
VT tidal volume
Rats Mice
60 70 80 90
Rats Mice
0 200 400 600 800
Rats Mice
0 1000 2000
Rats Mice
0 20 40 60 80
Rats Mice
0 5 10 15 20 25
********
********
****
****
‡********
A
C
D
E
F
Rats Mice
0 20 40 60
80 Males
Females
B
********
pO2
,sat
(%)
R
V
/L
V mass (%)
fH
(beats min
⫺
1)
fH
(beats min
⫺
1 g
0.25
)
Hct (%)
Hb (g dl
⫺
1)
‡‡‡‡ ‡‡‡‡
‡‡‡‡
Rats Mice
60 70 80 90
Rats Mice
0 200 400 600 800
Rats Mice
0 1000 2000
Rats Mice
0 20 40 60 80
Rats Mice
0 5 10 15 20 25
********
********
****
****
‡********
A
C
D
E
F
Rats Mice
0 20 40 60
80 Males
Females
B
********
pO2
,sat
(%)
R
V
/L
V mass (%)
fH
(beats min
⫺
1)
fH
(beats min
⫺
1 g
0.25
)
Hct (%)
Hb (g dl
⫺
1)
‡‡‡‡ ‡‡‡‡
[image:2.612.52.300.61.241.2]‡‡‡‡
Fig. 1. Hematological variables, right ventricular hypertrophy, heart rate and arterial saturation in high altitude rats and mice.(A) Arterial O2
saturation (pO2,sat), (B) right-to-left ventricle (RV/LV) mass ratio, (C) heart rate
(fH), (D) mass-correctedfH, (E) hematocrit (Hct) and (F) hemoglobin (Hb) in
2 month old male and female rats and mice living at high altitude for 30 generations. Values are means+s.e.m. ****P<0.0001 mice versus rats;
‡P<0.05 and‡‡‡‡P<0.0001 females versus males.
The
Journal
of
Experimental
[image:2.612.52.302.417.666.2]declined in rats when exposed to sea level PIO2, but remained unchanged upon hypoxic exposure (Fig. 7B). In mice,fHremained unchanged when exposed to sea levelPIO2, slightly declined upon hypoxic exposure to 18% O2, and returned to baseline levels at 15% O2(Fig. 7B).
V˙E,VT,fRand metabolic rate
Exposure to sea levelPIO2reducedV˙Eto a similar extent in mice and rats (Fig. 8A); however, rats had a more pronounced decline ofVT than mice (Fig. 8B), and contrastingly mice had a more marked decline offRthan rats (Fig. 8C). Under moderate hypoxia (18%),VT was higher in mice than in rats (the apparent drop ofVTat 18% O2 versus 21% O2in rats is not significant.
In response to sea levelPIO2, there was no change of metabolic rate in either species (Fig. 9), but upon hypoxic exposure metabolic rate decreased in mice but not in rats: at 15% O2,V˙O2andV˙CO2had fallen by more than 30% in mice (Fig. 9A,B). Similarly, rectal temperature fell by about 2°C in mice (from 35.2±0.2°C to 33.1± 0.2°C), but remained unchanged in rats (Fig. 9C).
[image:3.612.49.565.70.215.2]Under hypoxic conditions, rats did not increasedV˙Eand maintained their metabolic rate at the baseline level, while in mice metabolic rate fell during hypoxic exposure. To find out whether this pattern in rats was achieved by increasing O2extraction from pulmonary gas, we calculated the percentage of O2extraction (O2consumption/V˙E×FIO2; Fig. 10A,B). There was a significant effect of species for this parameter (P=0.05) and a significant species×hypoxia interaction (P=0.0009). In Table 1. Comparison between values obtained at sea level and high altitude for selected variables in adult (3 months old) male rats or mice
Rats Mice
Sea level High altitude Sea level High altitude
Body mass (g) 333±21 232±9 27.3±0.8 13.7±0.9
Rectal temperature (°C) 36.8±0.2 35.2±0.2 35.6±0.3 35.2±0.2
Hematocrit (%) 41.2–47.3a 60.5±1.1 39.0–42.5b 47.0±1.7
Hemoglobin (g ml−1) 14.4–16.0a 20.4±0.3 14.3–15.2b 11.6±1.0
RV/(LV+S) (%) 27.9±0.6c 59.7±5.6 ∼20d 32.0±2.0
Heart rate (beats min−1) 250–400e 503±4 500–700f 669±23
Lung volume (×102ml g−1) 2.4±0.2 2.6±0.1 2.7±0.2 7.6±0.4
Lung mass (×102g g−1) 0.29±0.01 0.44±0.02 0.49±0.01 1.06±0.05
Total alveolar surface area (×102m2g–0.88) 0.99±0.05 0.87±0.04 1.04±0.13 3.41±0.34
O2consumption rate (ml min−1g–0.76) 0.144±0.003 0.064±0.001 0.149±0.01 0.109±0.006
Total alveolar surface area to O2consumption
ratio (m2ml−1min−1)
∼0.10 0.30±0.03 ∼0.11 0.47±0.05
Values are ranges (minimum–maximum) or means±s.e.m. All high altitude values are those obtained in the present study. Sea level values are unpublished data
from our colony of Sprague–Dawley rats and FVB mice or are from the following references:a(Sharp and La Regina, 1998),bhttp://www.informatics.jax.org/
mgihome/other/mouse_facts1.shtml,c(Lumbroso and Joseph, 2009),d(Ciuclan et al., 2011),e(Giknis and Clifford, 2006),f(Sebastian et al., 2013).
RV, right ventricle; LV, left ventricle; S, cardiac septum.
Rats Mice Rats Mice
0 2 4 6 8
Rats Mice
0 0.5 1.0 1.5
0 0.05 0.10 0.15
Rats Mice Rats Mice
0 2 4 6
0 0.05 0.10 0.15
Males
Females
A
D
C
E
B
VO2(ml min
⫺
1 100 g
⫺
1)
VO2
(ml min
⫺
1 g
⫺
0.76
)
•
VCO
2
(ml min
⫺
1 100 g
⫺
1)
• •
VCO
2
/
VO
2
• •
VCO
2
(ml min
g
⫺
0.76
)
•
****
****
***
****
****
********
**
*
*
Fig. 3. Metabolic variables under baseline conditions (21% O2) in high
altitude rats and mice.(A,C) O2consumption rate (V˙O2) and (B,D) CO2
production rate (V˙CO2) in 2 month old rats and mice. A and B are mass-specific
values; C and D are mass-corrected values. (E) Respiratory exchange ratio
(V˙CO2/V˙O2). Means+s.e.m. *P<0.05, **P<0.01, ***P<0.001 and ****P<0.0001
mice versus rats.
Rats Mice
0 100 200 300 400
Rats Mice
0 1 2 3
Rats Mice
0 200 400 600 800 1000
***
****
********
Rats Mice
0 200 400 600 800 1000
Rats Mice
0 0.01 0.02 0.03
Rats Mice
0 5 10 15 20
Males
Females
****
C
A
E
D
F
B
**
*
*
VT
(ml 100 g
⫺
1)
fR
(breaths min
⫺
1)
VE
(ml min
⫺
1 g
⫺
0.8
)
VT
(ml g
⫺
1.04
)
fR
(breaths min
⫺
1 g
0.25
)
‡‡
‡‡
***
‡‡
‡
‡‡
VE
(ml min
⫺
1 100 g
⫺
1)
[image:3.612.52.297.428.675.2]• •
Fig. 2. Ventilatory variables under baseline conditions (21% O2) in high
altitude rats and mice.(A,D) Minute ventilation (V˙E), (B,E) tidal volume (VT)
and (C,F) respiratory frequency (fR) in 2 month old rats and mice. A and B are
mass-specific values; D–F are mass-corrected values; means+s.e.m.
*P<0.05, **P<0.01, ***P<0.001 and ****P<0.0001 mice versus rats.‡P<0.05
and‡‡P<0.01 females versus males.
The
Journal
of
Experimental
[image:3.612.319.559.433.675.2]male rats, O2 extraction increased in hypoxia (18% and 15% O2) compared with 32% O2, while it remained unchanged in male mice (Fig. 10A). Female mice had a lower O2extraction value in hypoxia than female rats (Fig. 10B), because mass-specificV˙E(Fig. 10C,D;
P=0.002 for sex,P=0.004 for sex×species) andVT(not shown) were higher in female mice than in male mice throughout the hypoxic exposure, while there was no effect of sex for mass-specific
V˙O2(Fig. 10E,F).
DISCUSSION
We compared physiological responses in laboratory rats and mice that have been raised at 3600 m above sea level for about 30 generations. The key differences between these two species include higher erythrocytosis and elevated right ventricular hypertrophy (a sign of higher pulmonary hypertension) in rats compared with mice, and lower mass-corrected lung volume, alveolar surface area,
VTandV˙O2in rats compared with mice. However, rats and mice had similar levels ofpO2,sat.
The relevance of performing comparative studies between two species as an approach to understanding adaptive processes to a given environmental condition has been questioned (Garland and Adolph, 1994). In line with the limitations of this approach, this study was not designed to draw conclusions on genetic adaptation to altitude, but rather to illustrate physiological differences at altitude between two species that are known to have a different altitudinal range of distribution. As such, our results provide a relevant model of divergent physiological responses at high altitude, and might help to explain ecological reports suggesting that mice are more frequently found under natural conditions at high altitude than rats (Anderson, 1997; Innes, 2005; Storz et al., 2007).
To illustrate how rats and mice might differ in their responses to high altitude hypoxia, Table 1 presents a series of data obtained
from the present high altitude study and from other studies at sea level, including some data obtained in our sea level laboratory in Sprague–Dawley rats and FVB mice (all adult males of similar age to the high altitude animals).
One should, however, keep in mind that we have not been able to precisely determine the identity of the mouse species from the high altitude colony. However, as they are descendants from a provider of standard laboratory mice, they should be Mus musculus
domesticus (Yang et al., 2011), but we cannot exclude the
possibility that they have been hybridized with local species such
asMus musculus castaneus, which (withM. musculus domesticus)
have been identified among wild-caught mice in La Paz (Storz et al., 2007). Nevertheless, it remains unclear from the literature whether these groups of mice should be considered as distinct species or subspecies ofMus musculus(for a detailed discussion,
seeMus musculusentry in Wilson and Reeder, 2005).
Right ventricular hypertrophy, excessive erythropoiesis and elevatedfHare present in high altitude rats but not in mice
In mice, the right-to-left ventricle ratio, an index of arterial pulmonary hypertension, was around 35%. While this is higher than values normally reported at sea level (around 20%; Ciuclan et al., 2011), it is much lower than the values reported in rats in our present and past (Lumbroso et al., 2012) studies. Protection against elevated pulmonary hypertension is common in species adapted to high altitude, which demonstrate thinner pulmonary vessel walls with a reduced number of muscular cells (Tucker and Rhodes, 2001). We did not perform specific analysis of the arterial wall structure in mice, but it is likely that they would also present this typical characteristic.
There was also a pronounced difference in Hct and Hb values between rats and mice, and similarpO2,satlevels. The enhanced Hct value in rats might be due to a more sensitive hypoxia-sensing system in the kidneys, which could include stabilization of the hypoxic inducible factor (HIF), expression of HIF regulatory proteins and/or synthesis of erythropoietin (Epo) (Franke et al., 2013). In addition, it is worth mentioning that the synthesis of Epo in the kidney is regulated by the glomerular filtration rate (Olsen et al., 2011) because the consumption of O2in the kidneys (a major determinant of local PO2) is tightly dependent on sodium reabsorption and glomerular filtration rate (Donnelly, 2001). Accordingly, a lower glomerular filtration rate and/or sodium reabsorption in mice compared with rats could contribute to lower Epo production and reduced Hct.
Rats Mice
0 0.02 0.04 0.06 0.08 0.10
Rats Mice
0 0.005 0.010 0.015
Males
Females
B
A
**** **
****
****
‡
Lung volume (ml g
⫺
1)
Lung mass (g g
⫺
[image:4.612.49.299.58.144.2]1)
Fig. 4. Lung morphology variables in high altitude rats and mice. (A) Mass-specific lung volume and (B) mass-specific lung mass in 2 month old rats and mice. Values are means+s.e.m. **P<0.01 and ****P<0.0001 mice
versus rats.‡P<0.05 females versus males.
Rats Mice
0 0.2 0.4 0.6
Rats Mice
0 0.01 0.02 0.03 0.04
Rats Mice
0 10 20 30
B
A
********
****
***
*
*
D
C
E
Males
Females
Lm
(
m)
Relative alveolar surface
area (m
2 cm
⫺
3 g
0.13
)
T
o
tal alveolar surface area (m
2 g
⫺
0.88
)
Fig. 5. Lung architecture variables in high altitude rats and mice.Typical image of the lung architecture obtained for rats (A) and mice (B). (C) Mean linear
intercept (Lm), (D) mass-corrected
relative alveolar surface area and (E) mass-corrected total alveolar surface area in 2 month old rats and mice. Values are means+s.e.m. Scale bars in A and B, 50 µm. *P<0.05, ***P<0.001 and ****P<0.0001 mice versus rats.
The
Journal
of
Experimental
[image:4.612.53.448.557.740.2]In male rats raised at altitude,fHwas around 500 beats min−1, whereas normal sea level values of fH are around 250– 300 beats min−1during daytime and 350–400 beats min−1during night-time (Lemmer et al., 1993). However, it is not possible from our data to elucidate whether the elevatedfHeffectively increases cardiac output or compensates for a reduced stroke volume. By comparison, while thefHreported in mice under baseline conditions (670±20 beats min−1 in males) is higher than normal sea level values at rest (500–600 beats min−1daytime), it remains within the normal range of values recorded during the active phase (night-time 600–700 beats min−1) (Sebastian et al., 2013).
Reduced metabolic rate and elevated respiratory exchange ratio in high altitude rats versus mice
Compared with mice, rats had a reducedV˙O2(either mass specific or mass corrected), which might help them to maintain thepO2,satvalue despite the reduced mass-corrected alveolar surface area of the lungs. In several vertebrate species, reduced O2consumption rate is a key strategy of adaptation to hypoxia (Bickler and Buck, 2007). Subterranean species, such as naked mole rats that live in burrows under severe hypoxic conditions, have mechanisms of tolerance to hypoxia including low metabolic rate and reduced core body temperature (Nathaniel et al., 2012). Accordingly, rats raised under chronic hypoxia for several generations might have developed cellular mechanisms to reduce O2consumption and therefore help maintain elevated values of arterialpO2,sat. However, it should be emphasized that in rats this strategy is apparently not successful and does not allow them to overcome the drastic elevation of right ventricular hypertrophy and pulmonary hypertension.
Rats showed a higher respiratory exchange ratio (V˙CO2/V˙O2) than mice. We previously reported elevated values in high altitude rats (Lumbroso et al., 2012). High values of the respiratory exchange ratio indicate that energy production is mostly accomplished by oxidation of glucose molecules, which is an effective way to optimize synthesis of ATP under low oxygen availability
(Hochachka and Somero, 2002) as glucose oxidation produces the highest ratio of ATP synthesized for each molecule of O2consumed compared with other metabolites. Interestingly, deer mice (considered as being genetically adapted to altitude) maintain low values ofV˙CO2/V˙O2and high levels of fatty acid oxidation under combined exposure to cold and hypoxic stress (Cheviron et al., 2012). This pattern probably helps to maintain elevated glycogen stores that can be used for bursts of intense exercise (‘fight or flight’ stress response). As fatty acid oxidation requires more O2 than glycolytic pathways, it should be supported by physiological adjustments of the O2transport system.
Reduced lung volume and alveolar exchange surface area in high altitude rats versus mice
Compared with mice, rats had enlarged air spaces leading to lower mass-corrected relative alveolar exchange surface area. Combined with a reduced mass-corrected lung volume, this leads to a drastic difference of the estimated mass-corrected total lung exchange surface area between rats and mice. In mammals–with a range of body mass from 10 g (bat) to >1000 kg (whale) – lung alveolar surface area in m2 is directly proportional to O
2 consumption in ml min−1, with a scaling variable of 1 (Tenney and Remmers, 1963). Therefore, the ratio of alveolar surface area to O2 consumption should be similar between two species, which is not the case when comparing rats and mice at altitude (see Fig. 6). However, if we compare the values obtained at high altitude with an estimation of expected sea level values (see Table 1), it is clear that, relative to O2 consumption, the total alveolar surface area is enhanced in rats and mice living at high altitude. Yet, while in mice this was achieved by increasing the volume of the lungs and the total alveolar surface area, in rats this is possible only becauseV˙O2is much lower at high
Rats Mice
0 0.2 0.4
0.6
**
T
o
tal alveolar surface area/
O2
consumption (m
2ml
⫺
1 min
)
Males
[image:5.612.103.247.59.162.2]Females
Fig. 6. Total alveolar surface area to O2consumption ratio in high altitude
rats and mice.Values are means+s.e.m. **P<0.01 mice versus rats.
⫺10
0
10 Rats
Mice
10 15 20 25 30 35 10 15 20 25 30 35
60 70 80 90
*
***
**
A
B
‡‡ ‡
pO2
,sat
(%)
fH
(% versus baseline)
[image:5.612.370.506.60.327.2]% Oxygen
Fig. 7. Response to changes of inspired O2in high altitude rats and mice.
(A) Arterial oxygen saturation (pO2,sat) and (B) heart rate (fH) in 2 month old rats
and mice. Values are means+s.e.m. *P<0.05, **P<0.01 and ***P<0.001 mice
versus rats.‡P<0.05 and‡‡P<0.01 versus baseline (21% O2).
⫺40
⫺20 0 20
% Oxygen
⫺30
⫺15
0
15
10 15 20 25 30 35
10 15 20 25 30 35
10 15 20 25 30 35
⫺60
⫺40
⫺20 0
20 Rats
Mice
A
B
C
****
*
***
*
‡‡ ‡
‡‡
‡‡‡‡ ‡‡‡‡
f (% versus baseline) R
V (% versus baseline) T
VE
(% versus baseline)
•
Fig. 8. Response to changes of inspired O2in high altitude rats and mice.
(A) Minute ventilation (V˙E), (B) tidal volume (VT) and (C) respiratory frequency
(fR) in 2 month old rats and mice. Values are means+s.e.m. *P<0.05,
***P<0.001, ****P<0.0001 mice versus rats.‡‡P<0.01 and‡‡‡‡P<0.0001
versus baseline (21% O2).
The
Journal
of
Experimental
[image:5.612.52.298.604.693.2]altitude than at sea level. This striking difference might be due to an ability of the lungs of mice to respond to hypoxia by increasing the gas exchange surface area, while these responses would not be present in rats, which therefore have reached a fragile equilibrium at altitude by reducingV˙O2. Of note, compared with sea level rats, high altitude rats had an increase in the mass of the lungs but not in lung volume (see Table 1), probably as a consequence of neo-angiogenesis and hypertrophy of lung vessels.
Respiratory and metabolic responses to hypoxia in high altitude rats and mice
Chemoreflex function maintains adequate ventilation under chronic hypoxia, and is an important contributor to efficient adaptation to hypoxia (Dempsey et al., 2014; Joseph and Pequignot, 2009). At high altitude, a relevant approach to evaluate the basal activity of the peripheral chemoreceptors is to relieve the chronic hypoxic stimulus, which in the present study was achieved by exposure to sea levelPO2. Rats and mice showed a similar decrease ofV˙Ein response to sea level
PO2, suggesting similar sensibility of peripheral chemoreceptors to hypoxia, but this was achieved by a different pattern of response with a higher decrease offRbeing observed in mice compared with rats, and a decrease ofVTin rats but not in mice. This is a striking difference if we take into account that under baseline conditions theVTof rats (either mass specific or mass corrected) is already smaller compared with that of mice. Hence, the chemoreflex drive in rats increases theVT, which probably helps to maintain an elevatedpO2,satby optimizing ventilation of the lungs. Such differences between rats and mice probably arise from different neurochemical processes within the central respiratory pathways leading to differential translation of the peripheral chemoreceptor inputs into phrenic nerve activity. It is intriguing to report that HIF and HIF target genes appear to be key elements in the
plasticity of the respiratory control system under chronic hypoxia (Kline et al., 2002; Pascual et al., 2001; Powell and Fu, 2008; Prabhakar and Semenza, 2012; Soliz et al., 2007); accordingly, species differences might be related to differential control of HIF or HIF-regulating proteins in rats compared with mice.
It is also noteworthy that mice are able to reduce metabolic rate and rectal temperature in response to hypoxia, while this response is not present in rats. This response is typically seen as being protective and contributes to the preservation of arterial oxygen pressure in hypoxia. This is an active process resulting from a reduction of the thermoregulatory set point, regulated within the preoptic hypothalamic nucleus (Barros et al., 2001; Steiner et al., 2002). It is possible to ask whether the drop in rectal temperature accounted for the fall in metabolic rate or whether is there evidence of metabolic suppression beyond that due to a resetting of the body temperature set point (Barros et al., 2001). We used a web-based calculator (www. physiologyweb.com/calculators/q10_calculator.html) and calculated that in mice, O2 consumption would drop from 5.82 to 4.62 ml min−1100 g−1with a drop of rectal temperature from 35.2 to 33.1°C and aQ10of 3. As O2consumption was below these values, there is indeed evidence of metabolic suppression beyond that due to a resetting of the body temperature set point. The excess metabolic suppression is 1.37 ml O2min−1100 g−1–almost 1/4 of the basal O2 consumption of mice. The fact that this response is present in mice but not in rats indicates that mice are able to display protective responses to counteract further reduction of O2level, which is clearly another advantage at high altitude.
The highfHobserved in rats might also explain the fact that several rats were not able to withstand hypoxic exposure at 12% O2. At the
10 15 20 25 30 35
10
10 15 20 25
15 20 25 30 35
⫺40
⫺20 0
20 RatsMice
⫺40
⫺20 0 20
**
**
***
****
32 33 34 35 36
% Oxygen
C
A
B
VO2(% versus baseline)
•
VCO
2
(% versus baseline)
•
Tb
(
°
C)
‡‡‡‡
‡‡‡‡
[image:6.612.319.561.56.332.2]‡‡‡‡ ‡‡
Fig. 9. Response to changes of inspired O2in high altitude rats and mice.
(A) O2consumption (V˙O2), (B) CO2production rate (V˙CO2) and (C) rectal
temperature (body temperature,Tb) in 2 month old rats and mice. Values are
means+s.e.m. **P<0.01, ***P<0.001 and ****P<0.0001 mice versus rats. ‡‡P<0.01 and‡‡‡‡P<0.0001 versus baseline (21% O
2).
10 15 20 25 30 35
0 400 800
10 15 20 25 30 35
0 5 10
% O
2
extraction
Rats
Mice
10 15 20 25 30 35
0 5 10
Rats Mice
*
* ***
10 15 20 25 30 35
0 2 4 6 8
10 15 20 25 30 35
0 2 4 6 8
% Oxygen
10 15 20 25 30 35
0 400 800
Males Females
*
****
****
****
****
****
***
***
§§§§ §§§§A
B
F
E
C
D
‡
‡‡‡‡ ‡‡‡‡
‡‡‡‡ ‡‡‡‡
VE
(ml min
⫺
1 100 g
⫺
1)
•
VO2
(ml min
⫺
1 100 g
⫺
1)
[image:6.612.112.242.59.331.2]•
Fig. 10. Responses to changes of inspired O2in high altitude rats and
mice.(A,B) Percentage O2extraction, (C,D) minute ventilation (V˙E) and
(E,F) mass-specific O2consumption rate (V˙O2) in 2 month old male and female
rats and mice. Values are means+s.e.m.§P<0.05 and§§§§P<0.0001 females
versus males. *P<0.05, ***P<0.001 and ****P<0.0001 mice versus rats. ‡P<0.05 and‡‡‡‡P<0.0001 versus baseline (21% O
2); in A,‡P<0.05 versus
32% O2.
The
Journal
of
Experimental
altitude of La Paz, this O2 level corresponds to an inspiredPO2of 60 mmHg (or 7.8% O2in inspired air at sea level), a severe level of hypoxia that could be close to the minimum O2level necessary to maintain the function of the heart under already challenging conditions.
Sex-specific effects in high altitude rats and mice
Females of both species showed lower Hct values than males, probably reflecting the inhibitory effect of estradiol on Epo synthesis (Mukundan et al., 2002). However, sex-specific effects on respiratory parameters were mostly present in mice, with females mice showing higher VT and V˙E than male mice (either mass-specific or mass-corrected data). In rats, females had lower mass-correctedfRthan males, butVTandV˙Ewere similar (either mass-specific or mass-corrected data). Higher values ofV˙EandVT in females compared with males likely reflects the respiratory stimulant effect of ovarian steroids (Joseph et al., 2002), and have been reported in our previous studies (Lumbroso et al., 2012). The fact that sex-specific effects were not reported in the present study in rats might be related to the reduced sample size (six males, six females), while we compared 17 males with 16 females in our previous study (Lumbroso et al., 2012).
Conclusions
We conclude that adult laboratory rats and mice that have been raised for a similar period of time under conditions of chronic hypoxia at high altitude display divergent physiological responses. Interestingly, a previous genetic study showed that there is no adaptive modification of the Hb function in wild M. musculus
caught in La Paz compared with other specimens at sea level (Lima, Peru) (Storz et al., 2007); therefore, it is tempting to speculate that the physiological responses observed in mice that have been bred in La Paz might explain the ability of this species to successfully withstand the high altitude hypoxic environment.
MATERIALS AND METHODS Animals
We used adult (2–3 months old) male and female rats (six animals of each sex) and mice (10 animals of each sex) from different colonies. Mice were obtained from the Instituto Nacional de Laboratorios de Salud (INLASA, La Paz, Bolivia). These mice are descendants of a lineage of animals that were originally imported from France (IFFA-CREDO) 20–25 years ago. Because the genetic background of the mice was not available, we performed a complete genetic analysis on a sample of DNA extracted from the lungs of an adult male mouse, by using the background characterization offered by Charles River (St Constant, Québec, Canada). This analysis compares allele variations of 384 single-nucleotide polymorphisms of the unknown DNA with the DNA of 40 common inbred and F1 hybrid strains. The analysis indicated that the mice scored as 73.11% FVB, and that they are either a mix of FVB and two other strains, or an outbred strain.
Rats were Sprague–Dawley from the Instituto Boliviano de Biologa de Altura (IBBA, La Paz, Bolivia). These animals were originally imported from France (IFFA-CREDO) in 1992, and constantly bred at the IBBA (for the present study, we used rats from the 30th generation).
Animals were housed under standard conditions, had access to food and waterad libitum, and were exposed to a 12 h:12 h light:dark cycle. After they were transported from INLASA to the IBBA, mice were left undisturbed for 1 week before starting the experiments. All protocols were reviewed and approved by the scientific committee of IBBA in Bolivia and are in concordance with the guidelines of the Canadian Council of Animal Care.
Recording of ventilatory parameters, arterialpO2,satandfHin unrestrained, unanesthetized rats and mice at high altitude
The animals were placed in a whole-body flow-through plethysmograph chamber for mice or rats (Emka Technologies, Paris, France) that was
constantly flushed with fresh room air and previously calibrated by injecting a known volume of air (0.5 ml for mice, 5 ml for rats). The respiratory flow trace was recorded using a differential pressure transducer (ML141, ADInstruments, Colorado Springs, CO, USA). The flow of air through the chamber was set and continuously monitored at 200 ml min−1(mice) or 1500 ml min−1(rats) using a pump and gas flow restrictor/monitor (G265, Qubit systems, Kingston, ON, Canada). Inlet and outlet gases were alternately subsampled, directed toward a water pressure analyzer (RH-300, Sable Systems, Las Vegas, NV, USA), dried and directed to an oxygen/ carbon dioxide analyzer (ML206 Gas Analyzer, ADInstruments) for respiratory gas analysis. All signals were directed toward a PowerLab acquisition interface for analog-to-digital conversion and storage on a computer running LabChart 5 software (ADInstruments).
Before each experiment, rectal temperature was measured, and the animal was weighed and then fitted with a limb sensor for continuous recordings of pulse oximetry capillary oxygen saturation (pO2,sat) andfH(MouseSTAT,
Kent Scientific, Torrington, CT, USA). The animal was then placed in the chamber for a period of acclimation (10–15 min), and baseline recordings were initiated for 20 min, followed by acute exposure to 32% O2 – corresponding to sea levelPO2–for 10 min. The animal was then exposed to
graded levels of hypoxia (18%, 15% and 12% O2for 10 min each). The mean barometric pressure in La Paz being around 490 mmHg, these percentage O2values correspond, respectively, to a PIO2 of 90, 75 and
60 mmHg. At sea level (barometric pressure 760 mmHg), thesePIO2values
would be equivalent to 12%, 10% and 8% O2in inspired air, respectively. Rectal temperature was measured immediately at the end of the last hypoxic exposure.VTwas calculated from the integrated flow trace as previously described (Lumbroso and Joseph, 2009; Lumbroso et al., 2012), by using standard equations (Bartlett and Tenney, 1970). All values were obtained while the animal had a stable breathing pattern during baseline recordings and within the last 3 min of each condition.
Oxygen consumption (V˙O2) and CO2 production (V˙CO2) rates were
calculated using the following equations (Lighton, 2008):
_
VO2¼
Flow ½ðO2;inO2;outÞ O2;out ðCO2;outCO2;inÞ
1O2;out ; ð
1Þ
_
VCO2 ¼Flow
½ðCO2;outCO2;inÞ CO2;out ðO2;inO2;outÞ
1CO2;out ; ð
2Þ
where‘Flow’is the flow of air measured before entry into the chamber,
‘O2,in’and‘CO2,in’are the gas fractions in the inflowing air (considered at 20.9% and 0.038%, respectively), and O2,out and CO2,out are the gas fractions measured in the outflowing line. The respiratory exchange ratio was calculated as CO2production/O2consumption.
Hematological parameters, and dissection of hearts and lungs
A sample of blood was drawn from the tail. Hct was measured by microcentrifugation (Micro-MB centrifuge, International Equipment Company, USA) for 15–20 min, and Hb concentration was determined by using a Hemocue field spectrophotometer (Agelholm, Sweden). All samples were processed in duplicate for rats, and for mice if enough blood was obtained.
Following blood sampling, animals were anesthetized by an
intraperitoneal injection (0.1 ml 100 g−1 of body mass) of ketamine (87.5 mg ml−1) and xylazine (12.5 mg ml−1) then perfused through the left ventricle with ice-cold PBS ( pH 7.2) at a constant pressure of 24 cmH2O for mice and 35 cmH2O for rats. The heart was quickly dissected and weighed. The atria were separated from the ventricles, then the right ventricle (RV) was cut from the left ventricle (LV, which was left with the cardiac septum, S). We weighed the ventricles separately (RV and LV+S) and these values were used to measure the ratio RV/(LV+S), an index of right ventricular hypertrophy and pulmonary hypertension. In four males and four females of each species, after cardiac perfusion with PBS, a catheter was fixed in the trachea, and the lungs were inflated with 4% PFA for 30 min at a constant pressure of 2.3 kPa (or 24 cmH2O), then dissected. The total volume of the inflated lungs was measured by liquid displacement, and they were kept in 4% PFA for 24 h at room temperature. The next day, the lungs were separated into left and right lung (for mice) and five lobes (for rats), which were dehydrated in alcohol (1 h in 65% alcohol solution, then 2 h in
The
Journal
of
Experimental
each graded alcohol solution: 75%, 85%, 95% and 100%); alcohol was then replaced by xylol (two baths, 1 h each), and paraffin (two baths, 1 h each and a final overnight bath). The samples were embedded in paraffin and shipped to Québec city where they were processed to determine lung histology.
Lung histology
Paraffin-embedded lungs were cut at a thickness of 5μm using a microtome (Jung RM2065 Leica Instruments GmbH, Germany). Sections were then mounted on glass slides and dried for 24 h in room air. Slices were deparaffinized in toluene baths (2×10 min), and re-hydrated by successive immersion in alcohol [100% (×2), 95%, 70%, 50%] and in water before being colored with Harris Hematoxylin solution (VWR International) for 3 min, rinsed in water for 1 min, exposed in acid–alcohol solution (five successive immersions in 1% HCl, 70% ethanol), washed with water for 1 min, dipped in Bluing Reactive RTU (VWR International) and then in water for 1 min. The slides were mounted in water-based mounting medium (Liquid Coverglass SHUR/Mount™, EMS, Hatfield, PA, USA). Images were captured using a Nikon eclipse E600 digital imaging system at a magnification of ×100.
Lung morphology
We randomly selected three non-overlapping images from each slide using three slides per animal and eight animals per group (four males and four females). The mean linear intercept (Lm) was determined by overlapping a grid of 20 horizontal and vertical lines (189 µm each) on each image and by counting the number of intersections with alveolar walls (Hsia et al., 2010). When a line crossed a vessel wall rather than an alveolar wall, it was counted as 0.5 intersection.Lmwas calculated by using the following equation:Lm=(Nd)/m, withNbeing the number of lines (20),dthe length of each line (189 µm) and m the number of intersections with alveolar walls. FromLmvalues, we calculated the relative alveolar surface area asS (m2cm−3)=4V/L
m, withVbeing the volume of one image (Hsia et al., 2010). An estimation of the total alveolar surface area was calculated as the product of the relative alveolar surface area and lung volume (measured by water displacement after fixation).
Allometric scaling in rats and mice
To compare physiological and morphological values between control mice and rats, we used allometric scaling, a standard approach to compare animals of different size (Maina et al., 1989; Stahl, 1967). The allometric scaling variables (bin the equation below) were obtained by calculating the slope of a regression line fitted through a log–log plot of a parameter (x) as a function of body mass (M). To obtain an equation of the following form:x=aMb. From this equation, we reported mass-specific variables withMb. For the respiratory variables, we used the scaling variable calculated by Stahl (1967), which are: lung mass and lung volume,b=1;V˙E,b=0.8;VT,b=1.04;
fR andfH,b=−0.25; O2consumption and CO2production,b=0.76). For relative and total alveolar surface area, we respectively usedb=−0.13 and
b=0.88 as reported for mammals by Maina et al. (1989). In the text, data corrected for the allometric scaling variables are referred to as mass corrected whereas data compared for body mass are referred to as mass specific.
Sea level values
Expected sea level values for a selected series of variables are presented in Table 1. These values were either selected from the literature or were obtained from our colony of sea level Sprague–Dawley rats and FVB mice (A.J.-L. and V.J., unpublished results). Values of lung morphology were obtained by using the approach described above. These values are mostly informative, and we have not made statistical analysis to compare high altitude versus sea level values.
Statistical analysis
We used GraphPad Prism 6.0c (for 2-way ANOVA andpost hocanalysis) and JMP 11.0 (for 2-way ANOVA with repeated measures) for statistical analysis. All values are reported as means±s.e.m., and the significant
P-value was set a 0.05.
For the Hct, right ventricular hypertrophy and lung morphology data, we first performed 2-way ANOVA with species and sex as grouping variables. When significant effects or a significant interaction between species and sex appeared, apost hocanalysis was performed (Fisher’s LSD).
For variables measured at different levels ofPIO2we used a MANOVA
model (in JMP) with species and sex as grouping variables andPIO2as the
repeated term. When no significant effect of sex, or significant interactions between sex and species or sex andPIO2appeared for these values, data from
males and females were pooled. When significant species effects appeared, apost hocanalysis was performed for eachPIO2level (Fisher’s LSD) to
determine the effects of species, or for each group to determine the effects of
PIO2level.P-values are reported in the figures with the following general
pattern: *P<0.05, **P<0.01, ***P<0.001 and ****P<0.0001, respectively.
Acknowledgements
The authors acknowledge Carlos Salinas [Director, Bolivian Institute for Altitude Biology (IBBA)] for effective help in Bolivia. The authors acknowledge Dr J. Soliz for careful reading of the manuscript and fruitful discussions.
Competing interests
The authors declare no competing or financial interests.
Author contributions
V.J., M.G., R.S. and A.J.-L. developed the concepts and designed the experiments. A.J.-L., G.V., M.G. and I.V. performed the experiments. A.J.-L. and V.J. analyzed the data and prepared the figures. V.J. and A.J.-L. prepared or edited the manuscript prior to submission.
Funding
This study was funded by the Natural Sciences and Engineering Research Council of Canada (grant no. RGPGP-2009-26139 and RGPGP-2014-00083). A.J.-L. is supported by a training grant in respiratory physiology from Réseau en Santé Réspiratoire (Fonds de Recherche du Québec–Santé, and Canadian Institute for Health Research).
References
Anderson, S.(1997).Mammals of Bolivia: Taxonomy and Distribution. Bulletin of
the American Museum of Natural History no. 231. New York: AMNH. http://hdl. handle.net/2246/1620
Barros, R. C., Zimmer, M. E., Branco, L. G. and Milsom, W. K.(2001). Hypoxic
metabolic response of the golden-mantled ground squirrel.J. Appl. Physiol.91, 603-612.
Bartlett, D., Jr and Tenney, S. M.(1970). Control of breathing in experimental
anemia.Respir. Physiol.10, 384-395.
Bickler, P. E. and Buck, L. T.(2007). Hypoxia tolerance in reptiles, amphibians, and
fishes: life with variable oxygen availability.Annu. Rev. Physiol.69, 145-170.
Cheviron, Z. A., Bachman, G. C., Connaty, A. D., McClelland, G. B. and
Storz, J. F. (2012). Regulatory changes contribute to the adaptive
enhancement of thermogenic capacity in high-altitude deer mice.Proc. Natl. Acad. Sci. USA109, 8635-8640.
Ciuclan, L., Bonneau, O., Hussey, M., Duggan, N., Holmes, A. M., Good, R.,
Stringer, R., Jones, P., Morrell, N. W., Jarai, G. et al.(2011). A novel murine
model of severe pulmonary arterial hypertension.Am. J. Respir. Crit. Care. Med. 184, 1171-1182.
Dempsey, J. A., Powell, F. L., Bisgard, G. E., Blain, G. M., Poulin, M. J. and
Smith, C. A.(2014). Role of chemoreception in cardiorespiratory acclimatization
to, and deacclimatization from, hypoxia.J. Appl. Physiol.116, 858-866.
Donnelly, S.(2001). Why is erythropoietin made in the kidney? The kidney functions
as a critmeter.Am. J. Kidney Dis.38, 415-425.
Franke, K., Gassmann, M. and Wielockx, B.(2013). Erythrocytosis: the HIF
pathway in control.Blood122, 1122-1128.
Garland, T., Jr and Adolph, S. C.(1994). Why not to do two-species comparative
studies: limitations on inferring adaptation.Physiol. Zool.67, 797-828.
Giknis, M. and Clifford, C.(2006).Clinical Laboratory Parameters for Crl: CD (SD)
Rats, pp. 1-14. Wilmington, MA: Charles River Laboratories.
Hochachka, P. W. and Somero, G. N.(2002). Cellular mechanism, regulation, and
homeostasis. In Biochemical Adaptation: Mechanism and Process in Physiological Evolution, pp. 20-100. Oxford, UK: Oxford University Press.
Hsia, C. C. W., Hyde, D. M., Ochs, M., Weibel, E. R. and ATS/ERS Joint Task
Force on the Quantitative Assessment of Lung Structure. (2010). An official
research policy statement of the American Thoracic Society/European Respiratory Society: standards for quantitative assessment of lung structure.
Am. J. Respir. Crit. Care Med.181, 394-418.
Innes, J. G.(2005). Norway rat - ship rat. InThe Handbook of New Zealand
Mammals(ed. C. M. King), pp. 174-203. Melbourne: Oxford University Press.
The
Journal
of
Experimental
Joseph, V. and Pequignot, J.-M.(2009). Breathing at high altitude.Cell. Mol. Life Sci.66, 3565-3573.
Joseph, V., Soliz, J., Soria, R., Pequignot, J., Favier, R., Spielvogel, H. and
Pequignot, J. M.(2002). Dopaminergic metabolism in carotid bodies and high
altitude acclimatization in female rats.Am. J. Physiol.282, R765-R773.
Kline, D. D., Peng, Y.-J., Manalo, D. J., Semenza, G. L. and Prabhakar, N. R.
(2002). Defective carotid body function and impaired ventilatory responses to chronic hypoxia in mice partially deficient for hypoxia-inducible factor 1 alpha.
Proc. Natl. Acad. Sci. USA99, 821-826.
Lemmer, B., Mattes, A., Bohm, M. and Ganten, D.(1993). Circadian blood
pressure variation in transgenic hypertensive rats.Hypertension22, 97-101.
Lighton, J. R. B. (2008). Flow-through respirometry using incurrent flow
measurments. In Measuring Metabolic Rate: A Manual for Scientists, pp. 105-131. New York: Oxford University Press; Inc.
Lumbroso, D. and Joseph, V.(2009). Impaired acclimatization to chronic hypoxia
in adult male and female rats following neonatal hypoxia.Am. J. Physiol. Regul. Integr. Comp. Physiol.297, R421-R427.
Lumbroso, D., Lemoine, A., Gonzales, M., Villalpando, G., Seaborn, T. and
Joseph, V.(2012). Life-long consequences of postnatal normoxia exposure in
rats raised at high altitude.J. Appl. Physiol.112, 33-41.
Maina, J. N., King, A. S. and Settle, G.(1989). An allometric study of pulmonary
morphometric parameters in birds, with mammalian comparisons. Philos. Trans. R. Soc. Lond. B Biol. Sci.326, 1-57.
Monge, C. and Leon-Velarde, F.(1991). Physiological adaptation to high altitude:
oxygen transport in mammals and birds.Physiol. Rev.71, 1135-1172.
Mukundan, H., Resta, T. C. and Kanagy, N. L.(2002). 17Beta-estradiol decreases
hypoxic induction of erythropoietin gene expression.Am. J. Physiol. Regul. Integr. Comp. Physiol.283, R496-R504.
Naeije, R. and Manes, A. (2014). The right ventricle in pulmonary arterial
hypertension.Eur. Respir. Rev.23, 476-487.
Nathaniel, T. I., Otukonyong, E., Abdellatif, A. and Soyinka, J. O.(2012). Effect of
hypoxia on metabolic rate, core body temperature, and c-fos expression in the naked mole rat.Int. J. Dev. Neurosci.30, 539-544.
Olsen, N. V., Aachmann-Andersen, N.-J., Oturai, P., Munch-Andersen, T., Bornø, A., Hulston, C., Holstein-Rathlou, N.-H., Robach, P. and Lundby, C.
(2011). Erythropoietin down-regulates proximal renal tubular reabsorption and causes a fall in glomerular filtration rate in humans.J. Physiol.589, 1273-1281.
Pascual, O., Denavit-Saubie, M., Dumas, S., Kietzmann, T., Ghilini, G., Mallet, J.
and Pequignot, J.-M.(2001). Selective cardiorespiratory and catecholaminergic
areas express the hypoxia-inducible factor-1alpha (HIF-1alpha) under in vivo hypoxia in rat brainstem.Eur. J. Neurosci.14, 1981-1991.
Pichon, A., Zhenzhong, B., Marchant, D., Jin, G., Voituron, N., Haixia, Y., Favret,
F., Richalet, J.-P. and Ge, R.-L.(2013). Cardiac adaptation to high altitude in the
plateau pika (Ochotona curzoniae).Physiol. Rep.1, e00032.
Powell, F. L. and Fu, Z.(2008). HIF-1 and ventilatory acclimatization to chronic
hypoxia.Respir. Physiol. Neurobiol.164, 282-287.
Prabhakar, N. R. and Semenza, G. L. (2012). Adaptive and maladaptive
cardiorespiratory responses to continuous and intermittent hypoxia mediated by hypoxia-inducible factors 1 and 2.Physiol. Rev.92, 967-1003.
Qi, X. Z., Wang, X. J., Zhu, S. H., Rao, X. F., Wei, L. and Wei, D. B.(2008). [Hypoxic
adaptation of the hearts of plateau zokor (Myospalax baileyi) and plateau pika (Ochotona curzoniae)].Sheng Li Xue Bao60, 348-354.
Sebastian, S., Ang, R., Abramowitz, J., Weinstein, L. S., Chen, M., Ludwig, A.,
Birnbaumer, L. and Tinker, A.(2013). The in vivo regulation of heart rate in the
murine sinoatrial node by stimulatory and inhibitory heterotrimeric G proteins.
Am. J. Physiol. Regul. Integr. Comp. Physiol.305, R435-R442.
Sharp, P. and La Regina, M.(1998).The Laboratory Rat. Boca Raton, FL: CRC
Press.
Soliz, J., Gassmann, M. and Joseph, V.(2007). Soluble erythropoietin receptor is
present in the mouse brain and is required for the ventilatory acclimatization to hypoxia.J. Physiol.583, 329-336.
Stahl, W. R.(1967). Scaling of respiratory variables in mammals.J. Appl. Physiol.
22, 453-460.
Steiner, A. A., Rocha, M. J. and Branco, L. G. (2002). A neurochemical
mechanism for hypoxia-induced anapyrexia.Am. J. Physiol. Regul. Integr. Comp. Physiol.283, R1412-R1422.
Storz, J. F., Baze, M., Waite, J. L., Hoffmann, F. G., Opazo, J. C. and Hayes, J. P.
(2007). Complex signatures of selection and gene conversion in the duplicated globin genes of house mice.Genetics177, 481-500.
Storz, J. F., Runck, A. M., Sabatino, S. J., Kelly, J. K., Ferrand, N., Moriyama, H.,
Weber, R. E. and Fago, A.(2009). Evolutionary and functional insights into the
mechanism underlying high-altitude adaptation of deer mouse hemoglobin.Proc. Natl. Acad. Sci. USA106, 14450-14455.
Storz, J. F., Runck, A. M., Moriyama, H., Weber, R. E. and Fago, A.(2010a).
Genetic differences in hemoglobin function between highland and lowland deer mice.J. Exp. Biol.213, 2565-2574.
Storz, J. F., Scott, G. R. and Cheviron, Z. A.(2010b). Phenotypic plasticity and
genetic adaptation to high-altitude hypoxia in vertebrates.J. Exp. Biol.213, 4125-4136.
Tenney, S. M. and Remmers, J. E.(1963). Comparative quantitative morphology of
the mammalian lung: diffusing area.Nature197, 54-56.
Tucker, A. and Rhodes, J. (2001). Role of vascular smooth muscle in the
development of high altitude pulmonary hypertension: an interspecies evaluation.
High Alt. Med. Biol.2, 173-189.
Wilmshurst, J. M., Anderson, A. J., Higham, T. F. G. and Worthy, T. H.(2008).
Dating the late prehistoric dispersal of Polynesians to New Zealand using the commensal Pacific rat.Proc. Natl. Acad. Sci. USA105, 7676-7680.
Wilson, D. E. and Reeder, D. M. (2005).Mammal Species of the World: A
Taxonomic and Geographic Reference, 3rd edn. Baltimore: Johns Hopkins University Press. http://www.departments.bucknell.edu/biology/resources/msw3/
Yang, H., Wang, J. R., Didion, J. P., Buus, R. J., Bell, T. A., Welsh, C. E.,
Bonhomme, F., Yu, A. H.-T., Nachman, M. W., Pialek, J. et al.(2011).
Subspecific origin and haplotype diversity in the laboratory mouse.Nat. Genet.43, 648-655.
The
Journal
of
Experimental