Original Article
Quantitative RT-PCR assay of HER2 mRNA expression in
formalin-fixed and paraffin-embedded breast
cancer tissues
Sangjung Park1,2*, Hye-Young Wang3*, Sunghyun Kim1,4, Sungwoo Ahn1, Dongsup Lee8, Yoonjung Cho1, Kwang Hwa Park5, Dongju Jung6, Seung Il Kim7, Hyeyoung Lee1
1Department of Biomedical Laboratory Science, College of Health Sciences, Yonsei University, Gangwon,
Repub-lic of Korea; 2Department of Clinical Laboratory Science, College of Medical Science, Daegu Haany University,
Daegu, Republic of Korea; 3M&D, Inc., Wonju Eco Environmental Technology Center, Gangwon, Republic of Korea; 4Institute for Life Science and Biotechnology, Yonsei University, Seoul, Republic of Korea; 5Department of
Pa-thology, Wonju College of Medicine, Yonsei University, Gangwon, Republic of Korea; 6Department of Biomedical
Laboratory Science, College of Natural Sciences, Hoseo University, Chungnam, Republic of Korea; 7Department
of Surgery, Yonsei University College of Medicine, Seoul, Republic of Korea; 8Department of Clinical Laboratory
Science, Hyejeon College, Chungnam, Republic of Korea. *Equal contributors.
Received June 16, 2014; Accepted July 29, 2014; Epub September 15, 2014; Published October 1, 2014
Abstract: Detection of human epidermal growth factor receptor 2 gene (HER2, also known as erbB2) expression is a preparatory process to decide a treatment strategy for breast cancer patients. 20-30% of breast cancer patients have HER2 overexpression, and they usually show poor recovery rate. For detection of HER2 expression,
immuno-histochemistry (IHC) and fluorescence in situ hybridization (FISH) methods are conventionally used. Although these methods are accurate and reliable, their time-consuming process and high cost need a concise method with high sensitivity and accuracy. As a complementary method to the current IHC/FISH standard techniques, PCR-based methods have been developed. Here we employed a quantitative PCR method to detect HER2 expression in one
hundred ninety nine formalin-fixed and paraffin-embedded (FFPE) breast cancer tissue samples from the patients
treated over two years at the Yonsei University Severance Hospital, Republic of Korea. Relative expression of HER2 mRNA in the FFPE samples was analyzed using a quantitative RT-PCR (RT-qPCR) method and the obtained HER2 expression levels were compared with those from IHC/FISH methods. Our results show that the RT-qPCR method
was highly concordant with IHC/FISH methods for detecting HER2 expression. Overall sensitivity and specificity of
the BrightGen HER2 RT-qDx assay kit (Syantra, Calgary, Canada), which is a kit we used for RT-qPCR analyses, were 93.0% and 89.8% (P < 0.0001), respectively. The diagnostic cut-off value of HER2 RT-qDx for the clinical samples was determined by likelihood ratio, among which the highest likelihood ratio of relative HER2 mRNA levels was over
105.5 (AUC = 0.9466) with the highest sensitivity and specificity. Our study indicates that quantification of HER2
mRNA expression with the RT-qPCR could be an alternative method of conventional IHC/FISH methods.
Keywords: Breast cancer, HER2, FFPE, RT-qPCR, molecular diagnosis
Introduction
Breast cancer remains the most common and second deadliest cancer in women. In spite of the high incidence of breast cancer, the surviv-al rate of patients who have been diagnosed and treated in the initial stages is increasing [1]. The World Health Organization (WHO) esti-mates that worldwide, more than 508,000 women died in 2011 due to breast cancer. In the Republic of Korea, 13,460 new incidence
of breast cancer were reported for a year of 2010 [2].
of proto-oncogene HER2 are associated with poor prognosis and a more aggressive tumor phenotype. Thus, a HER2-positive status indi-cates a poor prognosis and shorter overall sur-vival time [5]. Patients with HER2 amplification
or over-expression are susceptible for treat-ment with trastuzumab (Herceptin, Roche, Penzberg, Upper Bavaria, Germany), which is a humanized monoclonal antibody raised against the extracellular domain of theHER2 protein.
Herceptin is currently the standard first-line
treatment toward metastatic breast cancer, and it is also indicated that therapeutic activity of Herceptin was enhanced when it applied as an adjuvant setting with other chemotherapeu-tics [6, 7]. Up to date, the HER2 status might be sole factor indicating that patients are likely to respond to Herceptin. Based on the clinical results, Herceptin was approved by the Food and Drug Administration (FDA) of U.S.A. as a therapeutic drug in 1998 for treatment of advanced breast cancer. Actually, Herceptin
consuming, expensive, difficult to screening
multiple samples in a short time, and require a
high-resolution fluorescence microscope. Moreover, these methods are difficult to stan -dardize across laboratories [12, 13]. There- fore, it is necessary to develop a precise quan-titative method to measure HER2 expression that are complementary to the IHC and FISH test.
Molecular techniques based on the quantita-tive evaluation of HER2 messenger RNA (mR- NA) have been proposed. Especially, a reverse transcription quantitative PCR (RT-qPCR) was successfully used to evaluate the expression levels of HER2 mRNA in FFPE tissue samples. In this study, we employed the RT-qPCR method using a commercial diagnostic kit called ‘BrightGen HER2 RT-qDx’ (Syantra, Calgary,
Canada), for quantification of HER2 expression
[image:2.612.92.368.74.383.2]and comparison with standard IHC and FISH
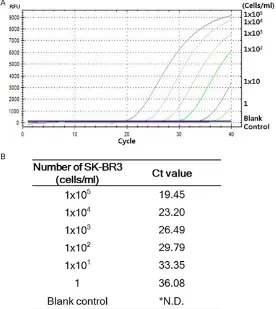
Figure 1. Analytical sensitivity of HER2 mRNA RT-qPCR. A. Analytical sensi-tivity of HER2 mRNA RT-qPCR was determined using serially diluted breast cancer HER2 over-expressing SK-BR3 cells. B. HER2 mRNA RT-qPCR was performed three times and the mean Ct value was calculated (*N.D.; Not detected).
prolonged survival time of the patients having operable HER2-positive cancer [8].
There are several reports com-pared HER2 status between in the primary tumors and in the matched metastatic regions; the results indicated that there was an acceptable level of con-cordance for HER2 expression between the two tumor regions (concordance rate = 80-94%) [9, 10]. For this reason, the HER2 test is important for targeted therapy in breast cancer pa- tients. The determination of HER2 status on primary tumor tissues is routinely performed by immunohistochemistry (IHC)
or fluorescence in situ hybridiza-tion analysis (FISH). IHC is
car-ried out on formalin-fixed paraf
-fin-embedded (FFPE) breast
can-cer tissue samples to screen HER2 status in a clinical setting [11]. When the IHC score is 2+, HER2 gene amplification is
time-methods using a total number of 199 FFPE breast cancer tissue samples.
Materials and methods
Clinical samples
A total of 199 FFPE tissue samples obtained from patients diagnosed with breast cancer at Yonsei University Severance Hospital (Seoul, Republic of Korea) for 2 years were analyzed in this study. With all patient tissues, IHC was already performed to verify expression of HER2, estrogen receptor (ER), and progesterone receptor (PR). All subjects provided written informed consent and the study was approved by the Institutional Ethics Committee of Yonsei University Severance Hospital (approval num-ber 1-2010-0018).
Cell lines and cell culture
Human breast carcinoma cell line SK-BR3, which over-expresses HER2, was obtained from the Korean Cell Line Bank (Seoul, Republic of Korea). Human breast carcinoma cell line MCF7 and MDA-MB-231, both of which weakly ex- presses HER2, were kindly provided by the Yonsei University Cancer Center (Seoul, Re- public of Korea). THP-1 human monocytic cell line, which weakly expresses HER2, was kindly provided by Yonsei University College of
100 U/mL of penicillin, and 100 μg/mL of strep -tomycin (Gibco-BRL, Carlsbad, California, USA). Deparaffinization of FFPE tissue and total RNA isolation
In order to remove paraffin from FFPE tissue
samples, two pieces of 10-µm-thick FFPE breast cancer tissue sections were put into a 1.5-mL microcentrifuge tube, to which 1 mL of 100% xylene was added. After shaking and vor-texing, the tube was heated for 5 min at 50°C
to melt the paraffin and centrifuged for 2 min at
room temperature at 20,000 x g to precipitate the tissue. After centrifugation, xylene solution was removed, and then 1 mL of 100% EtOH was added to the precipitated tissue. This tube was centrifuged at 20,000 x g for 2 min at room temperature. After that, EtOH was carefully dis-carded without disturbing the pellet. The EtOH
washing was repeated twice. In the final wash -ing, residual EtOH was removed as much as possible without disturbing the pellet, and the pellet was dried in the air for 25 min.
MagNA Pure LC RNA Isolation Kit III-Tissue (Roche Diagnostics, Mannheim and Penzberg, Germany) was used for total RNA extraction. In
brief, 140 μL of tissue homogenized buffer (Roche Diagnostics) and 16 μL of 10% SDS solution were added to the deparaffinized tis -sue, sequentially. Then, the mixed samples were vortexed and incubated overnight at 55°C,
after which 220 μL of tissue lysis buffer (Roche
Diagnostics) was added to the tissue lysate supernatant. Finally, MagNA Pure LC 2.0 (Roche Diagnostics) machine was used to purify total RNA from the tissue lysates. The purity and concentration of total RNA were determined by measuring the absorbance at 260 nm and 280
nm using the Infinite 200® spectrophotometer (Tecan, Salzburg, Austria). All steps in the prep-aration and handling of total RNA were
con-ducted in a laminar flow hood under
[image:3.612.90.363.98.176.2]RNase-free conditions. The isolated total RNA was stored at -70°C until used for cDNA synthesis.
Table 1. Relative HER2 mRNA expression levels detected by HER2 mRNA RT-qPCR in various cell lines
Cell line HER2 status Origin of cell Relative HER2 mRNA expression level SK-BR-3 Over-expressing Breast cancer 56.99 ± 7.34 MCF-7 Weak-expressing Breast cancer 5.43 ± 2.25 MDA-MB-231 Weak-expressing Breast cancer 1 THP-1 Weak-expressing Monocyte 0.7 ± 0.2
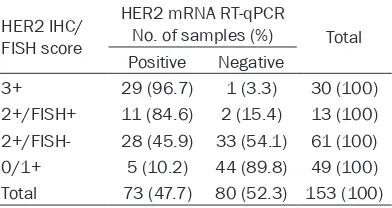
Table 2. Comparison of HER2 mRNA RT-qPCR results with HER2 IHC and FISH results HER2 IHC/
FISH score
HER2 mRNA RT-qPCR
No. of samples (%) Total Positive Negative
3+ 29 (96.7) 1 (3.3) 30 (100) 2+/FISH+ 11 (84.6) 2 (15.4) 13 (100) 2+/FISH- 28 (45.9) 33 (54.1) 61 (100) 0/1+ 5 (10.2) 44 (89.8) 49 (100) Total 73 (47.7) 80 (52.3) 153 (100)
[image:3.612.92.288.221.325.2]cDNA synthesis
Complementary DNA (cDNA) was synthesized using an M-MLV Reverse Transcriptase kit (Invitrogen, Carlsbad, CA, USA) and random hexamers (Invitrogen) according to the
manu-facturer’s recommendations. Briefly, 10 μL of
total RNA was added to the master mix
contain-ing 1 μL of 10 mM dNTP mix (10 mM each dATP,
dGTP, dCTP, and dTTP at a neutral pH), 0.25 μg
of random hexamers, and 5 μL of DEPC-treated
water in PCR tubes. The reaction mixture was incubated at 65°C for 5 min, and then quickly
chilled on ice. Subsequently, a mixture of 4 μL of 5× first-strand buffer, 2 μL of 0.1 M dithioth
-reitol (DTT), and 1 μL of M-MLV reverse tran -scriptase (RT) was added to the reaction mix-ture in PCR tubes, and the cDNA synthesis reaction was performed at 25°C for 10 min, 37°C for 50 min, and 70°C for 15 min.
HER2 mRNA RT-qPCR assay (BrightGen HER2 RT-qDx assay)
The HER2 mRNA expression level relative to GAPDH mRNA level was measured by RT-qPCR employing TaqMan probes using the CFX-96 real-time PCR system (Bio-Rad, Hercules, CA, USA), which was used for thermo-cycling and
fluorescence detection. The RT-qPCR TaqMan
assay was carried out with the BrightGen HER2 RT-qDx assay kit (Syantra) according to the manufacturer’s recommendations. Real-time
PCR amplification for HER2 mRNA was
per-formed using a total volume of 20 μL that con
-tained 10 μL of 2× Thunderbird probe qPCR mix (Toyobo, Osaka, Japan), 5 μL of primer and TaqMan probe mixture, 2 μL of template cDNA, and D.W. to give a final volume of 20 μL for each sample. Positive and negative controls were included throughout the procedure. No- template controls with sterile D.W. instead of template DNA were incorporated into each run under the following conditions: 95°C for 3 min, followed by 40 cycles of 15 sec at 95°C and 30 sec at 55°C. The mRNA expression level was
quantified by determining the cycle threshold
(CT), which is the number of PCR cycles required
for the fluorescence to exceed a value signifi
-cantly higher than the background fluores
-Table 3. Clinical cut-off values of HER2 mRNA RT-qPCR obtained by ROC curve analysis with GAPDH Ct value below 30
Relative HER2 mRNA
expression level Sensitivity % 95% CI Specificity % 95% CI Likelihood ratio
> 73.9 93.0 80.9% to 98.5% 83.7 70.3% to 92.7% 6.5
> 78.1 93.0 80.9% to 98.5% 85.7 72.8% to 94.1% 9.1
> 105.5 93.0 80.9% to 98.5% 89.8 80.4% to 97.7% 11.4
> 135.1 90.7 77.9% to 97.4% 91.8 80.4% to 97.7% 11.1
[image:4.612.93.522.98.173.2]Abbreviations: ROC, Receiver operating characteristic; CI, Confidence interval.
[image:4.612.92.284.208.572.2]cence. To avoid false negatives due to degrada-tion of mRNA, the reference gene, glycerald- ehyde-3-phosphate dehydrogenase (GAPDH), was used as a control. Target gene mRNA expression levels relative to GAPDH were auto-matically calculated using the comparative Ct method by CFX Manager Software v1.6 (Bio-Rad) or Genex Software (Bio-(Bio-Rad), and the cut-off value for distinguishing between positive and negative results was a relative HER2 mRNA expression level of 100.
Statistical analysis
For statistical data analysis, the software PRISM 5 Software (GraphPad, La Jolla, CA, USA) was used. In order to determine the
statis-tical significance of data, Student’s t-test and one-way ANOVA were carried out for the two-group comparison and multiple-two-group compari-son, respectively. Receiver operating charac-teristic (ROC) curve analysis between conven- tional HER2 IHC, FISH and HER2 mRNA
Data expressed as relative HER2 mRNA levels were calculated based on the basal expression level of HER2 in MDA-MB-231 cell line having low HER2 expression. Thus, fold increase of HER2 expression is relative value to the HER2 expression that is set 1.0 in MDA-MB-231 cells. As we expected, SK-BR3, a HER2 over-express-ing cell line, exhibited 57-fold higher HER2 mRNA expression, whereas, monocyte cell line THP-1, a cell line weakly expressing HER2, exhibited 0.7-fold expression of HER2 mRNA (Table 1).
Expression levels of HER2 mRNA in the clinical specimens
In order to determine whether BrightGen HER2 RT-qDx was useful to detect HER2 expression in FFPE clinical specimens, a total number of 199 FFPE samples from breast cancer patients who had IHC scores were subjected to RT-qPCR analysis of HER2 and GAPDH.
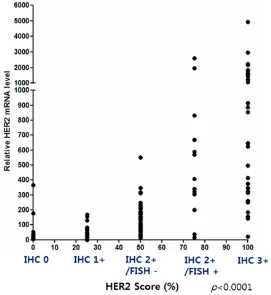
Figure 3. Correlation coefficient analysis between the HER2 mRNA
RT-qPCR results and HER2 IHC and FISH results. The correlation between HER2 mRNA RT-qPCR and HER2 IHC and FISH results was good (Pearson r = 0.5418, r2 = 0.2936, P < 0.0001).
RT-qPCR was performed for all data.
Results
Analytical sensitivity of the RT-qPCR for HER2 mRNA detection using reference breast cancer cell lines
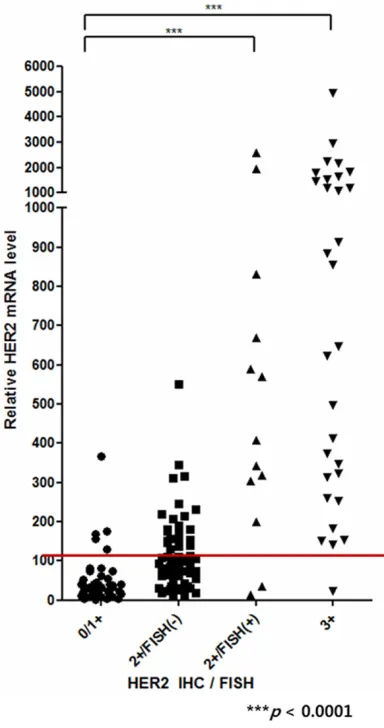
[image:5.612.93.364.77.372.2]According to the BrightGen HER2 RT-qDxI anal-yses, the samples having HER2 IHC 0 score showed relative HER2 mRNA expression levels from 4.5 to 395 (average, 83.7). And the sam-ples having HER2 IHC 1+ score showed relative HER2 mRNA expression levels from 0.5 to 401 (average, 86.6). The HER2 IHC score 2+/FISH- samples showed relative HER2 mRNA expres-sion level from 0.01 to 813 (average, 198.1). In the HER2-positive groups, IHC 2+/FISH+ sam-ples, showed relative HER2 mRNA expression level from 13.3 to 2711 (average, 709.4), and HER2 IHC 3+ samples showed relative HER2 mRNA expression levels from 22.5 to 4850 (average, 1936.7) (Figure 2).
Diagnostic cut-off determination of HER2 mRNA RT-qPCR assay
ROC analysis was performed to determine the optimal diagnostic cut-off value for clinical use. For ROC analysis, both of the HER2 mRNA lev-els obtained with the BrightGen HER2 RT-qDx analyses and the HER2 IHC score were used. The 199 FFPE samples were divided into two groups: HER2 positive and HER2 IHC-negative. Samples having IHC scores greater than 2+ and FISH+ were included in the HER2 IHC-positive group. Samples having IHC scores of 0 and 1+ were included in the HER2 IHC-negative group. IHC 2+ and FISH- samples were excluded from the analysis for its inconsistent results between the two assays.
Sensitivity and specificity of the ROC analysis
were expressed by the area under curve (AUC) value. Among the 199 FFPE breast cancer tis-sue samples, 153 samples had GAPDH Ct value below 30. The highest AUC value was obtained from the samples having GAPDH Ct values below 30 indicating the highest
sensitiv-ity and specificsensitiv-ity (AUC = 0.9466). According to
the ROC analysis, the cut-off value of HER2 RT-qPCR was determined by likelihood ratio (Table 3). The highest likelihood ratio was the relative HER2 mRNA levels over 105.5 fold,
indicating highest sensitivity and specificity.
Based on this result, samples with a relative HER2 mRNA expression level greater than 105.5 by HER2 RT-qPCR assay were consid-ered positive in this study (Table 3).
Comparison of the RT-qPCR results with IHC and FISH results for HER2 expression
Among the HER2-positive samples decided by IHC or IHC/FISH (HER2 IHC 3+ and IHC 2+/
FISH+), all the samples were positive with HER2 RT-qPCR except 3 samples. Among the HER2-negative samples (HER2 IHC 0 and 1+), 44 samples were negative and 5 samples were detected positive with the RT-qPCR. Therefore,
the overall sensitivity and specificity of the
BrightGen HER2 RT-qDx were 93.0% and 89.8%, respectively (Table 2). The P-values between HER2 IHC negative and positive were
statically significant (P < 0.0001) via one-way ANOVA test when it was decided by the results from the RT-qPCR analyses.
Correlation level between the RT-qPCR and HER2 IHC/FISH score for detection of HER2 expression
In order to verify the correlation between rela-tive HER2 mRNA expression level and HER2
IHC/FISH score, correlation coefficient analysis
was performed using clinical samples having GAPDH Ct value below 30 (Figure 3). For the
analysis of the correlation coefficient, the HER2
IHC test results were given as scores: a HER2 IHC score of 0 for 0, a HER2 IHC score of 1+ for 25, a HER2 IHC score 2+/FISH- for 50, a HER2 IHC score 2+/FISH+ for 75, and a HER2 IHC score of 3+ for 100. Then, HER2 mRNA RT-qPCR results of FFPE breast cancer tissue samples were compared with the HER2 IHC/FISH test results. The data showed that there was a cor-relation between relative HER2 mRNA expres-sion levels and standard HER2 IHC/FISH test results (Pearson r = 0.5408, r2 = 0.2936, P < 0.0001) (Figure 3).
Discussion
IHC and FISH are regarded as standard assays for detection of HER2 expression in breast can-cer samples. Determination of HER2 expres-sion is essential for application of Herceptin-mediated therapy to breast cancer patients. In particular, IHC has been widely used for its mul-tiple application to screening, diagnosis, and cancer stage determination. Nevertheless, IHC has fundamental weakness: it uses antibody to detect target protein in cell and tissue samples, so that IHC requires a long process time and there are variations between each laboratories [14]. And the intensity of IHC is decided depend-ing on the enzyme activity of horseradish per-oxidase (HRP) that is conjugated on antibodies.
substrate concentrations [16]. For HER2 detec-tion, IHC provides reliable results with 0/1+ indicates HER2-negative status and 3+ indi-cates HER2-positive status in the samples. In case of 2+ score by HER2 IHC, the samples
should be further tested by FISH to confirm
HER2 status [15]. FISH assay also has
weak-nesses: since it uses fluorescent dyes, the
stained slides cannot be preserved a long time,
and FISH assay need a high-resolution fluores -cent microscope that is not equipped in every hospital laboratory [17].
To complement the weaknesses of IHC/FISH methods, we evaluated a RT-qPCR method using a new RT-qPCR assay kit, BrightGen HER2 RT-qDx assay, with which accuracy and sensitivity of the RT-qPCR method were com-pared with IHC/FISH for HER2 detection. We expected that RT-qPCR method could be stan-dardized and reduce variances between
labo-ratories for quantification of HER2 expression
in clinical samples because RT-qPCR assay has strength for quantitating target gene mRNA expression level. RT-qPCR is also recommend-ed by the Clinical and Laboratory Standards Institute (CLSI) guidelines, and it is highly
sensi-tive and specific because primers and probes are target gene sequence-specific [18]. In this
study, HER2 mRNA expression levels were expressed as a fold induction in reference to expression of a housekeeping gene, GAPDH. Therefore, obtaining the minimum Ct value of the GAPDH gene expression level from
speci-mens influenced the sensitivity and specificity
of the assay. In this study, only the Ct values below 30 were used for GAPDH mRNA RT-qPCR (Table 3).
We compared the RT-qPCR results for HER2 expression with that from the current standard methods, IHC and FISH. The overall sensitivity
of the RT-qPCR was 93.0% and the specificity
was 89.8% (Figure 3 and Table 3). Some of the samples showing HER2 IHC 2+/FISH- were pos-itive by the RT-qPCR. We don’t know the reason for the inconsistency clearly, but there might be lost of HER2 mRNA in the samples while the HER2 protein remained. In the previous studies [19, 20], it has been reported that Herceptin had an effect on the patients with HER2 IHC 2+/FISH-. In our study, there were 61 (39.9%) out of 153 samples from the breast cancer patients had HER2 IHC 2+/FISH-. Although, all
of the 61 patients are not subjected to Herceptin treatment, 28 patients (45.9%) were detected positive by the current RT-qPCR analy-ses. Those 28 patients might have high possi-bility to be susceptible to Herceptin treatment. In conclusion, this study shows that the RT-qPCR method produced quite correlated results with that from the conventional IHC/ FISH methods with some exception of the IHC2+/FISH- samples. Because PCR-based
analyses employed sequence-specific primers
and probes for target DNA, we expect that there is much room for improvement of sensitivity
and specificity of the RT-qPCR method by devel -oping new primers and probes. As long as the quality is guaranteed, RT-qPCR method could
be the first choice for determining HER2 expres -sion in clinical samples of breast cancer patients.
Acknowledgements
This study was supported by The Korea Health Technology R&D Project, Ministry of Health and Welfare, Republic of Korea (grant HI12C18- 370100 [A121986] to H.L.).
Disclosure of conflict of interest
None.
Address correspondence to: Dr. Seung Il Kim, Department of Surgery, Yonsei University College of Medicine, 50 Yonsei-ro, Seodaemun-gu, Seoul 120-752, Republic of Korea. Tel: +82-2-2228-2112; Fax: +82-2-313-8289; E-mail: [email protected]; Dr. Hye- young Lee, Department of Biomedical Laboratory Science, College of Health Sciences, Yonsei Univer- sity, 1 Yonseidae-gil, Wonju, Gangwon 220-710, Republic of Korea. Tel: 33-760-2740; Fax: +82-33-760-2561; E-mail: [email protected]
References
[1] Jemal A, Siegel R, Xu J, Ward E. Cancer statis-tics, 2010. CA Cancer J Clin 2010; 60: 277-300.
[2] WHO Cancer factsheet N°297 updated Febru-ary 2009. Last accessed April 2011 at http:// www.who.int/mediacentre/factsheets/fs297/ en/index.html.
[4] Ferretti G, Felici A, Papaldo P, Fabi A, Cognetti F. HER2/neu role in breast cancer: from a prog-nostic foe to a predictive friend. Curr Opin Ob-stet Gynecol 2007; 19: 56-62.
[5] Slamon DJ, Clark GM, Wong SG, Levin WJ, Ull-rich A, McGuire W. Human breast cancer:
cor-relation of relapse and survival with amplifica -tion of the HER-2/neu oncogene. Science 1987; 235: 177-182.
[6] Piccart-Gebhart MJ. Adjuvant trastuzumab therapy for HER2-overexpressing breast can-cer: what we know and what we still need to learn. Eur J Cancer 2006; 42: 1715-1719. [7] Nishimura R, Okumura Y, Arima N.
Trastuzum-ab monotherapy versus combination therapy for treating recurrent breast cancer: time to progression and survival. Breast Cancer 2008; 15: 57-64.
[8] Hillner BE, Smith TJ. Do the large benefits jus -tify the large costs of adjuvant breast cancer trastuzumab? J Clin Oncol 2007; 25: 611-613. [9] Edgerton SM, Moore D 2nd, Merkel D, Thor AD.
erbB-2 (HER-2) and breast cancer progression. Appl Immunohistochem Mol Morphol 2003; 11: 214-221.
[10] Zidan J, Dashkovsky I, Stayerman C, Basher W, Cozacov C, Hadary A. Comparison of HER-2 overexpression in primary breast cancer and metastatic sites and its effect on biological tar-geting therapy of metastatic disease. Br J Can-cer 2005; 93: 552-556.
[11] Sauter G, Lee J, Bartlett JMS, Slamon DJ, Press MF. Guidelines for human epidermal growth factor receptor 2 testing: biologic and method-ologic considerations. J Clin Oncol 2009; 27: 1323-1333.
[12] Moerland E, van Hezik RL, van der Aa TC, van Beek MW, van den Brule AJ. Detection of HER2
amplification in breast carcinomas: compari -son of Multiplex Ligation-dependent Probe
Am-plification (MLPA) and Fluorescence In Situ
Hybridization (FISH) combined with automated spot counting. Cell Oncol 2006; 28: 151-159.
[13] Ellis CM, Dyson MJ, Stephenson TJ, Maltby EL.
HER2 amplification status in breast cancer: a
comparison between immunohistochemical
staining and fluorescence in situ hybridisation
using manual and automated quantitative im-age analysis scoring techniques. J Clin Pathol 2005; 58: 710-714.
[14] Gjerdrum LM, Sorensen BS, Kjeldsen E, So-rensen FB, Nexo E, Hamilton-Dutoit S. Real-time quantitative PCR of microdissected
paraf-fin-embedded breast carcinoma: an alternative
method for HER-2/neu analysis. J Mol Diagn 2004; 6: 42-51.
[15] Hicks DG, Tubbs RR. Assessment of the HER2
status in breast cancer by fluorescence in situ
hybridization: a technical review with interpre-tive guidelines. Hum Pathol 2005; 36: 250-261.
[16] Ellis CM, Dyson MJ, Stephenson TJ, Maltby EL.
HER2 amplification status in breast cancer: a
comparison between immunohistochemical
staining and fluorescence in situ hybridisation
using manual and automated quantitative im-age analysis scoring techniques. J Clin Pathol 2005; 58: 710-714.
[17] Onody P, Bertrand F, Muzeau F, Bieche I, Li-dereau R. Fluorescence in situ hybridization and immunohistochemical assays for HER-2/ neu status determination: application to node-negative breast cancer. Arch Pathol Lab Med 2001; 125: 746-750.
[18] Barberis M, Pellegrini C, Cannone M, Arizzi C, Coggi G, Bosari S. Quantitative PCR and HER2 testing in breast cancer: a technical and cost-effectiveness analysis. Am J Clin Pathol 2008; 129: 563-570.
[19] Horton J. Her2 and trastuzumab in breast can-cer. Cancer Control 2001; 8: 103-110. [20] Paik S, Kim C, Wolmark N. HER2 status and
benefit from adjuvant trastuzumab in breast