RESEARCH ARTICLE
Physiological responses to short-term thermal stress in mayfly
(Neocloeon triangulifer) larvae in relation to upper thermal limits
Kyoung Sun Kim1,*, Hsuan Chou1,*, David H. Funk2, John K. Jackson2, Bernard W. Sweeney2and David B. Buchwalter1,‡
ABSTRACT
Understanding species’ thermal limits and their physiological determinants is critical in light of climate change and other human activities that warm freshwater ecosystems. Here, we ask whether oxygen limitation determines the chronic upper thermal limits in larvae of the mayflyNeocloeon triangulifer, an emerging model for ecological and physiological studies. Our experiments are based on a robust understanding of the upper acute (∼40°C) and chronic thermal limits of this species (>28°C,≤30°C) derived from full life cycle rearing experiments across temperatures. We tested two related predictions derived from the hypothesis that oxygen limitation sets the chronic upper thermal limits: (1) aerobic scope declines in mayfly larvae as they approach and exceed temperatures that are chronically lethal to larvae; and (2) genes indicative of hypoxia challenge are also responsive in larvae exposed to ecologically relevant thermal limits. Neither prediction held true. We estimated aerobic scope by subtracting measurements of standard oxygen consumption rates from measurements of maximum oxygen consumption rates, the latter of which was obtained by treating with the metabolic uncoupling agent carbonyl cyanide-4-(trifluoromethoxy) pheylhydrazone (FCCP). Aerobic scope was similar in larvae held below and above chronic thermal limits. Genes indicative of oxygen limitation (LDH, EGL-9) were only upregulated under hypoxia or during exposure to temperatures beyond the chronic (and more ecologically relevant) thermal limits of this species (LDH). Our results suggest that the chronic thermal limits of this species are likely not driven by oxygen limitation, but rather are determined by other factors, e.g. bioenergetics costs. We caution against the use of short-term thermal ramping approaches to estimate critical thermal limits (CTmax) in aquatic insects because those temperatures are typically
higher than those that occur in nature.
KEY WORDS: Temperature, Aerobic scope, Hypoxia, Aquatic insect, Gene expression
INTRODUCTION
Freshwater ecosystems support a disproportionate percentage of
the earth’s biodiversity (Dijkstra et al., 2014) and are among the
most threatened by human activities and global climate change (Carpenter et al., 1992). Aquatic insects often dominate freshwater
ecosystems in terms of biodiversity and ecological processes such as organic material processing and energy flow (Merritt et al., 2008; Wallace and Webster, 1996). The broad range of environmental sensitivity among insect species and their ecological importance has led to the widespread use of insects in ecological monitoring programs worldwide (Hawkins et al., 2000; Hawkins, 2006; Resh and Jackson, 1993). Although it is well established that temperature plays a major role in the geographic distribution of species, timing of species life history characteristics and structure of aquatic insect communities (Hynes, 1970; Sweeney and Vannote, 1978, 1984; Sweeney et al., 1990; Vannote and Sweeny, 1980; Ward and Stanford, 1982), both the thermal limits of individual species and the fundamental physiological mechanisms that determine those thermal limits remain poorly understood in this important but understudied faunal group.
We are concerned that studies used to infer the thermal limits of different aquatic insects often focus on short-term acute thermal
challenges (critical temperature or CTmax type experiments) or
thermal ramping rates (see Sorensen et al., 2013) that are not typically experienced by organisms in nature. Despite excellent work showing the importance of temporal aspects of thermal change and exposure durations (Angilletta, 2009; Schulte et al., 2011; Dillon and Frazier, 2013), short-term thermal challenges remain the most common experimental approach used to study thermal physiology. It remains
unclear how acute CTmaxand the physiological processes that occur
under these conditions relate to the thermal limits of aquatic insects in the natural environment (i.e. long-term thermal limits for successful metamorphosis and reproduction). In the field of toxicology, it is well understood that the mode of toxicity of a given chemical in a given species may be very different depending on exposure intensity, duration and frequency. It is highly likely that the physiological mechanisms underpinning chronic and acute thermal limits are also different (Clark et al., 2013a).
The oxygen- and capacity-limited thermal tolerance (OCLTT) hypothesis has emerged as a compelling framework for understanding and studying the thermal limits of ectotherms (e.g. Pörtner, 2001, 2002, 2010; Pörtner et al., 2006). The core concept is that the
‘mismatch between the demand for oxygen and the capacity of oxygen
supply to tissues is the first mechanism to restrict whole-animal
tolerance to thermal extremes’(Pörtner, 2010). To date, this concept
has been supported as applicable to acute thermal tolerance in aquatic
insects. For example, Verberk and Bilton (2011) showed that CTmax
estimates could be increased with oxygen supplementation or
decreased by oxygen depletion in the stoneflyDinocras cephalotes.
This finding was also observed (Verberk and Bilton, 2013) in four additional species, and further work (Verberk and Bilton, 2015)
showed that in the air-breathing aquatic insectIlyocoris cimicoides,
hypoxic water did not influence heat tolerance, whereas hypoxic water reduced heat tolerance in a plastron (dissolved oxygen)-breathing
Aphelocheirus aestivalis. To our knowledge, no studies in aquatic
Received 21 January 2017; Accepted 4 May 2017
1Graduate Toxicology Program, Department of Biological Sciences, North Carolina State University, Raleigh, NC 27695, USA.2Stroud Water Research Center, Avondale, PA 19311, USA.
*These authors contributed equally to this work
‡Author for correspondence (dbbuchwa@ncsu.edu) D.B.B., 0000-0002-4372-1268
Journal
of
Experimental
insects have previously explored whether oxygen limitation occurs at more ecologically relevant chronic thermal limits.
In the present study, we ask if the mismatch between oxygen supply and demand is apparent at the chronic upper thermal
limits of the mayfly Neocloeon triangulifer(McDunnough 1931)
(Ephemeroptera: Baetidae). This parthenogenetic species (see Funk et al., 2006) has emerged as a useful laboratory model for ecological (Sweeney and Vannote, 1984) and physiological/toxicological studies (Sweeney et al., 1993; Conley et al., 2009, 2011, 2013, 2014; Kim et al., 2012; Kunz et al., 2013; Soucek and Dickinson, 2015; Xie et al., 2010; Xie and Buchwalter, 2011; Johnson et al., 2015). We established chronic upper thermal limits by rearing newly hatched eggs to adulthood across several temperatures. We used both respirometry and gene expression (RT-qPCR) to seek evidence for oxygen limitation in larvae subjected to temperatures bracketing the chronic thermal limits. Specifically, we used the metabolic uncoupling agent carbonyl cyanide-4-(trifluoromethoxy)
phenylhydrazone (FCCP) to stimulate maximum oxygen
consumption rates for the estimation of aerobic scope. We also identified genes responsive to environmental hypoxia and thermal stress and examined their relative expression patterns in larvae exposed to different thermal and oxygen conditions.
MATERIALS AND METHODS Assessing chronic thermal limits
To establish chronic thermal limits on mayfly survival rate,
hatchlings (<12 h old) of N. triangulifer[WCC-2 clone, isolated
from White Clay Creek (WCC), Chester County, PA, USA] (Sweeney et al., 1993; Funk et al., 2006) were reared from first instar larvae to the subimago stage in 1.9-liter glass jars immersed in water baths held at constant temperature (±0.05°C) at the Stroud Water Research Center (SWRC) (Avondale, PA, USA). Rearing was completed at nine temperatures ranging from 14 to 30°C in 2°C increments. Five to 11 replicates (glass jars), each containing 50 larvae at the start, were involved in each temperature treatment. An air stone in each jar insured conditions of oxygen saturation throughout the experiment. Simulated daylight was provided by
8-foot (2.44-m) fluorescent ‘grow lights’ and all experiments
involved a 15 h:9 h light:dark cycle. Food was providedad libitum
and consisted of a 1–3 mm thick coating of periphyton (i.e. a natural
algal mix consisting of predominantly diatoms) attached to 23×6.4×0.16 cm acrylic plates placed in each glass rearing jar. The colonization of algae on the plates was achieved by streaming raw stream water (from WCC) continuously over the acrylic plates for approximately 4 weeks in a greenhouse. Plates were replaced as necessary throughout the experiments to assure an abundance of high-quality food. A screened cage was fitted tightly over each rearing jar to capture/contain emerging subimagoes and adults. Emerging subimagoes/adults were collected and enumerated daily.
Assessing acute thermal limits
To assess acute thermal limits, 23-day-old larvae (approximately 80% through larval development) that had been reared at 20°C were individually held in 30 ml beakers in a water bath at SWRC. A diatom slurry was prepared from the algal plates described above and was equally provisioned across the 30 exposure beakers.
Temperature in the water bath was increased at a rate of 0.75°C h−1,
and cumulative mortality was recorded until all larvae died.
Mayfly husbandry for physiological experiments
The WCC-2 clone ofN. trianguliferis also maintained at North
Carolina State University (Raleigh, NC, USA) on the laboratory
benchtop at room temperature (21–22°C) using food (natural WCC
periphyton) provided by SWRC as described above. Reconstituted artificial soft water (American Society for Testing and Materials) was produced from ACS grade salts and deionized water as follows:
48 mg l−1 NaHCO
3, 30 mg l−1 CaSO4·H2O, 30 mg l−1 MgSO4
and 2 mg l−1 KCl; pH 7.6±0.4 for rearing. In all physiological
experiments, control larvae were held in a temperature-controlled water bath at 22±1°C.
Respirometry experiments
To examine the effect of temperature on oxygen consumption rates, we used a fiber-optic-based, intermittent flow respirometry system (Loligo Systems, Tjele, Demnark) as described previously (Camp et al., 2014). We examined oxygen consumption in larvae subjected
to a thermal ramp of 1°C h−1, beginning at their rearing temperature
of 22.0±1.0°C. This rate of diel thermal change represents the higher end of typically observed rates in temperate stream ecosystems (Vannote and Sweeny, 1980). This experiment used a single larva per test chamber. Chamber volumes were 1.28±0.1 ml and each chamber was continually stirred by a mini magnetic stir bar. A small piece of stainless steel mesh separated the larvae and stir bar. When oxygen consumption rates changed markedly at 38°C, chambers were checked to assess survival. Chambers were re-checked at 40°C to confirm mortality had occurred in all chambers.
To estimate aerobic scope at different temperatures, we used the metabolic uncoupling agent FCCP to stimulate maximum oxygen consumption rates. This agent disrupts the mitochondrial proton gradient and decouples oxygen consumption from the generation of ATP (Luz et al., 2015a,b). In our experiments, we held individual larvae in rearing water and monitored oxygen consumption for four to eight respirometry cycles (200 s each for flush, hold and measure phases). The mean rates of oxygen consumption for this portion of the experiment were taken as the standard oxygen consumption rate. Then, source water for the treated larvae was switched to an aerated
solution containing 30 µmol l−1FCCP, 2% DMSO in rearing water
using the same respirometry cycles (200 s each for flush, hold and measure phases) as were used in standard oxygen consumption measurements. Exposure of larvae to this concentration stimulates a rapid and dramatic increase in oxygen consumption rates, and larvae ultimately die from exposure. We take the maximum observed oxygen consumption rate as an estimate of maximum oxygen consumption rate for each larva and we take the difference between
each larva’s maximum oxygen consumption rate and standard
oxygen consumption rate as an estimate of aerobic scope. We acknowledge that our estimates of maximum oxygen consumption rate may have a slight low bias as FCCP stimulates rapid increases in oxygen consumption rates until the larvae die (and oxygen consumption rates drop quickly). The temporal resolution of our respirometry (600 s between measurements) could potentially miss the absolute oxygen consumption peak. This bias would also slightly under-estimate aerobic scope. Separate studies demonstrated that DMSO did not affect standard oxygen consumption rates and the exposure solutions did not affect the performance of the sensor spots (data not shown). FCCP experiments were conducted with larvae
reared at 22°C and were performed at 22°C (n=3), 26°C (n=7) and
30°C (n=5). Larvae were held at experimental temperatures for a
minimum of 1–2 h prior to introducing them to the respirometry
chambers.
Gene expression and lactate experiments
To understand whether thermal stress influenced the expression of
genes indicative of physiological oxygen limitation, we first
Journal
of
Experimental
identified hypoxia responsive genes. We exposedN. triangulifer
larvae to a series of short-term hypoxia and gradual temperature change experiments (see below) and quantified the expression of certain genes (Table 1) and gene products (lactate) in the larvae as
our principal response variable. Lactate was measured (n=2) using
the Lactate Assay Kit (MBL®International Corporation, Woburn,
MA, USA) reading absorbance at 570 nm in a FLUOstar OMEGA®
(BMG Labtech Inc., Cary, NC, USA).
Target/reference gene selection and primer design
Primers (Table 1) were designed based on ade novoassembly of
compiled N. triangulifer cDNA sequence data (both 454 and
Illumina platforms) resulting in ∼23,000 contigs with associated
bioinformatics. Based on these sequences, we selected potential genes of interest to further develop qPCR probes. For this study, the
heat shock protein genesHsp40andHsp90were used as indicators
of thermal stress whereas lactate dehydrogenase (LDH) and the
oxygen-sensing gene EGL-9 were used as indicators of oxygen
limitation. Both TATA-box binding protein and 18S rRNA were
evaluated and18S rRNAwas selected as a reference gene. Each gene
of interest was inserted into a pCR2.1®-TOPO® TA vector (Life
Technologies, Carlsbad, CA, USA) expression vector and produced sequences that were independently confirmed. All primers were designed with IDTSciTools (http://www.idtdna.com/SciTools/ SciTools.aspx) or Primer3 v. 0.4 (http://frodo.wi.mit.edu/primer3/) and were synthesized by Life Technologies. Amplicons generated ranged from 179 to 272 base pairs.
RT-qPCR
Total RNA was isolated fromN. trianguliferfollowing the SV Total
RNA Isolation System protocol (Promega, Madison, WI, USA). First-strand cDNA was synthesized from the same amount of each
total RNA by ImProm-II™ reverse transcriptase using random
primers (Promega) and all thermocycling was performed using a Bio-Rad iCycler (Bio-Rad Laboratories, Hercules, CA, USA). Quantitative real-time PCR was performed on an ABI Prism 7700 Sequence Detection System (Applied Biosystems, Carlsbad, CA, USA) using default parameters. Amplification mixtures consisted of 12.5 µl of SYBR Green Master Mix (Applied Biosystems),
10 µmol l−1 primers, 20 ng template cDNA and nuclease-free
water in a total volume of 25 µl. qRT-PCR conditions were 2 min at 94°C, followed by 40 cycles at 95°C for 30 s, 60°C for 30 s and 72° C for 30 s. After the PCR reactions, the melting curve for each PCR
product was determined following the manufacturer’s protocols.
Relative expression of each amplicon was calculated by the
corrected ΔΔCt method (Pfaffl, 2001), with all expression
normalized to 18S rRNA levels in initial control samples. Relative levels of 18S rRNA were confirmed to be approximately equal across all treatments.
Heat and hypoxia gene expression
To validate the potential genes that will respond to hypoxia or heat
stress, an initial critical oxygen tension (Pcrit) experiment
determined that in mature N. triangulifer larvae, oxygen supply
becomes limiting at 18% saturation at 22°C. This result was used to design the following hypoxia experiments to identify heat- and/or hypoxia-responsive genes. Larvae in hypoxia treatments were first exposed to 40% oxygen saturation and then saturation was gradually lowered to either 15% or 5% saturation over 60 min. Hypoxia treatments were maintained by simultaneously bubbling nitrogen and air at different rates to maintain the desired oxygen saturation levels. A mesh filter was used to prevent hypoxia-treated larvae
from accessing the air–water boundary layer and maintain them in
the bottom half of the beaker where dissolved measurements were taken. All treatments had a 6 h exposure duration (inclusive of hypoxia pre-treatment time) as follows: controls (22°C, 100% oxygen saturation), hypoxia 1 (22°C, 15% oxygen saturation), hypoxia 2 (22°C, 15% oxygen saturation followed by 10 min of exposure to 5% oxygen saturation), heat challenge (32°C, 100% oxygen saturation) and heat+hypoxia challenge (32°C, 15% saturation). Sampled larvae from the hypoxia 1 treatment did not include individuals that had lost the ability to swim or maintain hold of the substrate, whereas sampled larvae from the hypoxia 2 treatment included impaired individuals. For all treatments, 10 groups of three pooled larvae were randomly collected and flash-frozen in liquid nitrogen for later RNA extraction and RT-qPCR.
Thermal ramp experiments
To study whether hypoxia responsive genes respond to gradual thermal stress, larvae were subjected to a gradual rise in temperature or
‘thermal ramp’ at a rate of 1°C h−1 from 22 to 34°C. Controls
consisted of 30 larvae collected at the beginning of the experiment ( just prior to increasing temperature) and larvae held at 22°C for the
duration of the experiment (i.e. a‘time’control). At 4°C intervals, 30
larvae were removed from the experiment and flash-frozen in liquid nitrogen. This allowed us to compare the mRNA expression levels of individual genes at 22, 26, 30 and 34°C. Ten groups of three pooled larvae each comprised the samples for each temperature in the RT-qPCR analysis.
Thermal ramp and hold experiments
To determine how genes respond to prolonged exposure to thermal stress, larvae were exposed to a gradual increase in temperature or
‘ramped’from a starting temperature of 22°C as described above.
[image:3.612.47.564.621.737.2]However, in this experiment, when the temperature reached 30°C, two jars were removed from the water bath and transferred to a 30°C incubator. When the water bath temperature reached 34°C, two additional jars were transferred to a 34°C incubator. Larvae were then sampled from the 30 and 34°C incubators after 14 and 24 h of
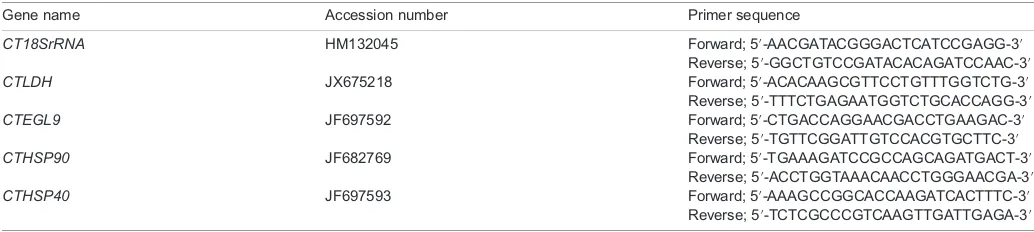
Table 1. List of primer sequences for qPCR gene expression studies
Gene name Accession number Primer sequence
CT18SrRNA HM132045 Forward; 5′-AACGATACGGGACTCATCCGAGG-3′
Reverse; 5′-GGCTGTCCGATACACAGATCCAAC-3′
CTLDH JX675218 Forward; 5′-ACACAAGCGTTCCTGTTTGGTCTG-3′
Reverse; 5′-TTTCTGAGAATGGTCTGCACCAGG-3′
CTEGL9 JF697592 Forward; 5′-CTGACCAGGAACGACCTGAAGAC-3′
Reverse; 5′-TGTTCGGATTGTCCACGTGCTTC-3′
CTHSP90 JF682769 Forward; 5′-TGAAAGATCCGCCAGCAGATGACT-3′
Reverse; 5′-ACCTGGTAAACAACCTGGGAACGA-3′
CTHSP40 JF697593 Forward; 5′-AAAGCCGGCACCAAGATCACTTTC-3′
Reverse; 5′-TCTCGCCCGTCAAGTTGATTGAGA-3′
Journal
of
Experimental
holding time at each temperature. Larvae held at 22°C were used as controls and larvae held at 22°C, 15% oxygen saturation were used for hypoxia treatments. To support this experiment, we measured the concentration of lactate in whole larvae and used it as an indicator of anaerobic metabolism from all treatment groups
(excluding 30°C held for 24 h). Briefly,∼45 larvae were used for
each of two replicates for each treatment. Larvae were homogenized and deproteinated through successively smaller filtration spin columns in preparation for lactate measurements (as above).
Data analysis
Data analysis was performed using GraphPad Prism (v6, GraphPad Software, La Jolla, CA, USA). For survivorship and gene
expression studies, one-way ANOVA was performed and Tukey’s
multiple comparisons test was used to analyze the differences between temperatures/hypoxia groups. Results were significant
when adjustedP≤0.05. Error bars represent ±s.e.m. throughout. For
respirometry studies,Q10estimates were obtained from the slopes of
log10-transformed data and a nonparametric (Mann–Whitney) test
was performed to estimate aerobic scope between different temperature groups.
RESULTS
Chronic and acute thermal responses
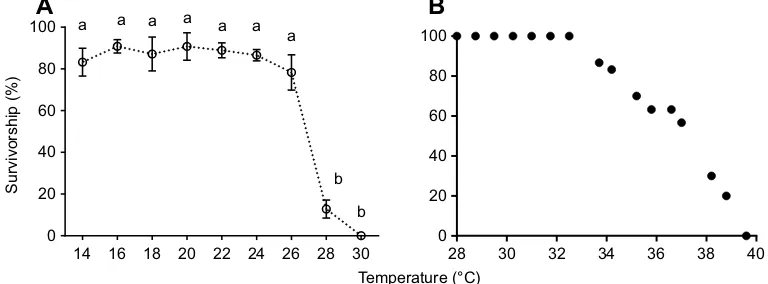
Survivorship ranged between 83.2 and 90.9% for larvae reared from newly hatched, first instar larvae to the subimago stage at constant temperatures between 14 and 24°C (Fig. 1A). However, at 26°C, survivorship declined to 78.3% and then declined precipitously to
12.8% at 28°C. One-way ANOVA and Tukey’s multiple
comparisons test was performed across all rearing temperatures.
The survivorship of N. triangulifer between 26 and 28°C was
significantly different (P<0.0001). Larvae failed to metamorphose to
the subimago stage at 30°C (but did survive for a few weeks before dying). When 30 larvae were challenged with an acute thermal
ramping rate of 0.75°C h−1, no larvae survived past 40°C (Fig. 1B).
Respirometry experiments
Mass-specific respiration rates (ṀO2) of larvae exposed to a 1°C h
−1
ramping rate rose continuously from 21.7 to ∼37°C (Fig. 2).
Between 37 and 38°C, respiration rates became irregular (declined) in all larvae and chambers were checked for survival. All larvae were alive at 38.2°C and dead at 39.8°C following a second peak of
consumption in three of four larvae. Data from 21.7 to 36.03°C were linearized by log transforming the oxygen consumption data
(R2=0.91–0.97, P<0.0001) and metabolic Q
10 estimates derived
from the slopes of the linearized data ranged from 1.70 to 1.96. Peak oxygen consumption was 1.7- to 2.4-fold higher than consumption rates at 30°C, a temperature that exceeds the long-term thermal limits of this species (Fig. 1).
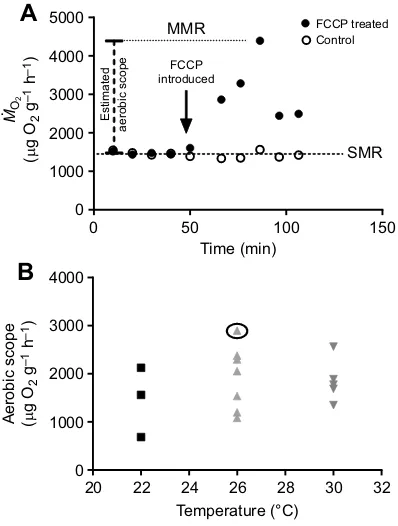
An example of the effect of FCCP treatment on an individual mayfly larva is shown in parallel to an untreated larva in Fig. 3A and estimates of aerobic scope in all FCCP-treated larvae are shown in Fig. 3B. We focused our efforts on the 26°C- and 30°C-treated larvae because these temperatures bracket our estimated chronic thermal limit (between 28 and 30°C; see Fig. 1A) in this species. A
nonparametric (Mann–Whitney) test was performed and estimates of
aerobic scope were not statistically different between 26°C (1921±
253 µg O2g−1h−1) and 30°C (1853±200 µg O2g−1h−1). On average,
maximum observed metabolic rates were 2.22±0.45- and 1.98±0.37-fold higher than mean standard metabolic rates at 26°C and 30°C, respectively.
Gene expression experiments Hypoxia experiments
For all experiments, genes expressed from the control group were
normalized to 1 and Tukey’s multiple comparisons test was used to
analyze the differences of gene expression between treatments. Larvae with 6 h hypoxia treatment had significantly elevated mRNA expression levels for the oxygen-sensing gene prolyl
hydroxylase, also known as Egg Laying Defective Nine (EGL-9)
(∼9.2-fold higher than controls; P<0.0001), andLDH (∼6.9-fold
higher than controls;P=0.0002; Fig. 4). These two genes provided
our strongest indication of oxygen limitation at the whole
organism level. Slight increases in heat shock protein (HSP-90
andHSP-40) mRNA expression were also observed in response to hypoxia treatment, but were only statistically significant for
HSP-40 in the extreme hypoxia (hypoxia 2) treatment group
(P=0.03) (Fig. 4). In contrast, increasing temperature from 22 to
32°C under conditions of normoxia stimulated significantHSP-90
mRNA expression (∼4.9-fold higher than controls; P<0.0001),
whereas HSP-40expression was only slightly elevated and not
statistically significant. Thus, HSP-90 appears to be the most
thermally responsive gene, with its expression further increasing
(by ∼12.5-fold; P<0.0001) under a treatment combination of
14 16 18 20 22 24 26 28 30 0
20 40 60 80 100
Temperature (°C)
Survivorship (%)
a a a a a a a
b
b
28 30 32 34 36 38 40 0
20 40 60 80 100
[image:4.612.114.498.540.682.2]A
B
Fig. 1. Comparison of life cycle and short-term thermal limits inNeocloeon triangulifer.(A) Survivorship as a function of temperature inNeocloeon trianguliferlife cycle rearing experiments. Each point represents the mean survival from rearing jars [14°C (n=8), 16°C (n=7), 18°C (n=7), 20°C (n=8), 22°C (n=11),
24°C (n=10), 26°C (n=7), 28°C (n=5) and 30°C (n=11); 50 larvae per jar]; error bars represent standard deviations from the means. Different lowercase letters
indicate significant differences in survivorship between temperatures (one-way ANOVA, Tukey’s multiple comparisons test;P<0.05). (B) Acute survival of 30
N. trianguliferlarvae subjected to a temperature ramping rate of 0.75°C h−1.
Journal
of
Experimental
higher temperature and hypoxia. It should be noted that the
hypoxia-responsive geneEGL-9was not stimulated by heat alone,
and its expression in response to the combination of heat and
hypoxia was considerably smaller than for hypoxia alone.LDH
(but not EGL-9) expression was mildly but not significantly
stimulated by heat alone.
Thermal ramp experiments
HSP-90 was the most thermally responsive gene and consistently increased with increasing temperature to significant levels (above
controls) when temperatures rose to 30 and 34°C (P<0.0001; Fig. 5A).
A similar response pattern was observed forHSP-40expression, but
this gene was not as responsive either temporally or in magnitude
relative toHSP-90. NeitherEGL-9norLDHresponded significantly
to temperature change at or below the ecologically relevant
temperature of 30°C, butLDHexpression increased significantly at
34°C (∼2.2-fold higher than controls;P<0.0001).
Thermal ramp and hold experiments
Levels of gene expression forEGL-9,LDH,HSP-90andHSP-40in
larvae ramped from 22 to 30°C and held at 30°C for 14 or 24 h were not strikingly different but were elevated (<2-fold) from control levels (i.e. larvae kept at 22°C and normoxia; Fig. 5B). Elevated levels were statistically significant for the temperature-sensitive
genesHSP-90(P=0.02 at 14 h exposure to 30°C;P=0.0007 at 24 h
exposure to 30°C) andHSP-40(P=0.008 at 14 h exposure to 30°C;
P=0.007 at 24 h exposure to 30°C) but not for the hypoxia genes
(exceptLDHat 14 h exposure to 30°C;P=0.03). In contrast, larvae
ramped from 22 to 34°C and held for 14 h at 34°C showed very strong
gene responses, particularly significant for theHSPs (P<0.0001) and
LDH(P<0.0001) but not for EGL-9. In contrast, EGL-9 was strongly
responsive to hypoxia (P<0.0001), while the LDH response to
hypoxia (P<0.0001) and the 34°C treatment was comparable. Larvae
did not survive being held for 24 h at 34°C. It is also noteworthy that
the observed increased levels inLDHmRNA gene expression were
associated with measures of whole-animal lactate levels in larval tissue
by colorimetric assay [though small sample sizes (n=2) limit this
analysis]. Lactate levels in larvae from the 30 and 34°C treatments held for 14 h were 1.2- and 1.9-fold higher but not statistically significant than controls, respectively. Lactate levels were significantly higher
(3.2-fold higher than controls;P=0.03) in hypoxia-treated larvae.
DISCUSSION
Because insects are so important to the ecology of freshwater ecosystems and the focal group for biomonitoring programs
Temperature (°C)
MO
2
(
µ
g O
2
g
–1
h
–1
)
22 24 26 28 30 32 34 36 38 40 0
500 1000 1500 2000 2500 3000 3500 4000 4500
4.6 mg
4.5 mg 5.3 mg
4.1 mg
[image:5.612.328.552.59.246.2].
Fig. 2. Thermolimit respirometry ofN. trianguliferlarvae subjected to a thermal ramp of 1°C h−1(n=1 larva per chamber).Larvae were confirmed to be live at 38°C and dead at 40°C.ṀO2, metabolic rate.
Time (min)
0 50 100 150 0
1000 2000 3000 4000
5000 FCCP treated
Control
FCCP introduced
SMR
Estimated
aerobic scope
Temperature (°C)
Aerobic scope (µg O
2
g
–1
h
–1
)
MO
2
(
µ
g O
2
g
–1
h
–1
)
20 22 24 26 28 30 32 0
1000 2000 3000 4000
A
B
.
[image:5.612.73.275.60.193.2]MMR
Fig. 3. Use of the metabolic inhibitor FCCP to stimulate maximum oxygen consumption rates for aerobic scope estimates.(A) An example of respiratory patterns in a larva treated with carbonyl
cyanide-4-(trifluoromethoxy) pheylhydrazone (FCCP) relative to a control larva. Aerobic scope is taken as the difference between the maximum observed metabolic rate (MMR) and the standard metabolic rate (SMR). (B) Aerobic scope
estimates in individual larvae as a function of temperature: 22°C (n=3), 26°C
(n=7) and 30°C (n=5). One-way ANOVA was performed; there was no
statistical difference between different temperature groups. The example shown in A is circled in B.
22°C; normoxia
22°C; 15% oxygen22°C; 5% oxygen
32°C; normoxia
32°C; 15% oxygen
0 2 4 6 8 10 12 14
Relative mRNA
expression / 18S rRNA
EGL-9 LDH HSP-90
HSP-40
*
*
*
*
*
*
,*
*
+
Fig. 4. Relative mRNA expression of an oxygen-sensing gene (EGL-9), lactate dehydrogenase (LDH) and two heat shock proteins (HSP-40,
HSP-90) inN. trianguliferlarvae subjected to hypoxia and/or heat
treatment.Larvae were pooled in three for one biological replicate (n=10). All data are normalized to control (22°C) 18S rRNA. One-way ANOVA was
performed and Tukey’s multiple comparisons test was used to analyze the
differences of gene expression between treatments. Error bars represent
standard deviations from the mean. *Significant difference (P<0.05) compared
with control (22°C; normoxia).+Significant difference (P<0.05) compared with heat control (32°C; normoxia).
Journal
of
Experimental
[image:5.612.75.274.376.639.2]worldwide, it is important that we develop a more robust understanding of the linkages between their physiology and
performance. The mayfly N. triangulifer is emerging as a
laboratory model species to study chemical pollutants (Conley et al., 2009; Kim et al., 2012; Xie et al., 2010; Struewing et al., 2014), salinity (Johnson et al., 2015; Soucek and Dickinson, 2015) and temperature (Sweeney and Vannote, 1984). Here we used life cycle rearing experiments to establish thermal reaction norms to
provide context for physiological changes in N. triangulifer
associated with increasing temperatures.
Our data are concordant with others (Kingsolver et al., 2011; Kingsolver and Woods, 2016) showing that insects can tolerate short-term thermal challenge at temperatures that far exceed their chronic thermal limits. Similarly, recent work has failed to
demonstrate any correlation between CTmax measurements and
the inferred thermal maxima of several aquatic insect species derived from ecological niche models (C. P. Hawkins, personal communication). The maximum temperature recorded from WCC,
whereN. trianguliferhas maintained a viable population for many
years, was 23.4°C (taken in 2012). However, our studies show that it
can survive for a short time at temperatures approaching 40°C, which are exceedingly rare in temperate aquatic ecosystems. Nevertheless, in larval rearing experiments, it failed to complete metamorphosis to the adult at 30°C (Fig. 1). Thus, there is no single thermal limit, as exposure durations are critical to consider when discussing thermal limits of taxa (Vasseur et al., 2014; Schulte et al., 2011; Dillon et al., 2007; Dillon and Frazier, 2013).
Our study thermally challenged N. triangulifer larvae with
temperatures ranging from those supporting good long-term performance to chronically lethal temperatures to better understand the physiological changes associated with single diel temperature change. Respirometry experiments performed on a thermal ramp showed expected exponential increases in oxygen consumption
ceased at∼37°C, but larvae were still live at 38°C. In both the
short-term ramp experiment at 0.75°C h−1 and the respirometry ramp
experiment at 1.0°C h−1, 100% mortalilty was observed at∼39–40°C.
Regardless, the increase in oxygen consumption rates observed when temperatures were ramped from 30°C ( past the chronic
thermal limit) to temperatures near death (∼38°C) was substantial.
We used FCCP to stimulate estimates of maximum oxygen consumption rates, which enabled us to estimate aerobic scope in larvae challenged by a short-term exposure to a chronically lethal temperature (30°C). According to the OCLTT hypothesis, we might have expected to see a decrease in aerobic scope with warming temperatures in 22°C-reared larvae challenged at 30°C, especially considering their larger body size and tracheal architecture (Helm and Davidowitz, 2013) associated with their thermal history relative to larvae reared at a warmer temperature. However, we observed no significant change in aerobic scope, suggesting that this is not a critical factor underlying the chronic thermal limits of this species. Methods for measuring aerobic scope are not well developed for very small organisms such as mayfly larvae, and have generated controversy otherwise (Clark et al., 2013 a,b; Farrell, 2013). While our novel approach of using a chemical agent to elicit maximum oxygen consumption requires further validation in subsequent studies, it provides a promising technique for overcoming the technical challenges of estimating aerobic scope in water-breathing aquatic insects.
In our gene expression experiments (Figs 4 and 5), hypoxia
treatment stimulated the expression ofLDHandEGL-9.EGL-9is an
oxygen-sensing prolyl hydroxylase that serves as an off-switch for
hypoxia-inducible factor (HIF1α) signaling (Bishop et al., 2004;
Epstein et al., 2001; Semenza, 2001; Shao et al., 2009; Shen and
Powell-Coffman, 2003). EGL-9 was largely unresponsive to
thermal challenge in our gene expression experiments, indicating that exposure to high temperatures alone did not appear to activate hypoxia signaling or indicate systemic oxygen limitation. Similarly, the combination of increased temperatures and hypoxia treatment
resulted in smaller increases inLDH and EGL-9expression than
observed under hypoxia at cooler temperatures.
AlthoughLDH and EGL-9expression were both stimulated by
hypoxia treatment, they responded differentially to high temperature
stress.EGL-9did not respond to high temperature stress, suggesting
thatHIF1αsignaling was not stimulated by these temperatures.LDH
expression did increase but only at temperatures exceeding ecological limits. This result could be interpreted in at least two ways. First, Li
et al. (2013) demonstrated that hypoxia upregulates LDH gene
expression in a HIF-independent manner in Drosophila larvae
[late larval stage (L3)]. Therefore, the upregulation of LDH gene
expression we observed inN. trianguliferat temperatures exceeding
ecological thermal limits could be evidence of functional hypoxia. Second, we also note that we used whole mayfly larvae for gene
22°C 26°C 30°C 34°C 22°C # 0
2 4 6 8 10
A
B
*
*
*
*
*
22°C; normoxia
30°C; 14 h 30°C; 24 h 34°C; 14 h
22°C; 15% oxygen
0 2 4 6 8
Relative mRNA
expression / 18S rRNA
* **
* *
*
*
*
*
*
[image:6.612.77.273.58.387.2]EGL-9 LDH HSP-90 HSP-40
Fig. 5. Relative mRNA expression of an oxygen-sensing gene (EGL-9), lactate dehydrogenase (LDH) and two heat shock proteins (HSP-40,
HSP-90) inN. trianguliferlarvae subjected to a thermal ramping rate of 1°C h−1
at normoxia.Larvae were pooled in groups of three for each biological
replicate (n=10). (A) Larvae were sampled at 4 h (4°C) intervals from 22°C.
22°C # larvae were held for 12 h and serve as a time control. (B) Larvae were held for 14 and 24 h at 30°C and 14 h at 34°C. All data are normalized to control
(22°C) 18S rRNA. One-way ANOVA was performed and Tukey’s multiple
comparisons test was used to analyze the differences of gene expression between treatments. Error bars represent standard deviations from the mean. *Significant difference (P<0.05) compared with control.
Journal
of
Experimental
expression studies; therefore, the increased LDH expression may indicate that not all tissues received adequate oxygen supply and some anaerobic metabolism was occurring in the larvae. Third, thermal stress may have an effect on energy metabolism. While the rate of pyruvate entering the tricarboxylic acid (TCA) cycle is oxygen-dependent, the activity of LDH is oxygen-independent (Callier and Nijhout, 2014). We speculate that mayfly larvae undergo rapid aerobic glycolysis in response to short-term thermal challenge. In this scenario, the rate of pyruvate production exceeds the rate that it can be incorporated into the TCA cycle, and is transformed by LDH into
lactate (Callier and Nijhout, 2014). Therefore, an observation ofLDH
gene upregulation does not necessarily indicate that larvae are oxygen
deficient. One study in developingDrosophilalarvae also showed the
phenomenon of aerobic glycolysis, and associated it with rapid growth rates (Tennessen et al., 2011).
Taken collectively, our results suggest that although the OCLTT hypothesis may be appropriate for explaining responses to rapid short-term warming, it does not explain thermal limits in the mayfly
N. triangulifer at temperatures that are chronically lethal, and perhaps more ecologically relevant. Respirometry experiments revealed no change in aerobic scope at temperatures that bracketed the chronic thermal limits of this species, and gene expression experiments showed marked differences between responses to heat and hypoxia and little evidence for widespread expression of hypoxia responsive genes at temperatures up to the ecologically relevant limit. Although the data presented here represent physiological responses to short-term thermal change, ongoing studies are evaluating gene expression and metabolomics changes in chronically reared mayflies. These processes are important to understand, particularly in relation to understanding responses to multiple stressors, which are predominant in natural ecosystems (Buchwalter et al., 2003; Piggott et al., 2012; Sokolova et al., 2006). However, our results do suggest that oxygen limitation may indeed
play a significant role whenN. trianguliferlarvae are warmed beyond
their ecologically relevant thermal limit up to their acutely tolerated temperatures. It is also possible that the respiratory challenge observed during the molt (Camp et al., 2014) may introduce transient oxygen limitation, which may become more important as larvae age. The field of toxicology has long realized that mechanisms associated with acute and chronic toxicity may be very different. Our data suggest that the same is likely true for temperature.
Acknowledgements
The authors acknowledge Kaley Major for performing lactate analysis and Goggy Davidowitz and Timothy Clark for providing valuable editorial comments. Allison Camp and Rubia Martin assisted with respirometry experiments.
Competing interests
The authors declare no competing or financial interests.
Author contributions
Conceptualization: B.S., D.F., D.B.; Methodology: H.C.; Investigation: K.K., H.C., D.F., D.B.; Writing - original draft: H.C., D.F., D.B.; Writing - review & editing: K.K., J.J., B.S.; Project administration: D.B.; Funding acquisition: D.B.
Funding
This work was supported by the National Science Foundation [1456191 to D.B.B., 1455906 to B.W.S., J.H.J., D.H.F.] and the Stroud Endowment for Environmental Research.
References
Angilletta, M. J., Jr(2009). Thermal Adaptation: A Theoretical and Empirical Synthesis. Oxford: Oxford University Press.
Bishop, T., Lau, K. W., Epstein, A. C. R., Kim, S. K., Jiang, M., O’Rourke, D., Pugh, C. W., Gleadle, J. M., Taylor, M. S., Hodgkin, J. et al.(2004). Genetic
analysis of pathways regulated by the von Hippel-Lindau tumor suppressor in Caenorhabditis elegans.PLoS Biol.2, e289.
Buchwalter, D. B., Jenkins, J. J. Curtis, L. R.(2003). Temperature influences on water permeability and chlorpyrifos uptake in aquatic insects with differing respiratory strategies.Environ. Toxicol. Chem.22, 2806-2812.
Callier, V. and Nijhout, H. F.(2014). Plasticity of insect body size in response to oxygen: Integrating molecular and physiological mechanisms.Curr. Opin. Insect Sci.1, 59-65.
Camp, A. A., Funk, D. H. and Buchwalter, D. B.(2014). A stressful shortness of breath: molting disrupts breathing in the mayflyCloeon dipterum.Freshwater Sci.
33, 695-699.
Carpenter, S. R., Fisher, S. G., Grimm, N. B. and Kitchell, J. F.(1992). Global change and freshwater ecosystems.Annu. Rev. Ecol. Syst.23, 119-139.
Clark, T. D., Sandblom, E. and Jutfelt, F.(2013a). Aerobic scope measurements of fishes in an era of climate change: respirometry, relevance and recommendations. J. Exp. Biol.216, 2771-2782.
Clark, T. D., Sandblom, E. and Jutfelt, F.(2013b). Response to Farrell and to Pörtner and Giomi.J. Exp. Biol.216, 4495-4497.
Conley, J. M., Funk, D. H. and Buchwalter, D. B. (2009). Selenium bioaccumulation and maternal transfer in the mayflyCentroptilum trianguliferin a life-cycle, periphyton-biofilm trophic assay. Environ. Sci. Technol. 43, 7952-7957.
Conley, J. M., Funk, D. H., Cariello, N. J. and Buchwalter, D. B.(2011). Food rationing affects dietary selenium bioaccumulation and life cycle performance in the mayflyCentroptilum triangulifer.Ecotoxicology20, 1840-1851.
Conley, J. M., Funk, D. H., Hesterberg, D. H., Hsu, L.-C., Kan, J., Liu, Y.-T. and Buchwalter, D. B.(2013). Bioconcentration and biotransformation of selenite versus selenate exposed periphyton and subsequent toxicity to the mayfly Centroptilum triangulifer.Environ. Sci. Technol.47, 7965-7973.
Conley, J. M., Watson, A. L. T. D., Xie, L. and Buchwalter, D. B.(2014). Dynamic selenium assimilation, distribution, efflux, and maternal transfer in Japanese medaka fed a diet of se-enriched mayflies.Environ. Sci. Technol.48, 2971-2978.
Dijkstra, K.-D. B., Monaghan, M. T. and Pauls, S. U. (2014). Freshwater biodiversity and aquatic insect diversification.Annu. Rev. Entomol.59, 143-163.
Dillon, M. E. and Frazier, M. R.(2013). Thermodynamics constrains allometric scaling of optimal development time in insects.PLoS ONE8, e84308.
Dillon, M. E., Cahn, L. R. Y. and Huey, R. B.(2007). Life history consequences of temperature transients inDrosophila melanogaster.J. Exp. Biol.210, 2897-2904.
Epstein, A. C. R., Gleadle, J. M., McNeill, L. A., Hewitson, K. S., O’Rourke, J., Mole, D. R., Mukherji, M., Metzen, E., Wilson, M. I., Dhanda, A. et al.(2001).C. elegansEGL-9 and mammalian homologs define a family of dioxygenases that regulate HIF by prolyl hydroxylation.Cell107, 43-54.
Farrell, A. P.(2013). Aerobic scope and its optimum temperature: clarifying their usefulness and limitations–correspondence on J. Exp. Biol. 216, 2771-2782. J. Exp. Biol.216, 4493-4494.
Funk, D. H., Jackson, J. K. and Sweeney, B. W.(2006). Taxonomy and genetics of the parthenogenetic mayfly Centroptilum triangulifer and its sexual sister Centroptilum alamance(Ephemeroptera:Baetidae).J. North. Am. Benthol. Soc.
25, 417-429.
Hawkins, C. P.(2006). Quantifying biological integrity by taxonomic completeness: its utility in regional and global assessments.Ecol. Appl.16, 1277-1294.
Hawkins, C. P., Norris, R. H., Hogue, J. N. and Feminella, J. W. (2000). Development and evaluation of predictive models for measuring the biological integrity of streams.Ecol. Appl.10, 1456-1477.
Helm, B. R. and Davidowitz, G.(2013). Mass and volume growth of an insect tracheal system within a single instar.J. Exp. Biol.216, 4703-4711.
Hynes, H. B. N.(1970). The ecology of stream insects.Annu. Rev. Entomol.15, 25-42.
Johnson, B. R., Weaver, P. C., Nietch, C. T., Lazorchak, J. M., Struewing, K. A. and Funk, D. H.(2015). Elevated major ion concentrations inhibit larval mayfly growth and development.Environ. Toxicol. Chem.34, 167-172.
Kim, K. S., Funk, D. H. and Buchwalter, D. B.(2012). Dietary ( periphyton) and aqueous Zn bioaccumulation dynamics in the mayflyCentroptilum triangulifer. Ecotoxicology21, 2288-2296.
Kingsolver, J. G. and Woods, H. A.(2016). Beyond thermal performance curves: modeling time-dependent effects of thermal stress on ectotherm growth rates. Am. Nat.187, 283-294.
Kingsolver, J. G., Woods, H. A., Buckley, L. B., Potter, K. A., MacLean, H. J. and Higgins, J. K.(2011). Complex life cycles and the responses of insects to climate change.Integr. Comp. Biol.51, 719-732.
Kunz, J. L., Conley, J. M., Buchwalter, D. B., Norberg-King, T. J., Kemble, N. E., Wang, N. and Ingersoll, C. G.(2013). Use of reconstituted waters to evaluate effects of elevated major ions associated with mountaintop coal mining on freshwater invertebrates.Environ. Toxicol. Chem.32, 2826-2835.
Li, Y., Padmanabha, D., Gentile, L. B., Dumur, C. I., Beckstead, R. B. and Baker, K. D.(2013). HIF- and non-HIF-regulated hypoxic responses require the estrogen-related receptor inDrosophila melanogaster.PLoS Genet.9, e1003230.
Luz, A. L., Rooney, J. P., Kubik, L. L., Gonzalez, C. P., Song, D. H. and Meyer, J. N.(2015a). Mitochondrial morphology and fundamental parameters of the mitochondrial respiratory chain are altered inCaenorhabditis elegansstrains
Journal
of
Experimental
deficient in mitochondrial dynamics and homeostasis processes.PLoS ONE10, e0130940.
Luz, A. L., Smith, L. L., Rooney, J. P. and Meyer, J. N.(2015b). Seahorse Xfe 24 extracellular flux analyzer-based analysis of cellular respiration inCaenorhabditis elegans.Curr. Protoc. Toxicol.66, 25-15.
Merritt, R. W., Cummins, K. W. and Berg, M. B.(2008).An Introduction to the Aquatic Insects of North America. Dubuque: Kendall-Hunt Publishing Company.
Pfaffl, M. W.(2001). A new mathematical model for relative quantification in real-time RT-PCR.Nucleic Acids Res.29, e45.
Piggott, J. J., Lange, K., Townsend, C. R. and Matthaei, C. D.(2012). Multiple stressors in agricultural streams: a mesocosm study of interactions among raised water temperature, sediment addition and nutrient enrichment. PLoS ONE7, e49873.
Pörtner, H.(2001). Climate change and temperature-dependent biogeography: oxygen limitation of thermal tolerance in animals. Naturwissenschaffen 88, 137-146.
Pörtner, H. O.(2002). Climate variations and the physiological basis of temperature dependent biogeography: systemic to molecular hierarchy of thermal tolerance in animals.Comp. Biochem. Physiol.132A, 739-761.
Pörtner, H. O.(2010). Oxygen- and capacity-limitation of thermal tolerance: a matrix for integrating climate-related stressor effects in marine ecosystems.J. Exp. Biol.
213, 881-893.
Pörtner, H. O., Bennett, A. F., Bozinovic, F., Clarke, A., Lardies, M. A., Lucassen, M., Pelster, B., Schiemer, F. and Stillman, J. H.(2006). Trade-offs in thermal adaptation: the need for a molecular to ecological integration.Physiol. Biochem. Zool.79, 295-313.
Resh, V. H. and Jackson, J. K. (1993). Rapid assessment approaches to biomonitoring using benthic macroinvertebrates. InFreshwater Biomonitoring and Benthic Macroinvertebrates(ed. D. M. Rosenberg and V. H. Resh), pp. 195-233. New York: Chapman & Hall.
Schulte, P. M., Healy, T. M. and Fangue, N. A.(2011). Thermal performance curves, phenotypic plasticity, and the time scales of temperature exposure.Integr. Comp. Biol.51, 691-702.
Semenza, G. L.(2001). HIF-1, O(2), and the 3 PHDs: how animal cells signal hypoxia to the nucleus.Cell107, 1-3.
Shao, Z., Zhang, Y. and Powell-Coffman, J. A.(2009). Two distinct roles for EGL-9 in the regulation of HIF-1-mediated gene expression inCaenorhabditis elegans. Genetics183, 821-829.
Shen, C. and Powell-Coffman, J. A.(2003). Genetic analysis of hypoxia signaling and response inC. elegans.Ann. N. Y. Acad. Sci.995, 191-199.
Sokolova, I., Lannig, G., Cherkasov, A. and Flores, J.(2006). Interactive effects of temperature and cadmium on metabolism of the eastern oysterCrassostrea virginica: linking whole-organism, cellular and mitochondrial responses.FASEB J.
20, A828.
Sorensen, J. G., Loeschcke, V. and Kristensen, T. N.(2013). Cellular damage as induced by high temperature is dependent on rate of temperature change– investigating consequences of ramping rates on molecular and organismal phenotypes inDrosophila melanogaster.J. Exp. Biol.216, 809-814.
Soucek, D. J. and Dickinson, A.(2015). Full-life chronic toxicity of sodium salts to the mayflyNeocloeon trianguliferin tests with laboratory cultured food.Environ. Toxicol. Chem.34, 2126-2137.
Struewing, K. A., Lazorchak, J. M., Weaver, P. C., Johnson, B. R., Funk, D. H. and Buchwalter, D. B.(2014). Part 2: Sensitivity comparisons of the mayfly Centroptilum triangulifer to Ceriodaphnia dubia and Daphnia magna using standard reference toxicants; NaCl, KCl and CuSO.Chemosphere139, 597-603.
Sweeney, B. W. and Vannote, R. L.(1978). Size variation and the distribution of hemimetabolous aquatic insects: two thermal equilibrium hypotheses.Science
200, 444-446.
Sweeney, B. W. and Vannote, R. L. (1984). Influence of food quality and temperature on life-history characteristics of the parthenogenetic mayfly,Cloeon triangulifer.Freshw. Biol.14, 621-630.
Sweeney, B. W., Jackson, J. K., Newbold, J. D. and Funk, D. H.(1990). Climate change and the life histories and biogeography of aquatic insects in Eastern North America. InGlobal Climate Change and Freshwater Ecosystems(ed. P. Firth and S. Fisher), pp. 143-176. New York: Springer-Verlag.
Sweeney, B. W., Funk, D. H. and Standley, L. J.(1993). Use of the stream mayfly Cloeon trianguliferas a bioassay organism: life history response and body burden following exposure to technical chlordane.Environ. Toxicol. Chem.12, 115-125.
Tennessen, J. M., Baker, K. D., Lam, G., Evans, J. and Thummel, C. S.(2011). The Drosophila estrogen-related receptor directs a metabolic switch that supports developmental growth.Cell Metab.13, 139-148.
Vannote, R. L. and Sweeney, B. W.(1980). Geographic analysis of thermal equilibria: a conceptual model for evaluating the effect of natural and modified thermal regimes on aquatic insect communities.Am. Nat.115, 667-695.
Vasseur, D. A., DeLong, J. P., Gilbert, B., Greig, H. S., Harley, C. D. G., McCann, K. S., Savage, V., Tunney, T. D. and O’Connor, M. I. (2014). Increased temperature variation poses a greater risk to species than climate warming.Proc. Biol. Sci.281, 20132612.
Verberk, W. C. and Bilton, D. T.(2011). Can oxygen set thermal limits in an insect and drive gigantism?PLoS ONE6, e22610.
Verberk, W. C. E. P. and Bilton, D. T.(2013). Respiratory control in aquatic insects dictates their vulnerability to global warming.Biol. Lett.9, 20130473.
Verberk, W. C. E. P. and Bilton, D. T.(2015). Oxygen-limited thermal tolerance is seen in a plastron-breathing insect and can be induced in a bimodal gas exchanger.J. Exp. Biol.218, 2083-2088.
Wallace, J. B. and Webster, J. R.(1996). The role of macroinvertebrates in stream ecosystem function.Annu. Rev. Entomol.41, 115-139.
Ward, J. V. and Stanford, J. A.(1982). Thermal responses in the evolutionary ecology of aquatic insects.Annu. Rev. Entomol.27, 97-117.
Xie, L. and Buchwalter, D. B.(2011). Cadmium exposure route affects antioxidant responses in the mayflyCentroptilum triangulifer.Aquat. Toxicol.105, 199-205.
Xie, L., Funk, D. H. and Buchwalter, D. B.(2010). Trophic transfer of Cd from natural periphyton to the grazing mayflyCentroptilum trianguliferin a life cycle test. Environ. Pollut.158, 272-277.
Journal
of
Experimental