A Study on Effectiveness of Traditional and Social
Media Marketing in Trichy Region
Mr. Robinson. M
1, Sangeetha. M
21Assistant Professor, 2Dept of Management Studies, Anna University (BIT Campus), Trichirapalli.
Abstract: The purpose of the paper is to report on the process and finding of factors that influencing the effectiveness of customer engagement, brand reputation, customer brand attitudes towards traditional and social media marketing. The paper contains adequate details to support that objective and suitable to be presented at the conference. Besides, This paper examines the connection between factors influencing effectiveness of traditional media and also examine the key determinants of those factors towards social media marketing performances.
Traditional and Social media had become really important gradient in today's marketing mix in general and in promotion mix in particular. Adapting some kind of promoting on-line through social media could be a key node for all businesses, The paper carries out empirical research to understand the effectiveness of traditional and social media as a statistical tool and a trial has been created to research the extent social media helps customers in shopping for deciding. In addition methods are advised for increasing the effectiveness. Various applied mathematics tests are applied to support the analysis hypothesis.
Keywords: customer engagement; brand reputation; customer brand attitude; statistical tools; effectiveness of traditional & social media marketing.
I. INTRODUCTION
Traditional marketing may be a rather broad class that includes several styles of advertising and promoting. It's the most recognizable type of marketing, encompassing the advertisements that we tend to see and listen to on a daily basis. Most traditional marketing methods make up one in all four categories: print, broadcast, direct mail, and telephone. Traditional media is an “old media” and is employed for mass communication, advertising and marketing and in trend before the arrival of the net and social media. Methods of traditional marketing will embrace print advertisement, like newsletters, billboards, flyers or pamphlets, TV, newspaper, radio, brochure, magazine.
Social media plays a vital role in our live nowadays. We have the access to any reasonably information at simply a button push aside. Anything that’s thus immensely dilated has each positives and negatives associated with it. The power of social media is extremely high and has its effects on every individual. It is difficult to imagine our lives with social media nowadays and that we do pay a worth for excessive use.
There is lot of dialogue regarding the results of social media on the society as an entire. Some feel that it’s boon whereas different feels that it’s a curse. Social media has exploded as a class of online discussion wherever folks produce content, shares it, Market it and network at huge rate. Social media marketing make use to social media site to lift visibility on the net and to market products & services. Social media sites are useful for building social and business networks, and for exchanging ideas and knowledge’s.
Social media marketing uses on podcasts, blogs, online videos, photo sharing, news sharing, message boards, posts on social media sites to easy on reach a large or targeted audience Social Media Marketing is the create new marketing concept and every business owner wants to know how social media can generate value for their business. People are social media by nature and collect or share information that is important to them.
II. OBJECTIVE OF THE STUDY
A. To study the gap between customer expectation from traditional and social media marketing and its performance.
B. To find the customer engagement by creating interacting between brand to customer and customer to brand.
C. To find the brand reputation by create trust on particular brand.
characteristic regarding individual, group and situation. This research is completely based on the descriptions of factors that lead to the user’s decision making process. So the sampling technique used was non-probability convenience sampling. We used regression analysis for testing of hypothesis. For visual illustrationof finding and results bar charts, pie charts and tables etc.
V. PERCENTAGE ANALYSIS
Table No:4.1
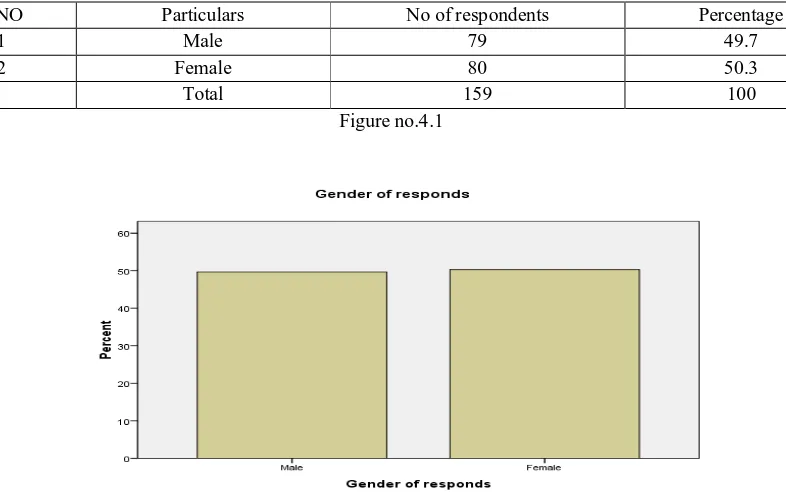
Table Name: Gender of the respondents
S.NO Particulars No of respondents Percentage
1 Male 79 49.7
2 Female 80 50.3
[image:2.595.102.495.326.574.2]Total 159 100
Figure no.4.1
1) Interpretation: From the above table shows that, 49.7% of the respondents are male, 50.3% of the respondents are female.
a) Inference: From this analysis, majority of the respondents are female.
Table no: 4.2
Table Name: Age of the respondents
S.NO Particulars No of respondents Percentages
1 15-20 years 38 23.9
2 21-25 years 45 28.3
3 26-30 years 44 27.7
4 Above 31years 32 20.1
Total 159 100
2) Interpretation: From the above table shows that, 23.9% are 15-20 years, 28.3% are 21-25 years, 27.7% are 26-30 years, 20.1%, of the respondents are above 31 years.
[image:3.595.138.468.125.245.2]a) Inference: From this analysis, majority of the respondents are between 15-20 age groups.
[image:3.595.66.524.312.548.2] [image:3.595.58.536.632.730.2]Table no: 4.3
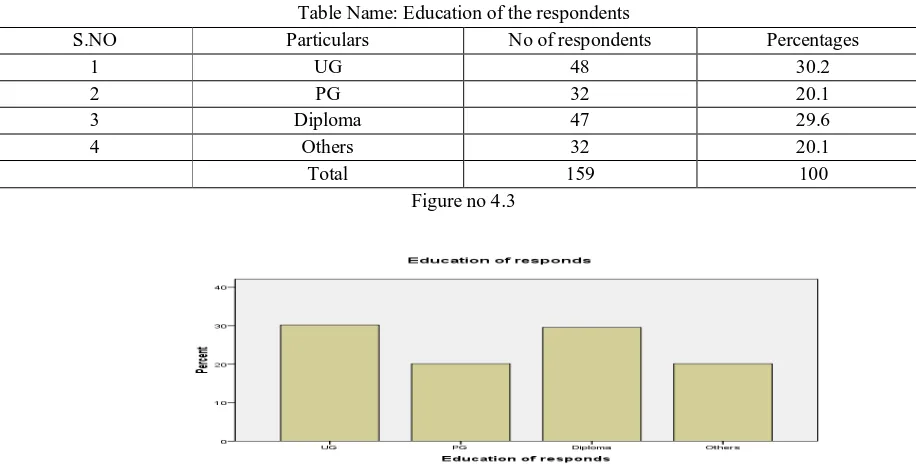
Table Name: Education of the respondents
S.NO Particulars No of respondents Percentages
1 UG 48 30.2
2 PG 32 20.1
3 Diploma 47 29.6
4 Others 32 20.1
Total 159 100
Figure no 4.3
3) Interpretation: From the above table shows that, 30.2% are UG, 20.1% are PG, 29.6% are Diploma, 20.1% are of the respondents are others.
a) Inference: From this analysis, majority of the respondents are UG of degree.
Table no: 4.4
Table Name: Frequency distribution on do you learn about product/brands
S.NO Particulars No of respondents Percentages
1 Television 47 29.6
2 Radio 32 20.1
3 Newspaper 32 20.1
4 Magazines 32 20.1
5 Others 16 10.1
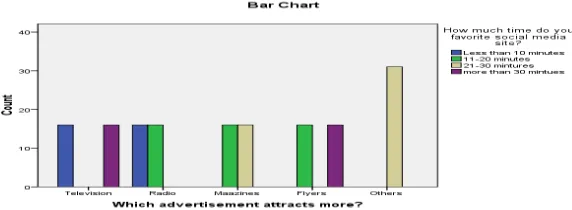
4) Interpretation : The above table shows that, the maximum of 29.6% are learn about product/brand of traditional marketing and the minimum 10.1% are others learn about product/brand in marketing.
[image:4.595.135.474.127.254.2] [image:4.595.60.524.302.553.2]a) Inference: From this analysis, majority of the respondents are learn to about product television.
Table no: 4.5Table Name: Frequency distribution how many per day you spend in traditional media
S.NO Particulars No of respondents Percentages
1 2-4 hours 43 27.0
2 4-5 hours 58 36.5
3 6-10 hours 37 23.3
4 Above 11 hours 21 13.2
5 Total 159 100
Figure no: 4.5
5) Interpretation: From the above table shows that, maximum of 36.5% are 4-5 hours, of the respondents, the minimum of 13.2% of above 11 hours of the respondents in per day you spend in traditional media.
[image:4.595.68.532.634.729.2]a) Inference: From this analysis, majority of the respondents are per day to spend in 4-5 hours.
Table no: 4.6
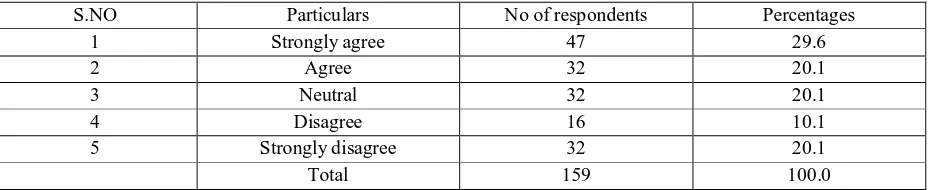
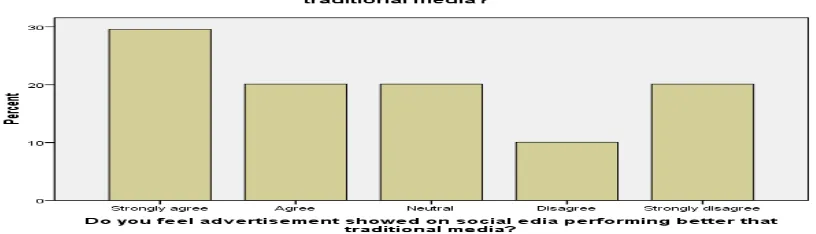
Table Name: Social media better than traditional media of the respondents
S.NO Particulars No of respondents Percentages
1 Strongly agree 47 29.6
2 Agree 32 20.1
3 Neutral 32 20.1
4 Disagree 16 10.1
5 Strongly disagree 32 20.1
Total 159 100.0
6) Interpretation: From the above table shows that, maximum of 29.6% are Strongly agree of the respondents, minimum of 10.1% are Disagree of the respondents in feel advertisement showed on social media.
a) Inference: From this analysis, majority of the respondents are strongly agree.
CHI- Square Test
A. Checking The Relationship Between Modern And Traditional Advertisement 1) H0: There is no relationship between modern and traditional advertisement
[image:5.595.100.508.129.246.2]2) H1: There is no relationship between modern and traditional advertisement
Table no 4.7
Table name: modern and traditional advertisement
Chi-Square Tests
Value Df
Asymp. Sig. (2-sided)
Pearson Chi-Square 2.114E2a 12 .000
Likelihood Ratio 257.302 12 .000
Linear-by-Linear Association 18.601 1 .000
N of Valid Cases 159
a. 0 cells (.0%) have expected count less than 5. The minimum expected count is 6.24.
a) Chi-square result
Calculated Value : 2.114E2a
Degrees of freedom : 12
Tabulated Value : 21.026 Significant Level : 5% Level
b) Interpretation: Calculate value in higher then table value, Therefore, there is no relationship between modern and traditional advertisement.
B. Checking Relationships Between Age And Social Networking Site 1) H0: There is no relationship between age and social networking site
[image:6.595.156.442.122.227.2]2) H1: There is a relationship between age and social networking site
Table no 4.8
Table name: Age and social networking site
Chi-Square Tests
Value Df
Asymp. Sig. (2-sided)
Pearson Chi-Square 1.923E2a 12 .000
Likelihood Ratio 227.770 12 .000
Linear-by-Linear
Association 3.900 1 .048
N of Valid Cases 159
a. 0 cells (.0%) have expected count less than 5. The minimum expected count is 6.24.
a) Chi-square result
Calculated Value : 1.923E2a
Degrees of freedom : 12
Tabulated Value : 21.026 Significant Level : 5% Level
Comparison : 2.114E2a< 21.026
C. Checking Relationships Between Income Level And Customer Engagement
1) H0: There is no relationship between income level and customer engagement
[image:7.595.155.440.166.315.2]2) H1: There is a relationship between income level and customer engagement
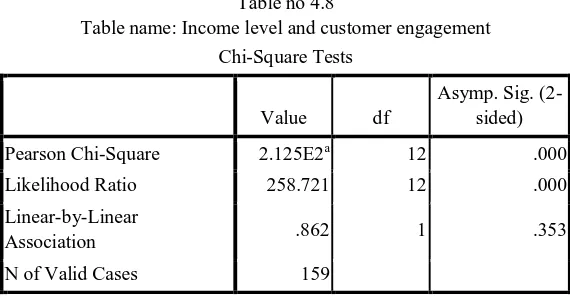
Table no 4.8
Table name: Income level and customer engagement Chi-Square Tests
Value df
Asymp. Sig. (2-sided)
Pearson Chi-Square 2.125E2a 12 .000
Likelihood Ratio 258.721 12 .000
Linear-by-Linear
Association .862 1 .353
N of Valid Cases 159
a. 0 cells (.0%) have expected count less than 5. The minimum expected count is 6.24.
a) Chi-Square Result
Calculated Value : 2.125E2a
Degrees of freedom : 12
Tabulated Value : 21.026 Significant Level : 5% Level
Comparison : 2.125E2a< 21.026
b) Interpretation: Calculate value in higher then table value, Hence, H0 is rejected and H1 is accepted. Therefore, There is a relationship between income level and customer engagement.
VI. FINDING
A. Percentage Analysis
1) The majority of the respondents are female
2) The majority of the respondents are between 15-20 years.
3) The majority of the respondents are UG degree.
4) The majority of the respondents are television on learn of the product and brand.
5) The majority of the respondents are 4-5 hours’ time spent on traditional media.
6) The majority of the respondents are strongly agree on social media better than traditional media.
B. Chi-Square Analysis
analysis, correlation and multiple regression analysis
As a conclusion, this research is about the factors influencing the effectiveness of traditional and social media marketing. It can be concluded all the independent variables gives the moderate relationship. this study shows that, it might be the respondents more experience about customer attitudes. This says that if brand awareness was increased by management the brand attitudes also increased.
REFERENCES
[1] References Aaker, D. A. (2012). Building strong brands. New York. USA: Simon and Schuster,. Afzal, H., Khan, M. A., ur Rehman, K., Ali, I., & Wajahat, S. (2010). Consumer's trust in the brand: Can it be built through brand reputation, brand competence and brand predictability. International Business Research, 3(1), 43-51.
[2] Rantapelkonen Ahlberg, J. (2010). Marketing through Social Media: Case: Comparison of Social Media Marketing selling Approaches of B2C corporations for Company X.
[3] Baruah, T. D. (2012). Effectiveness of Social media as a tool of communication and its potential for technology enabled connections: A micro level study. International Journal of Scientific and Research Publications,2(5), 1-10.
[4] BeritaHarian Online. (2014). Bajet 2014: Pengguna Internet Malaysia cecah 25 juta orang pada 2015. Retrieved 10 August 2015, fromhttp://www2.bharian.com.my/bharian/articles/Bajet2014_PenggunaInternetMalaysiacecah25jutaorangpada2015/belanjawan/belanjawan2014/article_html [5] Cabiddu, F., De Carlo, M., & Piccoli, G. (2014). Social media affordances: Enabling customer engagement. Annals of Tourism Research, 48, 175-192. [6] Castronovo, C., & Huang, L. (2012). Social media in an alternative marketing communication model. Journal of Marketing Development and
Competitiveness, 6(1), 117-134.
[7] Chang, K. C., Jackson, J., & Grover, V. (2003). E-commerce and corporate strategy: an executive perspective. Information & Management, 40(7), 663-675.
[8] Cronin, J. J., Brady, M. K., & Hult, G. T. M. (2000). Assessing the effects of quality, value, and customer satisfaction on consumer behavioral intentions in service environments. Journal of retailing, 76(2), 193-218. Fournier, S. (1998).
[9] Consumers and their brands: Developing relationship theory in consumer research. Journal of consumer research, 24(4), 343-353. [10] Get Malaysian Business Online. (2015). Retrieved 10 August 2015, from http://ms.getmybusinessonline.com
[11] Gretzel, U., Fesenmaier, D. R., Formica, S., & O’Leary, J. T. (2006). Searching for the future: Challenges baby-faced b y destination selling organizations.45(2), 116-126.
[12] Kaplan, A. M., & Haenle in, M. (2010). Users of the world, unite! The challenges and opportunities of Social Media. Business horizons, 53(1), 59-68. Kim, A. J., & Ko, E. (2012). Do social media marketing activities enhance customer equity? An empirical study of luxury fashion brand. Journal of Business Research, 65(10), 1480-1486.