A Markov Chain Approach to Study Replacement
Model
Dr. L. V. Nandakishore 1, Dr. S. Aruna2, Ms. R. Indhumathi 3 1
Professor, Department of Mathematics, Dr. M.G.R. Educational and Research Institute, Chennai
2
AssistantProfessor, Department of Computer Applications, A.M. Jain College, Meenambakkam., Chennai.
3
M.Phil (OR), Department of Mathematics, Dr. M.G.R .Educational and Research Institute, Chennai
Abstract: In this paper a Markov chain approach is applied to find the range for the number of defectives, beyond which, the manufacturing machine has to be replaced. Here the threshold values are found, where the upper threshold value gives the percentage of defectives, which results in machine replacement. The number of defective items is modelled as Poisson distribution.
Keywords: Markov Chain, Poisson, Maintenance, Threshold values, Replacement model.
I. INTRODUCTION
Maintenance could be a routine and continual activity of keeping a selected machine or facility at its normal operational condition so as to perform optimally without any accidental breakdown.
Replacement model are concerned with the replacement of machines, components due to their deteriorate efficiency, failure or break down with respect to time.
If the maintenance is costlier or not possible, then replacement is considered.
A. Types Of Replacements
Replacements can be classified as below
1) Replacement of items whose efficiency deteriorates with time, e.g., machine, components, etc.
2) Replacement of items, that fails suddenly and completely like electric bulbs & tubes.
B. Methods Of Replacement
1) Individual Replacement Policy: After certain period of usage some components do not deteriorate as a group but individual items only fail. In individual replacement policy, an individual item is replaced immediately after it fails.
2) Group Replacement Policy: After certain period of usage some components do not deteriorate as a group but fail completely. These kinds of failures are analyzed by the method called as Group replacement theory. All such components are replaced simultaneously irrespective of whether they have failed or not.
C. Objectives Of Replacement
1) The primary objective of replacement is to direct the organization towards profit maximization or cost minimization.
2) Deciding the replacement policy that determines the optimal replacement age of equipment, instead of using with higher maintenance costs for long time, is the main objective of replacement problem.
3) For instance, in order to replace an item - whether to wait till its failure or replace at an early age with higher cost.
4) For equipments: whether to replace the inefficient equipment with a similar type of equipment or with a modern one.
5) Replacements necessitated due to technology advance.
D. Criteria To Replace Machines Due To Age Based Factors
1) Theorem I: The cost of maintenance of a machine is given as a function increasing with time and its scrap value is constant.
a) If time is measured continuously, then the average annual cost will be minimized by replacing the machine when the average cost to date becomes equal to the current maintenance cost.
b) If time is measured in discrete units, then the average annual cost will be minimized by replacing the machine when the future maintenance cost becomes greater than the current average cost.
2) Theorem II: The maintenance cost increases with time and money value decreases at constant rate i.e., if depreciation value is given, then the replacement policy will be
a) Replace if the future maintenance cost is greater than the weighted average cost of previous periods.
b) Do not replace if the future maintenance cost is less than the weighted average cost of the previous periods.
E. List Of Abbreviations And Notations
E (TC) The expected total cost.
E (AC) The expected total cost of accepting ( not replacing ) the machine. E (RC) The expected total cost of replacing the machine.
E (IC) The expected total cost of inspecting and repairing the machine. t1 The lower threshold value for the number of defective items.
t2 The upper threshold value for the number of defective items.
P The transition probability matrix.
A An identity matrix containing probability of going from a absorbing state to another absorbing state. Q The square matrix containing the transition probability of going from a non-absorbing state to another non-absorbing state.
R The matrix containing all probabilities of going from any non-absorbing state to absorbing state.
O The matrix containing all probabilities of going from any absorbing state to non-absorbing state (always zero). M The fundamental matrix containing the expected number of transitions form any non-absorbing state to another non-absorbing state.
F The probability matrix containing the long run probabilities of the transition from any non-absorbing state to a absorbing state.
pij The probability of going for state i to state j.
mij The expected number of transitions from any non-absorbing state i to any other non-absorbing state j.
fij The long run probability of going from any non-absorbing state i to any absorbing state j.
II. NUMERICALILLUSTRATION
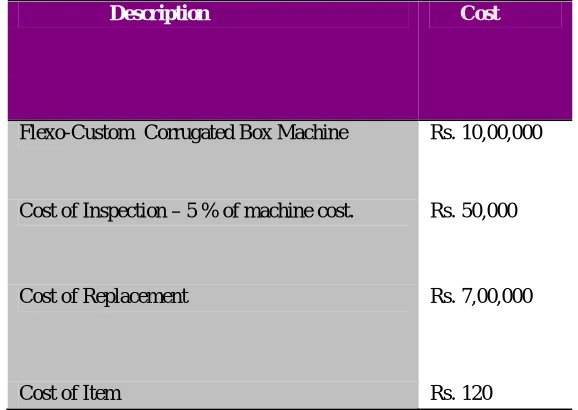
[image:2.612.161.450.497.702.2]The cost of a corrugated box manufacturing machine is Rs.10 lakhs, the cost of each corrugated box is Rs.120, the inspection costs 5% of the machine cost i.e. Rs.50, 000. The cost of replacing the machine is Rs. 7 lakhs.
TABLE I
Data collected to study replacement of machines due to number of defectives.
Description Cost
Flexo-Custom Corrugated Box Machine Rs. 10,00,000
Cost of Inspection – 5 % of machine cost. Rs. 50,000
Cost of Replacement Rs. 7,00,000
The boxes are packed in units of 40 each and the number of defectives in each pack is tabulated below.
TABLE II
Frequency of the number of defective items in the packs of 40.
NUMBER OF DEFECTIVES x FREQUENCY f(x) x f (x)
0 5 0
1 6 6
2 8 16
3 10 30
4 9 36
5 6 30
6 2 12
7 2 14
8 1 8
9 1 9
TOTAL 50 161
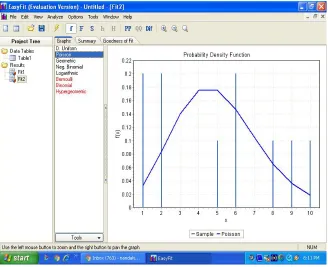
The average number of defectives is λ = 161 / 50 = 3.22.
The number of defectives is modeled as a Poisson distribution with mean =3.22.
Fig.1.Poisson fit for number of defectives.
The states of the Markov chain are
1) State- I- If the number of defective items is greater than t1 but less than or equal to t2. The Machine is inspected and repaired. 2) State – C- If the number of defective items is less than or equal to t1. The Machine is not replaced.
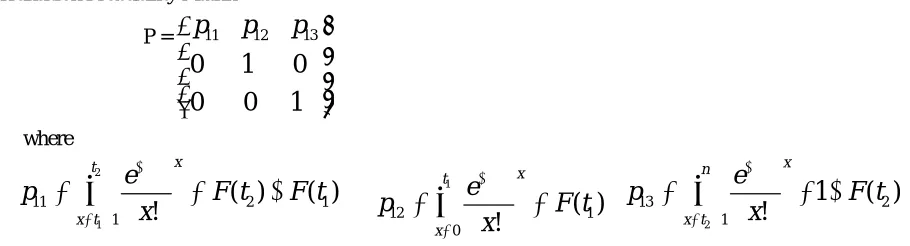
[image:3.612.143.471.384.651.2]A. The Transition Probability Matrix
P = 11 12 13
0
1
0
0
0
1
p
p
p
where 2 111 2 1
1
( )
( )
!
x t x te
p
F t
F t
x
2 13 2 11
( )
!
x n
x t
e
p
F t
x
The minimum total expected cost is calculated using the threshold values in the formula. E (TC) = E(AC) + E(IC) + E(RC).
where E(AC) = Expected acceptance cost= Expected Cost of item*probability of the machine being accepted. E (IC) = Expected inspection costs.
E (RC) = Expected replacement costs=Replacement cost *probability of the machine being replaced. The probabilities are found from the transition probability matrix of the Markov chain.
[image:4.612.74.529.86.209.2]The cumulative frequencies of the threshold values greater than .95 are selected to contain the sampling error to 5%. The same are tabulated below and the threshold values giving minimum total cost are selected.
TABLE III
The threshold values with expected total costs.
Lower threshold value t1 Upper threshold value t2 Expected total cost E(TC) in Rs.
6 9 9105.25
7 8 7856.25
8 9 8878.00
5 9 6927.00
5 8 9590.75
7 9 7125.25
From the table it is found that for a lower threshold value of 5 and upper threshold value of 9 the total expected cost is minimum at Rs.6927.00.The table above refers to packs of 40.
The upper and lower threshold values of 5 and 9 out of 40, converted to percentages are 13 and 23 out of hundred.
1) Hence if the number of defectives is less than 13%, decision C is adopted- The Machine is not replaced.
2) It the number of defectives lies between 13% and 23%, decision I is adopted- The machine is inspected and repaired if necessary.
3) If the number of defectives is more than 23%, decision R is adopted- The Machine is replaced.
B. Future Scope Of The Work
1) Different distributions can be fitted to the number of defectives and the threshold values can be compared.
2) The approach can be varied using other methods like fuzzy, etc. to find these values.
III. CONCLUSIONS
The Markov chain approach is applied to find the range for the number of defectives, beyond which, the manufacturing machine has to be replaced. Here the threshold values are found, where the upper threshold value gives the percentage of defectives, which results in machine replacement. The number of defective items is modelled as Poisson distribution. it is found that for a lower threshold value of 5 and upper threshold value of 9,the total expected cost is minimum at Rs.6927.00.
The upper and lower threshold values of 5 and 9 out of 40, converted to percentages are 13 and 23 out of hundred. Hence if the number of defectives is less than 13%, decision C is adopted- The Machine is not replaced. It the number of defectives lies between 13% and 23%, decision I is adopted- The machine is inspected and repaired if necessary. If the number of defectives is more than 23%, decision R is adopted- The Machine is replaced
1 12 1 0
( )
!
x t xe
p
F t
REFERENCES
[1] Chang, W.L., Wang, M.W., Comparisons of Individual and Group Replacement policies for a Two-machine series system, Universal Journal of Mechanical Engineering 4(5): 113-117,(2016).
[2] Kadja, M., Zaatri, A., Nemouchi, Z., Bessaih, R., Benissaad, S., & Talbi, K., Determining the preventive replacement period based on the age of spare part -Applied Energetics and Pollution ICEMAEP2016, October 30-31,Constantine, Algeria,(2016).
[3] Cheng, G., & Li, L., An optimal replacement policy for a degenerative system with two-types of failure states, Journal of Computational and Applied Mathematics with Applications , 46, 1111-1118,(2014).
[4] Natali, H & Yatsenko, Y., Integral equation of optimal replacement: Analysis and algorithms. Applied Mathematical Modeling 33: 237-274,(2009).
[5] Clavareau, J & Labeau, P.E., Maintenance and Replacement Policies under technological obsolescence. Reliability Engineering and System Safety 94: 370-381, (2009).
[6] Natali, H & Yatsenko, Y., Properties of optimal service life under technological change. Int. J. Production Economics 114: 230-238, (2008).