The Study of Aggregate Segregation and Asphalt
Concrete Permeability from Microstructural
Analysis
Faizan Ur Rahman1, Rawid Khan2
1
MSc Student, 2Professor, Department of Civil Engineering, University of Engineering & Technology Peshawar, Pakistan
Abstract:The main concern of this research is to quantify the microstructure of the asphalt sample. The precise prediction of the performance of the mix is very necessary for the study of the contents of the asphalt internal structure. Coarse aggregates and its structure is an important part of asphalt mixture and its properties affect the strength of concrete and its performance. A non-destructive technique that is X ray tomography is been used along with the image analysis in the following research to study the aggregates internal structural and its behaviour, such as their orientation and segregation of aggregates and air voids distribution in asphalt mixture samples. Before starting the operation the sample of asphalt mix is scanned in the X-ray. The operational machine of X-ray is set out that the images achieved of different samples are of good quality. In the output from the X-ray the achieved images of the samples is in 2D, afterward in the ImageJ (software of the imaging technique) the images are stacked to convert the collected image of samples of asphalt from 2D to 3D. Different techniques have been developed for setting the dark benefits of thresholding of the pictures and to investigate the pictures of the X-ray. To quantify the internal micro structure of the samples of asphalt all the images have been analysed. The internal structure of asphalt mix is characterized due to this study. The asphalt mixture i.e. compacted and hot rolled asphalt sample with vibratory, gyratory and dense bituminous macadam. The procedure through the technique of image analysis was developed to enhance images, extract the aggregate particles and analyse them for segregation and orientation, air voids and permeability. From the study, it was found that, imaging technique can be applied for quantification of the internal segregation and orientation of aggregate in asphalt mixtures and connectivity of the air voids. In the result it is concluded that segregation and orientation of aggregates vary according to the different mixture types. The segregation is more noticed in the mixture that containing large aggregate size. In all the mixtures, the larger aggregate particles were found to move at the outer edges.
Keywords: Image analysis, X-ray CT, permeability, orientation and segregation, aggregate.
I. INTRODUCTION
The most important constituents of asphalt mixture consist of aggregate, bitumen and air voids. The performance of asphalt mixture depends on the internal structure of the mixture and its properties. In the behaviour of asphalt mix, aggregate plays an important role and its constituents are approximately 90% to 95% of the total weight of asphalt mixture. In the past studies it is shown that, the arrangement of aggregates within the internal structure determines the serviceability and performance of the mixture of asphalt. The performance of asphalt mix has direct effect of orientation and segregation of aggregate. The inner structure of asphalt mix plays a major role in resistance to distress, which include cracking, rutting due to fatigue, lower temperature and changes in temperature (E. Masad B.M., 1999).
In asphalt mixture the permeability depends on several factors like compaction, contents of air voids, thickness and mix gradation. The researchers concluded that the permeability of Super-pave asphalt mixtures has significant effects on permeability due to aggregate gradation and air voids content (Mohammad et al., 2003). To study the segregation and orientation of aggregates in hardened concrete image analysis technique was applied. The technique of Image analysis can confidently be used for estimating orientation and aggregate segregation (Khan and Khan 2014).
Specimen of different aggregate gradation and composition were prepared in laboratory. Laboratory permeability and X-ray computed tomography (CT) technique were applied on that asphalt specimen to contemplate its inner anatomy. The mix made up of enormous totals was high size air voids and volume of associated air voids. The difference in mineral structure of total was found to have extensively less effect on penetrability of permeable asphalt (Król et al. 2018).
performance of asphalt mixture depends on the position, shape, and size of the particle in the specimen, and the method of compaction (Hunter et al. 2004). Asphalt internal structure and orientation of aggregates is greatly influenced by the compaction method (Hunter et al. 2004) Asphalt internal structure and orientation of aggregates is greatly influenced by the compaction method (Hunter et al. 2004). The performance of asphalt concrete and cement concrete mainly depends on the distribution and orientation of aggregates in the mix. The mechanical properties are obtained from specimen of cement concrete and asphalt concrete having same mix design and air voids content. Aggregates are different due to its segregation and orientation that includes shape of particles, size of particles, position of particles and its method of compaction, these all aspect greatly influence the performance of asphalt mix (Hunter, Airey, and Collop 2004). Resistance of asphalt concrete to distresses that include cracking and rutting, thermal and low temperature changes all these depend on the internal structure of asphalt (Masad et al. 1999).
The performance of asphalt mix is greatly influenced by the aggregate distribution and orientation. In the past studies, the internal structure of asphalt concrete is ignored and was assumed as a heterogeneous material. It is reported that the asphalt concrete strength and its deformation is not only affected by the volume fraction but its microstructure has also great effect on its aggregate distribution. For study the mechanical behaviour of asphalt concrete it is needed to study more accurately the internal microstructure component (Absi et al. 2016). To measure the sizes of air voids at different levels in the asphalt specimen, techniques were used are an X-ray computed tomography method along with image analysis technique (Masad et al. 2002)
It is very important and difficult to quantify the aggregate of the specimen of asphalt mix due to the 3D form and its composite structure. Asphalt mix is composed of three elements: aggregate, mastic and air. Every one of these three is described by its position, shape, properties, segregation and distribution in specimen (Hunter, Airey, and Collop 2004). Mastic is composed of fines and asphalt binder. Fines are the particle passing from sieve200 that is the sizes finer than 75 microns. The distribution, proportion and interaction of these elements describes the micromechanical behaviour of asphalt mix (H.M. Zelelew et al. 2008). The properties of asphalt mixture strongly depend on the gradation of the aggregate and their skeleton in the mixture. Due to the movement of vehicles on the pavement through which stresses are transmitted though their adjacent layers. The asphalt mixture’s internal structure is main interest for road and infrastructure engineering and to study these effect by developing the imaging technique method (Bruno et al. 2012). The internal structure and distribution is the key factor and responsible for the performance of asphalt pavement. The performance of asphalt mixture which have significant effect on it due to the aggregates distribution and orientation in asphalt mixture (Hassan et al. 2012).
II. OBJECTIVES
The main objective of this research to investigate the segregation and orientation of course aggregates in different asphalt samples, on its edges and midpoints on a visible surface area, and to improve understanding of inner structure of asphalt mix through analysis of image. To study permeability of pervious concrete from internal voids connectivity in asphalt concrete from image analysis.
III.EXPERIMENTALPROGRAM:
As the main focus is on the process of analysis of image, the type selection of aggregates is quite important in terms of differentiation in the bitumen and aggregate. Main purpose of this section of the thesis is to present methods used for mix design, specimen preparation and air voids content measurement of the specimens that is induced during distinct techniques of compaction.
A. Compaction methods
The compacted methods considered are as: (a) Gyratory compaction, this using the principle of vertical 0.6 MPa pressures, an external gyration angle of 1.25 degree with 30 gyrations per minute to compact a specimen in a mould (available in 100 mm and 150 mm diameter) to the target density. (b) Slab compaction: The produces slabs of 300 mm by 300 mm by 100 mm in height. (c) Vibratory compactor: The compaction in this method is achieved by a vibrating Kango hammer, applied to both faces of the specimen. Specimens of 100 mm-200 mm diameter may be prepared by using this method.
B. Preparation of Specimen
IV.IMAGEANALYSIS
Study of the image analysis has been used for the purpose to make the differentiation of the specimen in its internal structure. Already discussed, image analysis is able to evaluate the asphalt specimen internal structure. Through this image analysis internal structure of the specimen can be quantified and orientation of the specimen, size of the specimen and differences in the method of compaction could be understood.
A. Thresholding of an image
In the image analysis this technique is applied to describe the segment of the blend. Through this strategy the grey size of the components is converted to the value. The images are thresholded within the asphalt mixture with the goal that the grey worth can be allotted to the air voids and structure of aggregates.
The picture is thresholded so a grey value can be relegated to aggregates and to air voids mastic inside the blend of black-top. At that point for finding the particular number of picture and recognizing the segment of microstructure of the mixture of asphalt these distinctive grey qualities are connected. The thickness of the segment in the black-top blend is changed by the grey value and it show far off qualities. So the accuracy of the assessed information from the particular picture depend on the picture quality for example the brilliance, complexity, and clamor and so on subsequently some additional work and care is obligatory in expanding the picture quality and diminishing the commotion.
The grey values after thresholding are adjusted in the ImageJ software (the image analysis tool). The pixel size of the image can be remodel using the tools of image analysis. Image can be analyzed once the grey value is selected.
Fig. 1 (a) Original slice (b) Thresholded slice (c) Aggregates in the slice
B. Acquisition of Data and Analysis via Image
The ImageJ is openly available software used for the analysis and processing of image. Aggregates of each specimen are analyzed after loading the image in the software. These macros were loaded in the software and run on each image. The necessary filters are applied to the images through these macros and convert it to the binary image. Afterward, the aggregate boundaries are detected, labeled and the required data are calculated.
The required data of all the aggregates are put in the program. Then all the data is generated in the ROI manager of software. The data is exported to the spreadsheet, to get all the required information regarding the aggregates. The following analysis of the aggregates in image are provided by the ImageJ.
1) Area; by setting the scale that is either in the defined unit
2) Centroid, i.e. the X and Y coordinates
3) Perimeter
4) Feret diameter; in an aggregate it is the longest distance between any two points
5) (X Start and Y Start) it is the starting coordinates of the feret diameter
255
0
X (pixels) Y (pixels)
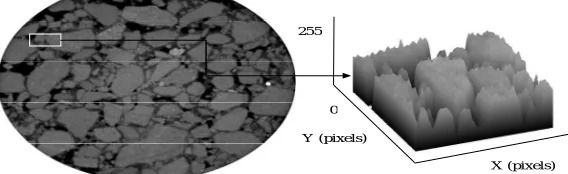
[image:3.612.99.515.316.433.2] [image:3.612.163.447.625.712.2]Fig. 3 Distribution of grey value in an image
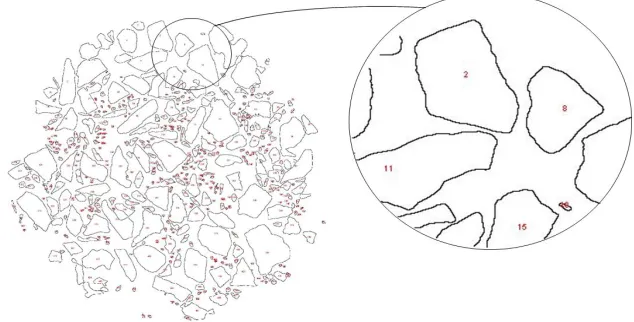
[image:4.612.160.450.84.297.2]Fig. 4 Component of aggregates are extracted in the analysis of image from 2D analysis of image
Fig. 5 2D image aggregate component of asphalt mixture
0 256
Count: 3211264 Min: 0
Mean: 162.414 Max: 255
[image:4.612.147.464.550.711.2]Fig. 6 (a) asphalt 3D image (b) 2D image section
V. RESULTS
From the process of the analysis of images of the specimen the values of segregation, orientation and permeability are determined in the following research.
A. Segregation of Aggregates
Segregation of aggregates is the main factor to evaluate the microstructure of asphalt mix. Generally, the poor performance of the asphalt layer is due to the segregation problem.
Types of Aggregate Segregation
1) Segregation at Peripheral: The segregation at the peripheral can be determined sector wise and was resolved through the splitting of 10 degrees each sector. Therefore the entire cross section consists of thirty six sectors and each sector of 10 degrees. The particle numbers are counted down in every sector. The aggregate numbers that are present in each sector are counted and can be determined through moving the X-section in steps of 10 degrees.
Fig. 7 Schematic representation of peripheral segregation
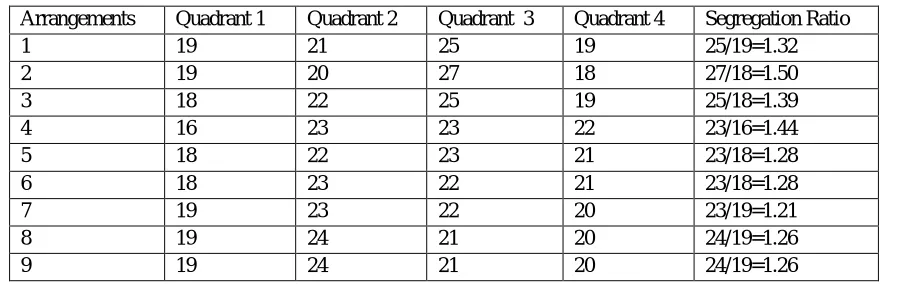
2) Ratio of Segregation: Ration of segregation is a main parameter to quantify the distinction in the methods of compaction. The ratio of segregation can be defined by the following formula i.e.
Ratio of segregation at peripherals = (quarter of maximum aggregate) / (quarter of minimum aggregates) 1
Arrangements Quadrant 1 Quadrant 2 Quadrant 3 Quadrant 4 Segregation Ratio
1 19 21 25 19 25/19=1.32
2 19 20 27 18 27/18=1.50
3 18 22 25 19 25/18=1.39
4 16 23 23 22 23/16=1.44
5 18 22 23 21 23/18=1.28
6 18 23 22 21 23/18=1.28
7 19 23 22 20 23/19=1.21
8 19 24 21 20 24/19=1.26
9 19 24 21 20 24/19=1.26
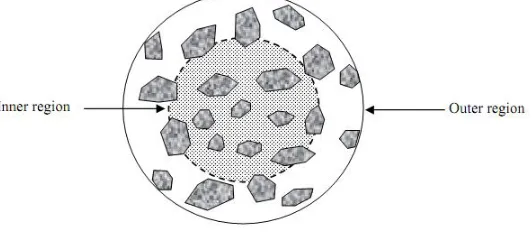
[image:5.612.176.432.386.509.2] [image:5.612.84.533.583.725.2]3) Local Segregation: It is noticed, the local segregation by splitting the cores x-section in equal area into the outer and inner regions. The respective region of the average VSA was calculated. The local segregation is schematically shown in the figure below. In the following research, the local segregation was defined as;
[image:6.612.176.442.143.259.2]Ratio of Local Segregation = (Outer region) / (Inner region in average VSA) 2
Fig. 8 Schematic representation of Local segregation
4) Particle Numbers and Visible Surface Area: In order to evaluate the differences in specimens prepared by different sources, distribution of aggregates is separated into the following two factors, area of particles and the particles number. Both these factors were taken from the image the acquisition of data. When the images are taken from the samples for the analysis of images, through the use of data the area of particles and the number of particles were investigated in every sample. Furthermore, the distinction in the distribution of particles was examined in every range of VSA. The main purpose of this segment is to know the distinction in the samples by noticing the area of particles and the number of particles.
Table 2 From the image analysis of X ray CT the data of aggregates extracted
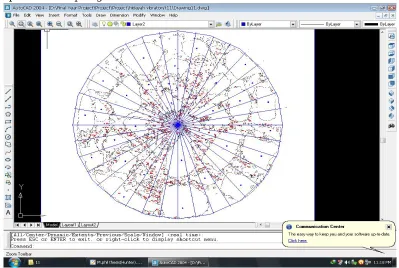
[image:6.612.144.472.371.531.2] [image:6.612.151.462.562.720.2]5) Measuring Aggregate Segregation: Firstly the analyzed image is imported to the AutoCAD. Radial lines are drawn from the center of the specimen at 100 spacing as shown below.
Fig. 10 Radial lines in Auto CAD
Fig. 11 Segregation of aggregates, sector wise
[image:7.612.103.506.94.683.2] [image:7.612.106.505.100.368.2]Table 3 Typical detail of number of particles in every sub-section
B. Orientation of Particles
The main purpose of the following unit is to calculate the distinction in the direction of particles in every sample that is compacted through different means and types.
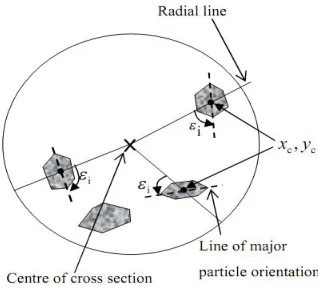
The orientation angle is determined as the slight point between the outspread line and the orientation of the real particles. The radial line is the line radiating from the center of the specimen towards the center of the particle.
Fig. 12 Showing the radial line, orientation angle, and the major particle orientation line
Where represents the orientation angle
The orientation angle ε ranges from 00 to 900. If ε = 900 it means that all the particles are circumferentially aligned. And if ε = 00 it means that all the particles are radially aligned. And if ε is something else than the range in between from 900 to 00 then it means that all the particles are randomly aligned.
Types of Particle Orientation
1) Circumferential Orientation: The particles having the angle of orientation equal to 900 are circumferentially oriented as shown below.
[image:8.612.232.391.319.464.2]2) Radial Orientation: The particles having the angle of orientation equal to 00 are radially oriented as shown below.
Fig. 14 Radial orientation
3) Random Orientation: The particles having the angle of orientation other than 00 and 900 are randomly oriented.
Fig. 15 Types of orientation
4) Measuring Particle Orientation Angle :The particle orientation is utilizing the data acquired from picture investigation programming. Examining particles that are elongated with respect of positioning, the particles of aggregates were analyzed. In this condition, the particles of aggregates of which the ratio of elongation is more than 2:1, which is to be selected in the software of computer.
[image:9.612.129.490.288.487.2] [image:9.612.194.422.569.707.2]The reason of selection of elongated particles is because regular or circular particles will have no effect on orientation angle.
Fig. 17 Radial lines and Particle major axis line
Individual particles are shown in the following figures.
Fig. 18 Radial lines and Particle major axis line
[image:10.612.114.495.92.320.2]5) Measuring Angle
[image:10.612.38.489.302.724.2]Similarly angle of orientation is measured for all particles are as follows;
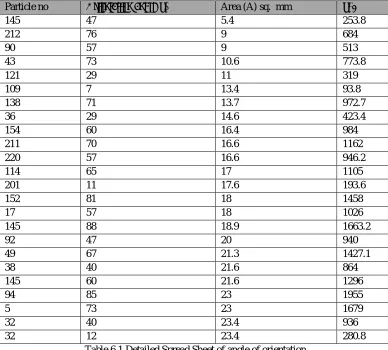
Particle no Orientation angle(ε) Area (A) sq. mm ε*A
145 47 5.4 253.8
212 76 9 684
90 57 9 513
43 73 10.6 773.8
121 29 11 319
109 7 13.4 93.8
138 71 13.7 972.7
36 29 14.6 423.4
154 60 16.4 984
211 70 16.6 1162
220 57 16.6 946.2
114 65 17 1105
201 11 17.6 193.6
152 81 18 1458
17 57 18 1026
145 88 18.9 1663.2
92 47 20 940
49 67 21.3 1427.1
38 40 21.6 864
145 60 21.6 1296
94 85 23 1955
5 73 23 1679
32 40 23.4 936
[image:11.612.111.499.90.440.2]32 12 23.4 280.8
Table 6.1 Detailed Spread Sheet of angle of orientation
6) Weighted Orientation: Weighted orientation is defined by the formula given by Weighted Orientation = ∑ (ε*A) / ∑(A)
Where;
ε is the orientation angle of each particle.
A is the area of each particle.
To determine the weighted orientation, it is required to divide the particles into the different area ranges called VSA (visible surface area). The weighted orientation is then determined for each VSA range particles by the formula mentioned above.
Following is the spread sheet showing the calculation of weighted orientation angle.
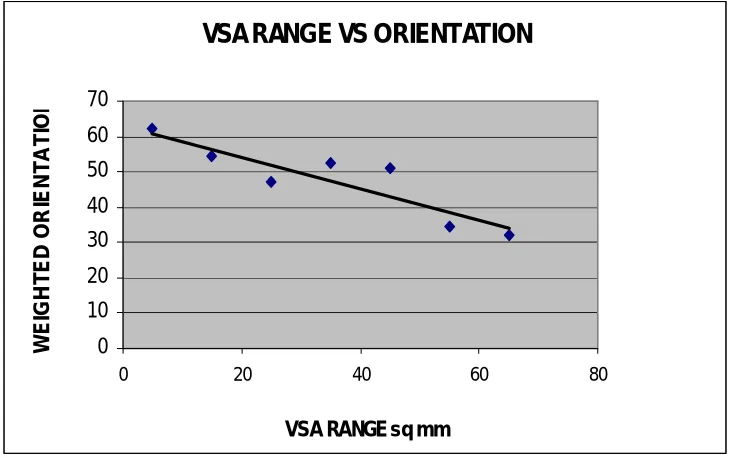
VSA Ranges Average ∑ A ∑ ε*A weighted orientation ∑ ε*A/∑ A
0--10 5 23.4 1450.8 62
10--20 15 222.4 12060.7 54.22976619
20--30 25 567.37 26624.32 46.92585086
30--40 35 380.4 19943.4 52.42744479
40--50 45 675.2 34356.5 50.88344194
50--60 55 326.4 11241.3 34.44025735
60--70 65 206 6638 32.22330097
[image:11.612.79.541.579.719.2]These different VSA ranges are plotted against orientation angle as shown below.
VSA RANGE VS ORIENTATION
0 10 20 30 40 50 60 70
0 20 40 60 80
VSA RANGE sq mm
[image:12.612.123.490.94.323.2]W E IG H T E D O R IE N T A T IO N
Figure 19: VSA range VS orientation
7) Summary: Different specimen compacted differently, having different mixing process, aggregate sizes, source etc. will have different orientation slope. So with this powerful technique we can correlate the properties of different asphalt mixtures.
C. Permeability of the Specimens 1) Connectivity of the air voids:
In this research for evaluating the permeability the internal air voids connectivity are to be figured out. The internal voids connectivity is the main cause of permeability in the mix of asphalt.
Therefore, to deals with the study of permeability in the asphalt mix, the air voids connectivity was resolved from the sample using the technique of X-ray. In software of image analysis, a program was evolved for the determination of voids of air in the volume of asphalt sample. A dedicate sheets were prepared for every slice of the image that include the coordinates of air voids, size of the air voids, and its maximum diameter and radius. To quantify each and every air void in each slice a method was used called SI (Similarity Index).
SI (i, z) min = min (|xi,z –x - xj,z+1| + |yi,z –y - y j,z+1|)
Where;
i
value range from 1 to n
j
value range from 1 to m and
n
and m shows the air voids number in the x-sections of two adjoining slices z and z+1
The definition of SI is to find out whether the air void in the one slice is connected with the adjacent slice or not. Whether found the connectivity of air voids, the volume of that connectivity is saved of that voids. The circular shape of the air voids is considered and from the images of X-ray the diameter is found out of the each void.
Two times this program was run,
a) From top slice towards the bottom slice and the top slice was considered first slice and bottom slice as the last slice.
Fig. 20 Program for the connectivity of voids of air
D. Flow Chart
After the X ray CT when all the images are acquired, so along, during the process of quantifying the segregation and orientation in each image, study the air voids. From the start, mark the air void in the primary picture and review the availability of that connected air voids in the pictures below. In the event that the air void isn't associated in the picture with the adjacent image so no worries, eliminate that path. And if the air void is in connection with the air void in the adjacent image so evaluate the size and coordinated of the connected air voids. Check it for all the images and when reaches to the last image, find the quantity of the available air voids that is connected.
Hence, the voids that are continuous in each slice from first slice to the last slice that is considered permeable because through the capillary action water can be easily go through the asphalt sample.
Fig 21 (a) Before saturation (b) After saturation
For the sake of saturation the sample of asphalt mix was fully immersed in water for a whole day (24hrs) before the X ray CT. this is done to be assumed that the sample is saturated and far-off all the trapped air. The above two shows the samples before the saturation and after the saturation.
VI.CONCLUSIONS
The technique of image analysis is applicable for both, for asphalt as well as applicable for the concrete. So the internal microstructure properties of plain concrete and reinforced concrete should be examined.
The sample that have distinct size of aggregates, different type of mix design, different process of mixing and have different sources of materials, different source of crushing and different method of compaction in term of segregation and orientation of the particles in the samples. The technique of image analysis, using which we could compare the internal microstructure properties of concrete or asphalt and could compare the segregation and orientation of particles both the types. Previously in this research several samples are compared.
[image:13.612.144.457.78.267.2] [image:13.612.173.443.419.511.2]A. Recommendations
Recommendations are related to the basic measures that should be taken in order to achieve best orientation and uniform particle distribution in the field. This is in order to simulate the lab specimen properties in the site mixed and compacted asphalt.
1) Aggregates
a) Gradation of aggregates should be carefully done.
b) At the asphalt plant, the stock piles of different aggregates should be kept at a distance apart to avoid mixing.
c) Dry aggregates should be used.
d) Aggregates should not have voids.
e) They should also be free from organic impurities.
f) Aggregates should not be flank as flank aggregates have less strength as compared to the cubical aggregates.
g) Aggregates should resist abrasion, because it causes the regularity of particles which results in weak bonding.
h) Surface of aggregates should be rough for better bond.
i) Normally there should be wide range of sizes of aggregates in order to efficiently fill the voids.
j) Reliable source of aggregates and crushing equipment should be used.
2) Bitumen
a) Increase in bitumen content will result in bleeding; causing flow and low compressive strength, furthermore decrease in bitumen will result in weak bond between aggregates and the bitumen, resulting in low compressive strength. So the bitumen should be in proper proportion.
b) Grade of bitumen used should be according to the atmospheric condition.
c) Properties of bitumen should be such that it should not be subjected to the thermal cracking and the fatigue cracking.
3) Practices: Segregation is one of the causes of reduction of compressive strength which is caused by:
a) Worn out paving apparatus i.e. pavers
b) Worn out pavers should not be used
c) Labors and asphalt plant operators should be well aware of the impact of malpractice and deviation from the standards.
d) Improper compaction
e) Improper mixing
f) Improper pouring
These all should needed to overcome at the site
REFERENCES
[1] Absi, J, F Fakhari Tehrani, F Courreges, and C Petit. 2016. “8th RILEM International Conference on Mechanisms of Cracking and Debonding in Pavements.” 13: 687–94. http://link.springer.com/10.1007/978-94-024-0867-6.
[2] Bruno, Leonardo, Giuseppe Parla, and Clara Celauro. 2012. “Image Analysis for Detecting Aggregate Gradation in Asphalt Mixture from Planar Images.” Construction and Building Materials 28(1): 21–30. http://dx.doi.org/10.1016/j.conbuildmat.2011.08.007.
[3] H.M. Zelelew, A.T. Papagiannakis, E. Masad. 2008. “Application of Digital Image Processing Techniques for Asphalt Concrete Mixture Images.” Image Processing (January): 1–6.
[4] Hassan, Norhidayah A., Gordon D. Airey, Rawid Khan, and Andrew C. Collop. 2012. “Nondestructive Characterisation of the Effect of Asphalt Mixture Compaction on Aggregate Orientation and Segregation Using X-Ray Computed Tomography.” International Journal of Pavement Research and Technology 5(2): 84–92.
[5] Hunter, A.E, Gordon D Airey, and Andrew C Collop. 2004. “Effect of Asphalt Mixture Compaction on Aggregate Orientation, Segregation and Mechanical Performance.” 8th Conference on Asphalt Pavements for Southern Africa (CAPSA’04) 4987(September). http://hdl.handle.net/2086/6668.
[6] Iwama, and Masahiko. 2009. “Iwama , Masahiko ( 2009 ) Influence of Specimen Size and Orientation on the Mechanical Properties of Laboratory Compacted Asphalt Specimens . MPhil Thesis , University Influence of Specimen Size and Orientation on the Mechanical Properties of Laboratory C.”
[7] Khan, Arsalaan, and Rawid Khan. 2014. “ArsalaanAndRawidKhan Imaging Techinque to Study Seggregetgtion.Pdf.” : 6.
[8] Król, Jan B., Rawid Khan, and Andrew C. Collop. 2018. “The Study of the Effect of Internal Structure on Permeability of Porous Asphalt.” Road Materials and Pavement Design 19(4): 935–51. http://dx.doi.org/14680629.2017.1283355.
[9] Kuity, Ambika, and Animesh Das. 2016. “Study on Aggregate Size Distribution in Asphalt Mix Using Images Obtained by Different Imaging Techniques.” Transportation Research Procedia 17(December 2014): 340–48. http://dx.doi.org/10.1016/j.trpro.2016.11.105.
[10] Masad, E. et al. 2002. “Characterization of Air Void Distribution in Asphalt Mixes Using X-Ray Computed Tomography.” Journal of Materials in Civil Engineering 14(2): 122–29.
[11] Lo Presti, Davide et al. 2014. “Laboratory Mix Design of Asphalt Mixture Containing Reclaimed Material.” Advances in Materials Science and Engineering 2014: 1–11.